The union of ray tracing and AI is pushing graphics fidelity and performance to new heights. Helping you build optimized, bug-free applications in this era of rendering technology, the latest release of NVIDIA Nsight Graphics introduces new features for ray tracing development, including tools to help you harness AI acceleration.
Check out what’s new in the NVIDIA Nsight Graphics 2024.1 release video.
Beta early access Vulkan Shader Debugger
Available in Nsight Graphics Pro, the long-requested Vulkan Shader Debugger introduces a robust toolkit for inspecting and debugging shaders.
This enables you to debug complex shaders that are hundreds or thousands of lines long in real time. It runs entirely on the GPU, and your application executes live while you drill down into shader code. Graphics run at full speed until a specified breakpoint is hit, so there’s no performance impact when navigating to the debug location, and minimal overhead when debugging.
The debugging workflow is similar to traditional IDEs. You can step through code execution and inspect shader state and variables in flight. Dive into call stacks, SASS disassembly, and how threads execute within warps.
The Focus Picker helps you match the output of your render target to the shader code that generates it. It can show you how shaders are built in your frame. With this, you can easily debug graphical issues that are difficult to find by normal code stepping.
Early access to the Beta release of Vulkan Shader Debugger is available now in Nsight Graphics Pro. Request access by coordinating with your NVIDIA Developer Technologies or Developer Relations contact, or reach out to the Nsight Graphics team.
GPU Trace improvements
Nsight Graphics GPU Trace enables you to examine and optimize how frames execute. Nsight Graphics 2024.1 makes it easier to examine the key API calls in your frame with a new events list view, for quick visual inspection of API parameters, launch dimensions, swapchain properties, and more. You can also use the events list for detecting the overuse of heavyweight calls like SetDescriptorHeaps() or vkCmdBindDescriptorSets().
AI is multiplying graphics performance while delivering sharper images than ever. Under the hood, neural graphics SDKs like NVIDIA DLSS harness NVIDIA CUDA and low-level AI libraries called NGX. To help integrate DLSS into your Vulkan graphics application, you can now view NVIDIA SDK workloads and shaders directly in the GPU Trace timeline, events list, and shader pipelines view. This feature will be extended to support more graphics APIs in future releases.
Trace Analysis also automatically examines performance markers to find slowdowns impacting your application and then recommends how to fix them. In the 2024.1 release, Trace Analysis delivers a convenient top three issues impacting performance per marker, so you quickly know what to prioritize.
GPU crash full resource history
As frustrating as they are, GPU crashes can be a common roadblock in graphics development. So we’re powering up NVIDIA Nsight Aftermath SDK to make finding the reason for a crash and the steps to resolve it much easier.
The next release of Nsight Aftermath will provide a full history of GPU resources leading up to a crash. This dramatically improves your ability to locate the reason for difficult-to-debug crashes. This resource history can be viewed using the Nsight Aftermath dump viewer in Nsight Graphics.
NVIDIA Nsight Perf SDK 2024.1
NVIDIA Nsight Perf SDK is a low-overhead graphics profiling toolbox that collects performance metrics directly from an application.
This includes a real-time performance HUD that exposes GPU metrics, including clock frequencies, PCI bandwidth, VRAM throughput, shader activity, and more. The HUD solution can be added to any application, or you can use the low-level Nsight Perf SDK API to build your own performance analysis workflow and generate HTML reports.
The latest release adds a one-shot sampling mode that captures performance at a specified point in your application’s execution with high-frequency sampling. By taking a snapshot, you can examine hardware activity without prolonged overhead. Nsight Perf SDK high-frequency sampling collects key GPU metrics in sharp detail. You can visualize unit throughputs, warp occupancy, draw calls, and more in the new timeline viewer.
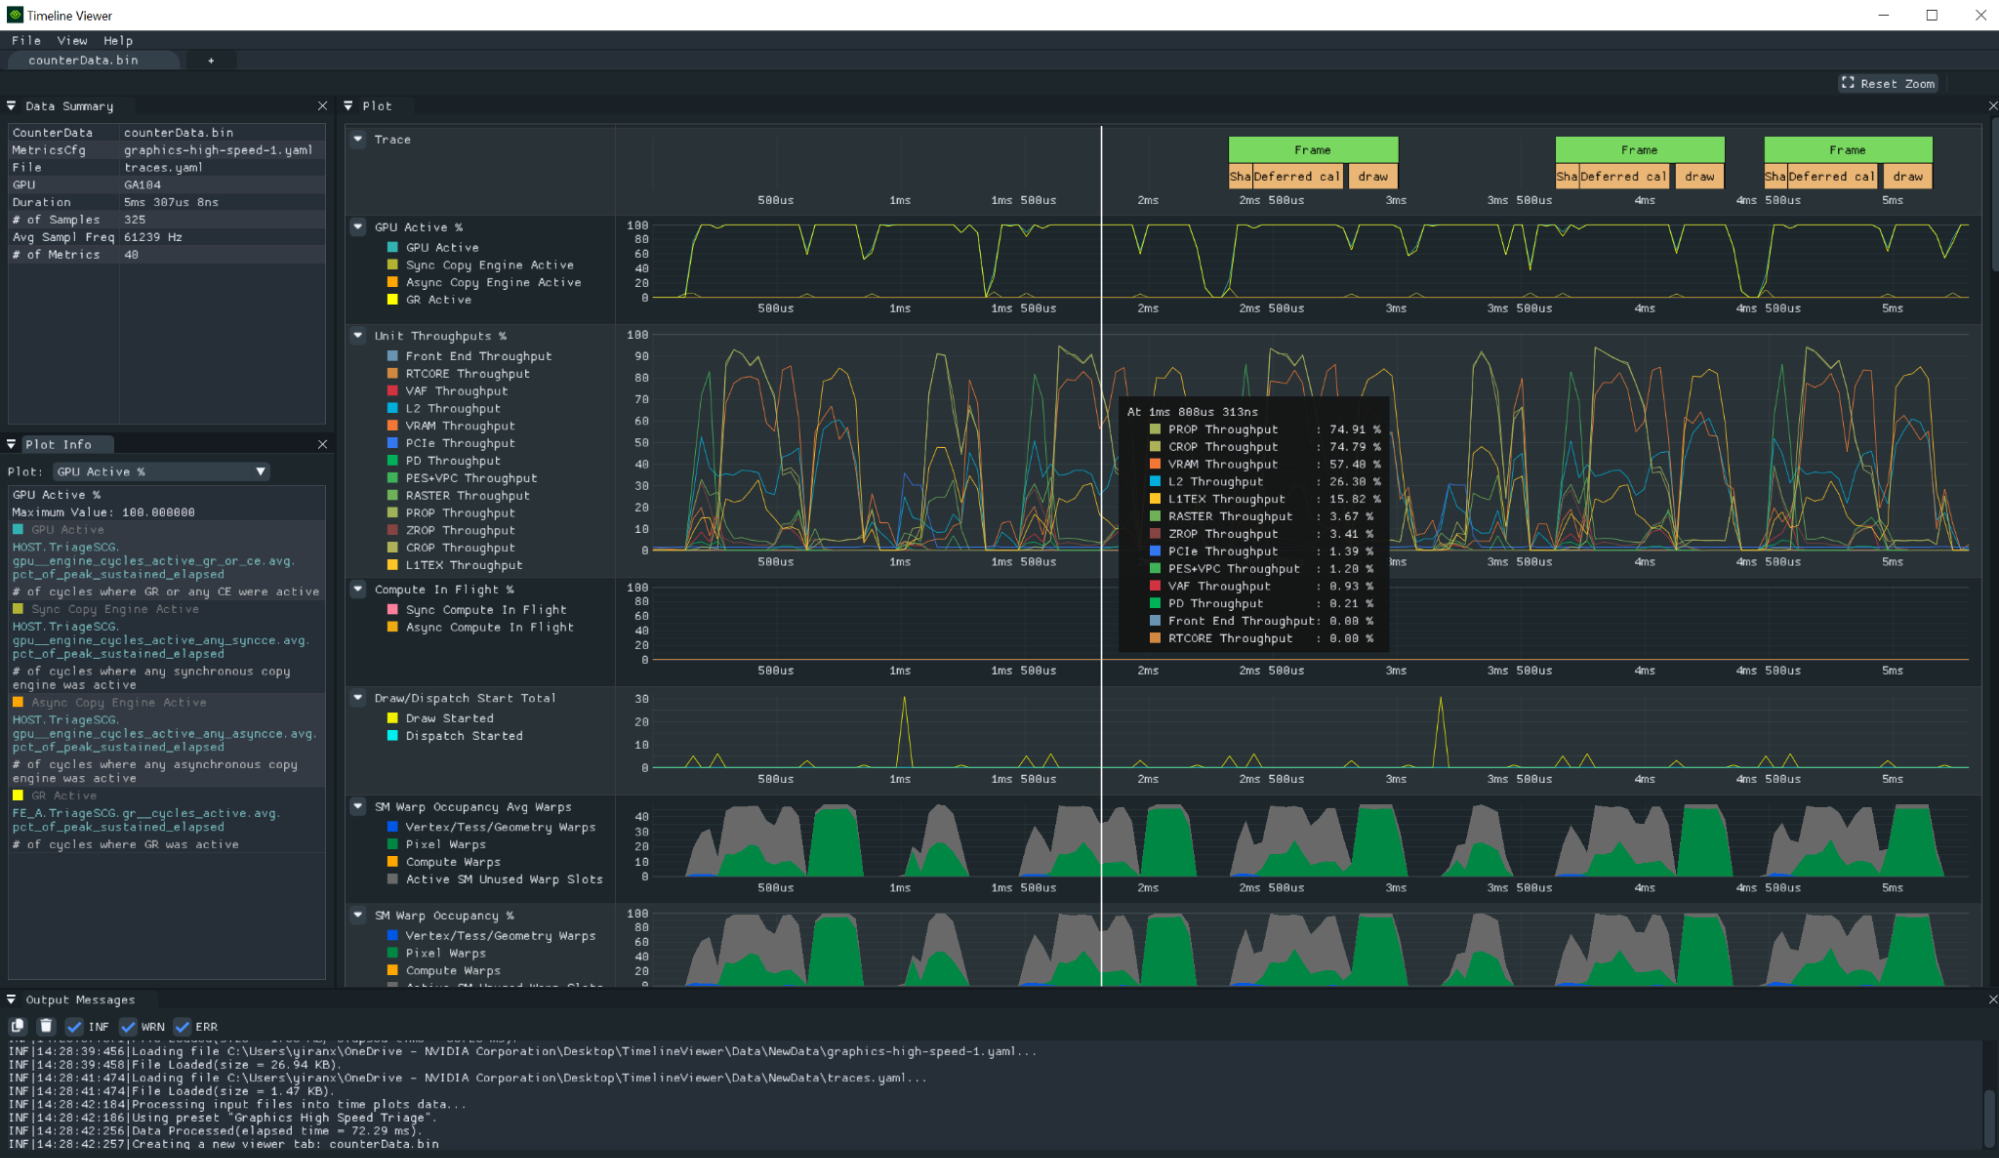
Vulkan and Direct3D 12 sample code is provided in the release. These demonstrate how to instrument the samples to collect GPU performance metrics and how to visualize the data in a timeline viewer.
Get started
Nsight Graphics 2024.1 is available now. You can also download the latest version of Nsight Aftermath SDK and get started with Nsight Perf SDK. Ask questions and engage with the community of Nsight Tools users on the NVIDIA Developer Forums.
