NVIDIA Nsight Perf SDK
The NVIDIA® Nsight™ Perf SDK is a graphics profiling toolbox for DirectX, Vulkan, and OpenGL enabling you to collect GPU performance metrics directly from your application.
Get Started


Realtime Perf Triage
Enable high-level performance triage via realtime collection and on-screen visualization of GPU performance metrics. The new GPU Periodic Sampler collects device-level metrics at high sampling rates with low overhead.

Profile In-Application
Integrate GPU performance metric collection into your application or graphics developer tool of choice. Activate profiling from your own custom programmatic triggers. Choose the list of GPU metrics to collect, customize your output, and keep control over your workflow.
Upgrade Your CI/CD
Generate detailed profiler reports on every developer and artist change. Add dedicated perf regression criteria by inspecting GPU metric values.
Realtime Performance HUD

Add continuous performance metrics collection to your code, and leverage the built-in HUD renderer to effortlessly enable real-time, high-level performance triage.
Explore panels with metrics on SM, L2 cache, ROP, VRAM and various other subunits to gain an early understanding of the performance characteristics and potential bottlenecks of the scene as you move through it.
The HUD- and Periodic Sampler-utility classes also serve as an example for creating your own powerful, low-overhead, real-time workflows on top of the low-level Nsight Perf SDK API.
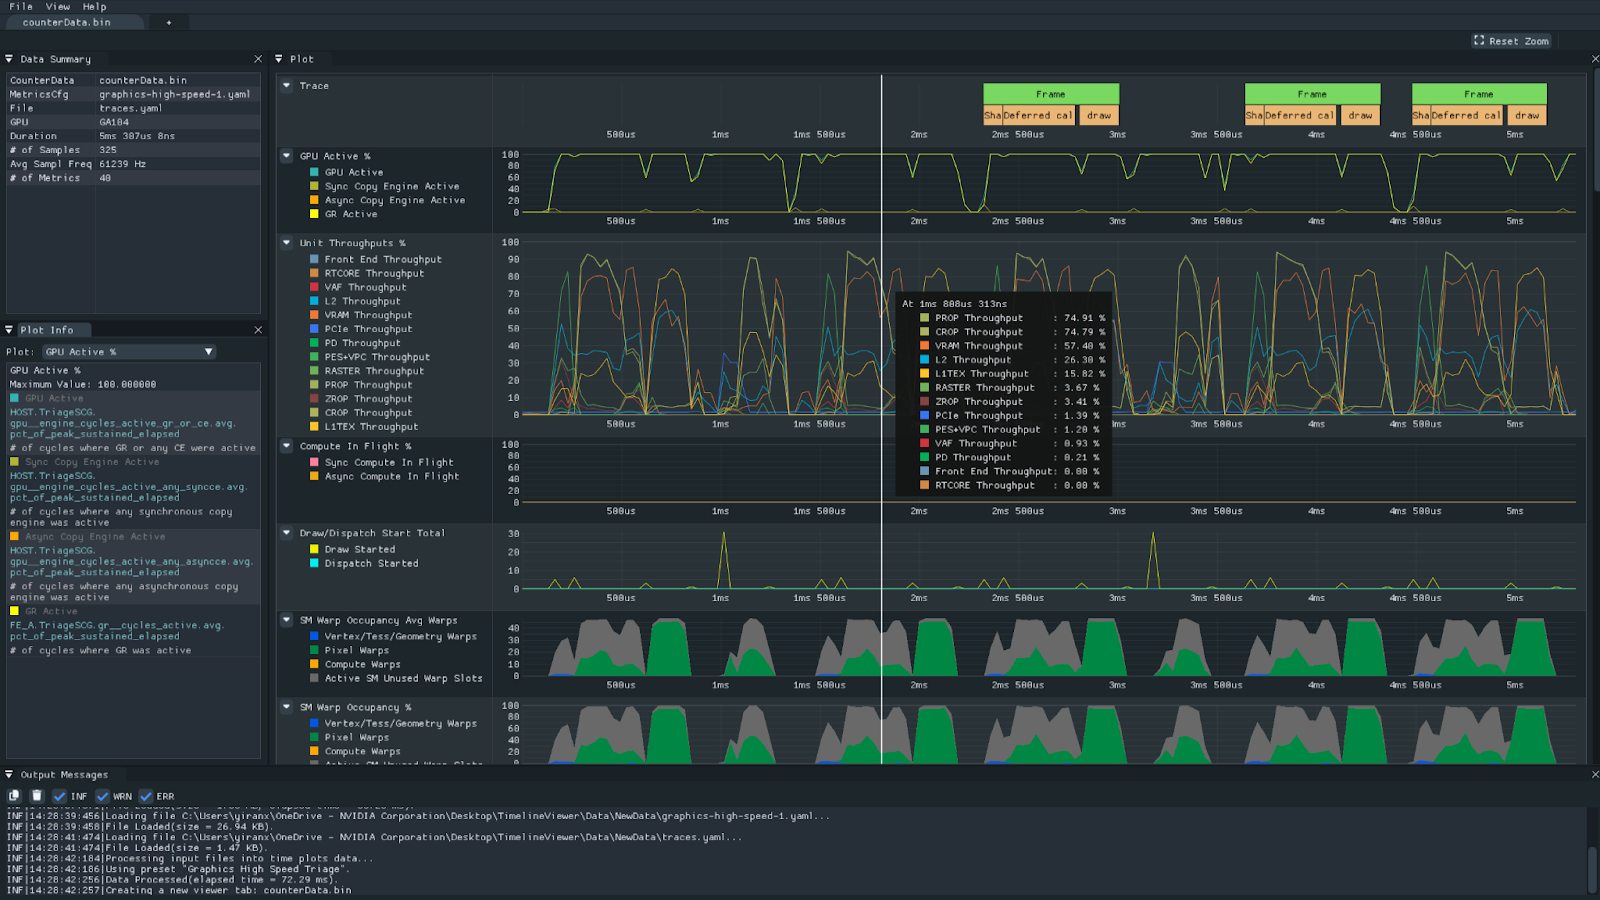
Timeline Viewer
Examine a snapshot of your application’s performance with the Nsight Perf SDK one-shot sampling mode.
This allows you to examine hardware activity with minimal overhead. Nsight Perf SDK’s high-frequency sampling collects key GPU metrics in sharp detail. You can visualize unit throughputs, warp occupancy, draw calls, and more on the new Timeline Viewer.
HTML Profiler Report Generator

Generate detailed profiler reports with minimal effort. Simply insert a few calls at Graphics API Device Initialization, Present/SwapBuffers, a Keypress handler, or an automated trigger.
Insert annotations (PushRange/PopRange) around GPU workloads to collect additional reports per region of execution. The report generator automatically collects 100s of GPU metrics of interest; there is no need to study these complex topics on first usage.
The reports provide a top-down representation of GPU performance, with fast navigation to the top performance limiters. Quickly determine the workload type, pipeline activity and utilization, shader latency reasons, and 3D data flow.
View Other Tools Within the Nsight Suite
Nsight Perf SDK is part of the NVIDIA Nsight Developer Tools suite—a collection of powerful tools, libraries, and SDKs that enable developers to build, debug, and profile software utilizing the latest accelerated computing hardware.
Nsight Graphics
NVIDIA Nsight Graphics is a standalone developer tool with ray-tracing support that enables you to debug, profile, and export frames built with Direct3D, Vulkan, OpenGL, OpenVR, and the Oculus SDK.
Nsight Aftermath SDK
Nsigh Aftermath SDK is a library that integrates into a D3D12 or Vulkan game’s crash reporter to generate GPU “mini-dumps” when an exception or TDR occurs, exposing pipeline information to resolve an unexpected crash.p>
Get Started
Nsight Systems
NVIDIA Nsight Systems is a system-wide performance analysis tool designed to visualize an application’s algorithms, help you identify the largest opportunities to optimize, and tune to scale efficiently across any quantity or size of CPUs and GPUs.
Get Started
Partners and Industry Standards


