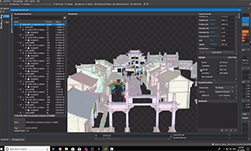
NVIDIA announces Nsight Graphics 2019.2! In this release, we greatly enhanced the DirectX Raytracing capabilities of the tool – adding DXR support for Nsight Aftermath, Acceleration Structure viewer improvements, and the ability to profile Acceleration Structure updates in the range profiler. In addition to DXR improvements, we have also added a D3D12fence visualization into GPU Trace as well as Vulkan profiling support in the range profiler! For full details on the new capabilities in the 2019.2 release, see our full release notes.
Nsight Aftermath (released 2019.1) has been promoted to Beta level support with the addition of DirectX Raytracing (DXR) support. If you run into crashes or hangs while developing your DXR application, the cause of the crash now be traced back to the exact DXR shader responsible! This feature will be fully unlocked with the upcoming NVIDIA graphics driver release in mid-April. You can find out more in the Nsight Aftermath announcement or in our helpful documentation on how to get started.
In addition to crash debugging, we have enhanced the Acceleration Structure viewer provide an even better debugging experience. You can now change the camera speed and camera orientation, visualize geometry setup flags by utilizing highlight-based filtering, and inspect the hierarchy with additional information. Additionally, extra rendering options have been added to visualize AABBs, modify the shading model, color by geometry or instance id, and disable culling – giving you even more ways to view your acceleration structure.
Acceleration Structure updates can be a significant performance limiter within a Ray Tracing application. In this release, we have added the ability to measure BuildRaytracingAccelerationStructure() calls and full update regimes – enabling users to collect detailed performance metrics for these ranges.
GPU Trace has also been updated this release to collect and visualize synchronization primitives such as D3D12Fence. Once you recapture your trace, you can see a new row added to each queue called “Synchronization”. In this row, you can see the signals and waits that can help determine if a performance bubble was due to inefficient synchronization.
Finally, this release introduces Vulkan profiling to Nsight Graphics with the addition of Vulkan support in the Range profiler. You can inspect GPU performance metrics for whole perfmarker regimes, render passes, or even single draw events – giving you the power to study how the GPU executed each event within your Vulkan frame. For more information on using the detailed metrics data in the Range Profiler, see NVIDIA expert Louis Bavoil’s blog post on the Peak Performance Percentage method.
We want to hear from you! In this release, we have added an integrated feedback button that lets you send comments, feature requests, and bugs directly to us with the click button. You can send feedback anonymously or let us know how we can follow up with you about your request!
Try out the latest version of Nsight Graphics today!
