GPU acceleration is enabling faster and more intelligent applications than ever before, and the CUDA Toolkit is key to harnessing acceleration on NVIDIA GPUs. But debugging, profiling, and optimizing CUDA can be a challenge, especially if you are unable to inspect hardware-level throughput and performance. To help you harness CUDA acceleration, NVIDIA offers Nsight Developer Tools.
CUDA Developer Tools is a new tutorial video series for getting started with CUDA developer tools. Grow your skills, apply our examples to your own development environment, and stay updated on features and functionalities. The videos walk you through how to analyze performance reports, offer debugging tips and tricks, and show you the best ways to optimize your CUDA code.
Watch the first three tutorials in the series now.
CUDA Developer Tools | NVIDIA Nsight Tools Ecosystem introduces you to the suite of tools NVIDIA offers. Learn how each is used, and how they’re built to work together.
NVIDIA Nsight Systems offers system-wide performance traces and metrics, visualization of CPU and GPU utilization, API calls, memory copies, and more.
With NVIDIA Nsight Compute, you can dive deeper with an interactive profiler for CUDA and NVIDIA OptiX applications. It provides detailed performance metrics and API debugging. Guided analysis simplifies the performance tuning process with a built-in rule set for CUDA optimization designed by NVIDIA engineers.
CUDA Developer Tools | Intro to NVIDIA Nsight Systems walks you through how to trace performance and hardware activity to better tune your CUDA application. Learn the profiling process, including project setup and configuration, and how to specify profiling targets, launch an application to trace, and view the results.
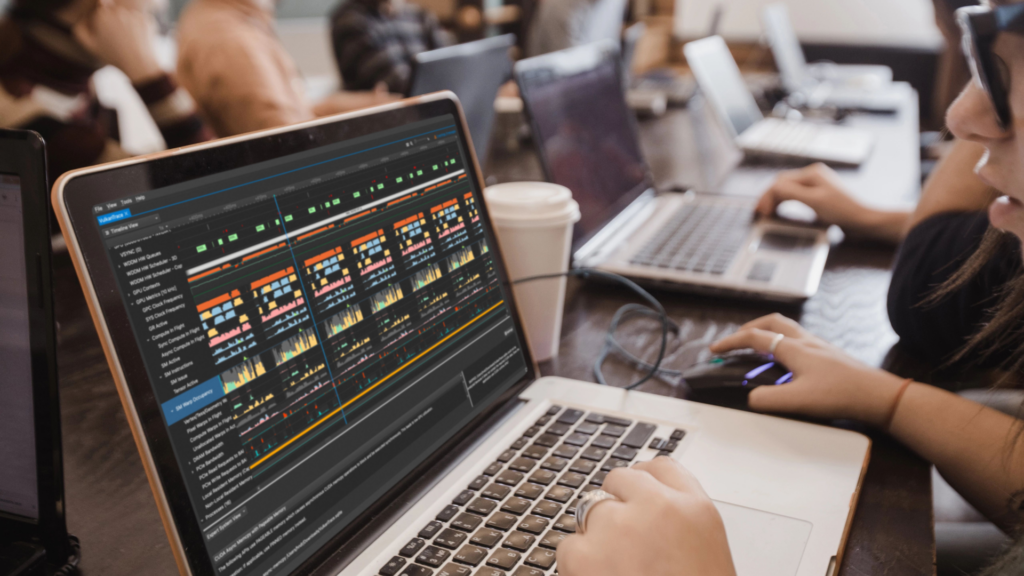
You’ll also learn how to read and analyze an Nsight Systems report. The built-in timeline view provides an intuitive visualization of system events, making it easy to understand your application’s behavior. With the timeline view, you can see CPU threads, CUDA API calls, GPU activity, and more.
CUDA Developer Tools | Intro to NVIDIA Nsight Compute explains how to use Nsight Compute to analyze CUDA kernels. You’ll learn how to set up Nsight Compute, including key capabilities and features for workload analysis. Discover how Nsight Compute collects performance metrics, and how to configure permissions for accessing GPU counters and source-level details.
The video also covers the detailed reports Nsight Compute generates, and how to read information like runtime information, speedup estimations, and more.
Stay tuned for more episodes of CUDA Developer Tools tutorials.
- Learn more about NVIDIA Nsight Developer Tools for CUDA.
- Download NVIDIA Nsight Systems.
- Download NVIDIA Nsight Compute.
- Ask questions and dive deeper in the CUDA Developer Tools forum.