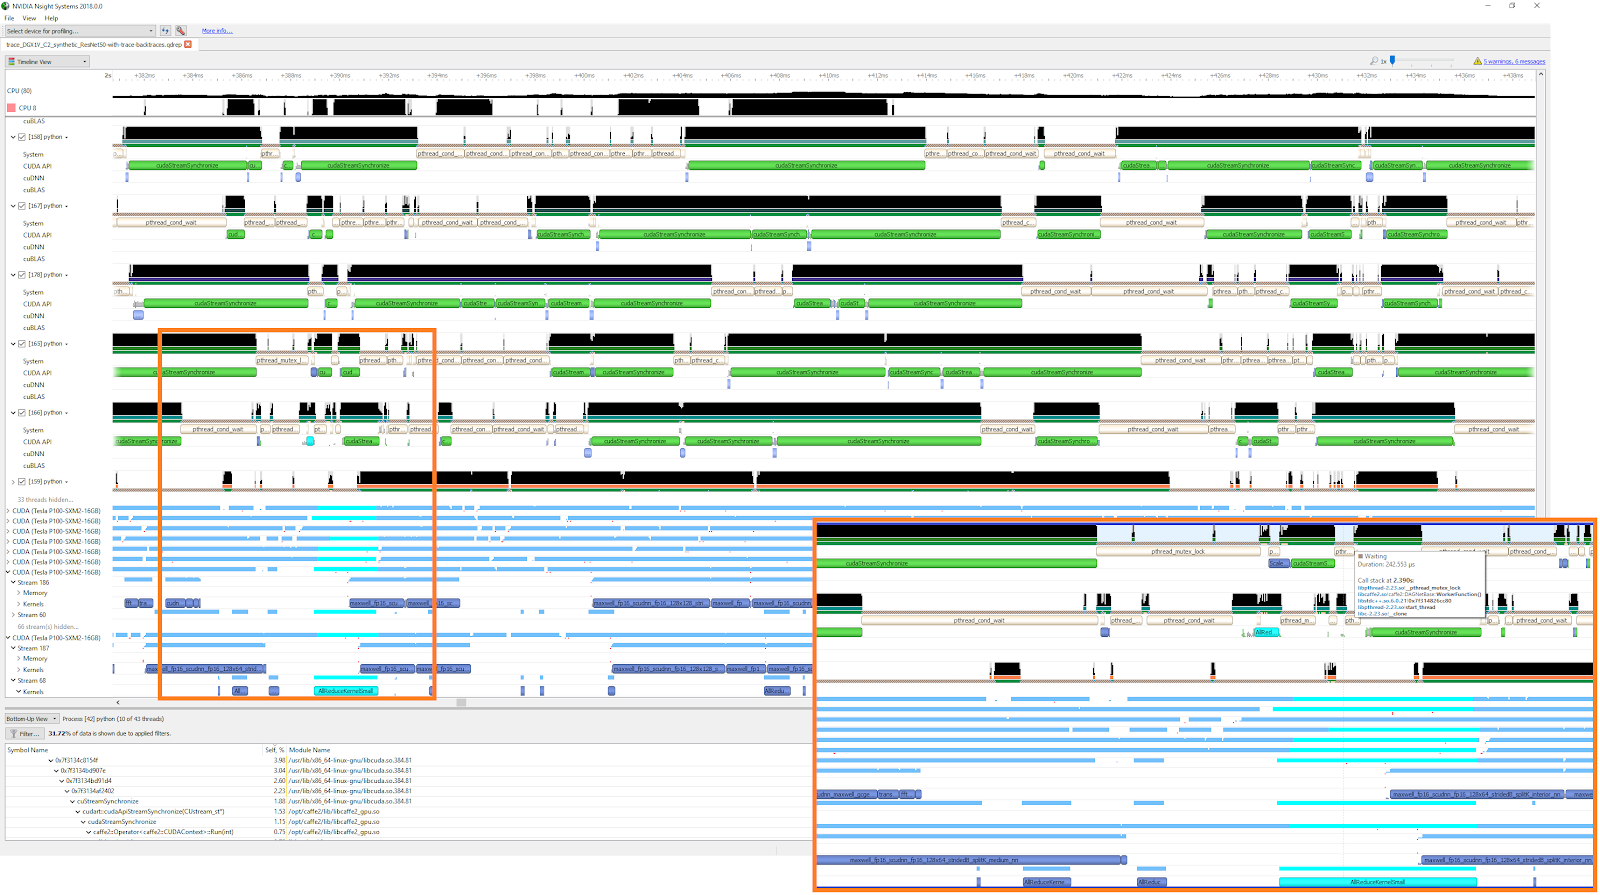
With the new NVIDIA Ampere GPU microarchitecture, developers have access to the most powerful consumer GPU NVIDIA has ever created. With such a massive improvement in performance, developers need glassbox access to understand the state of the GPU and what steps you can take to achieve peak performance. To make this possible, NVIDIA Nsight Developer Tools provide best in class coverage for multiple situations.
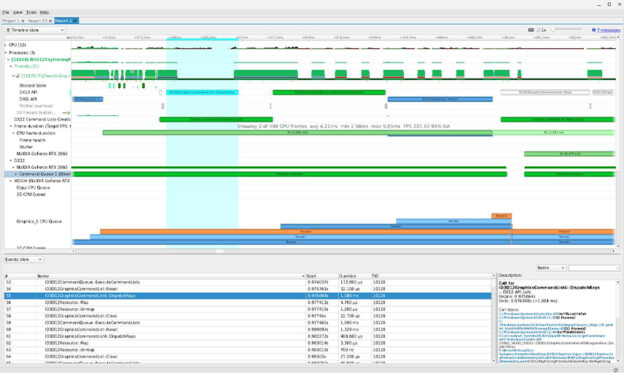
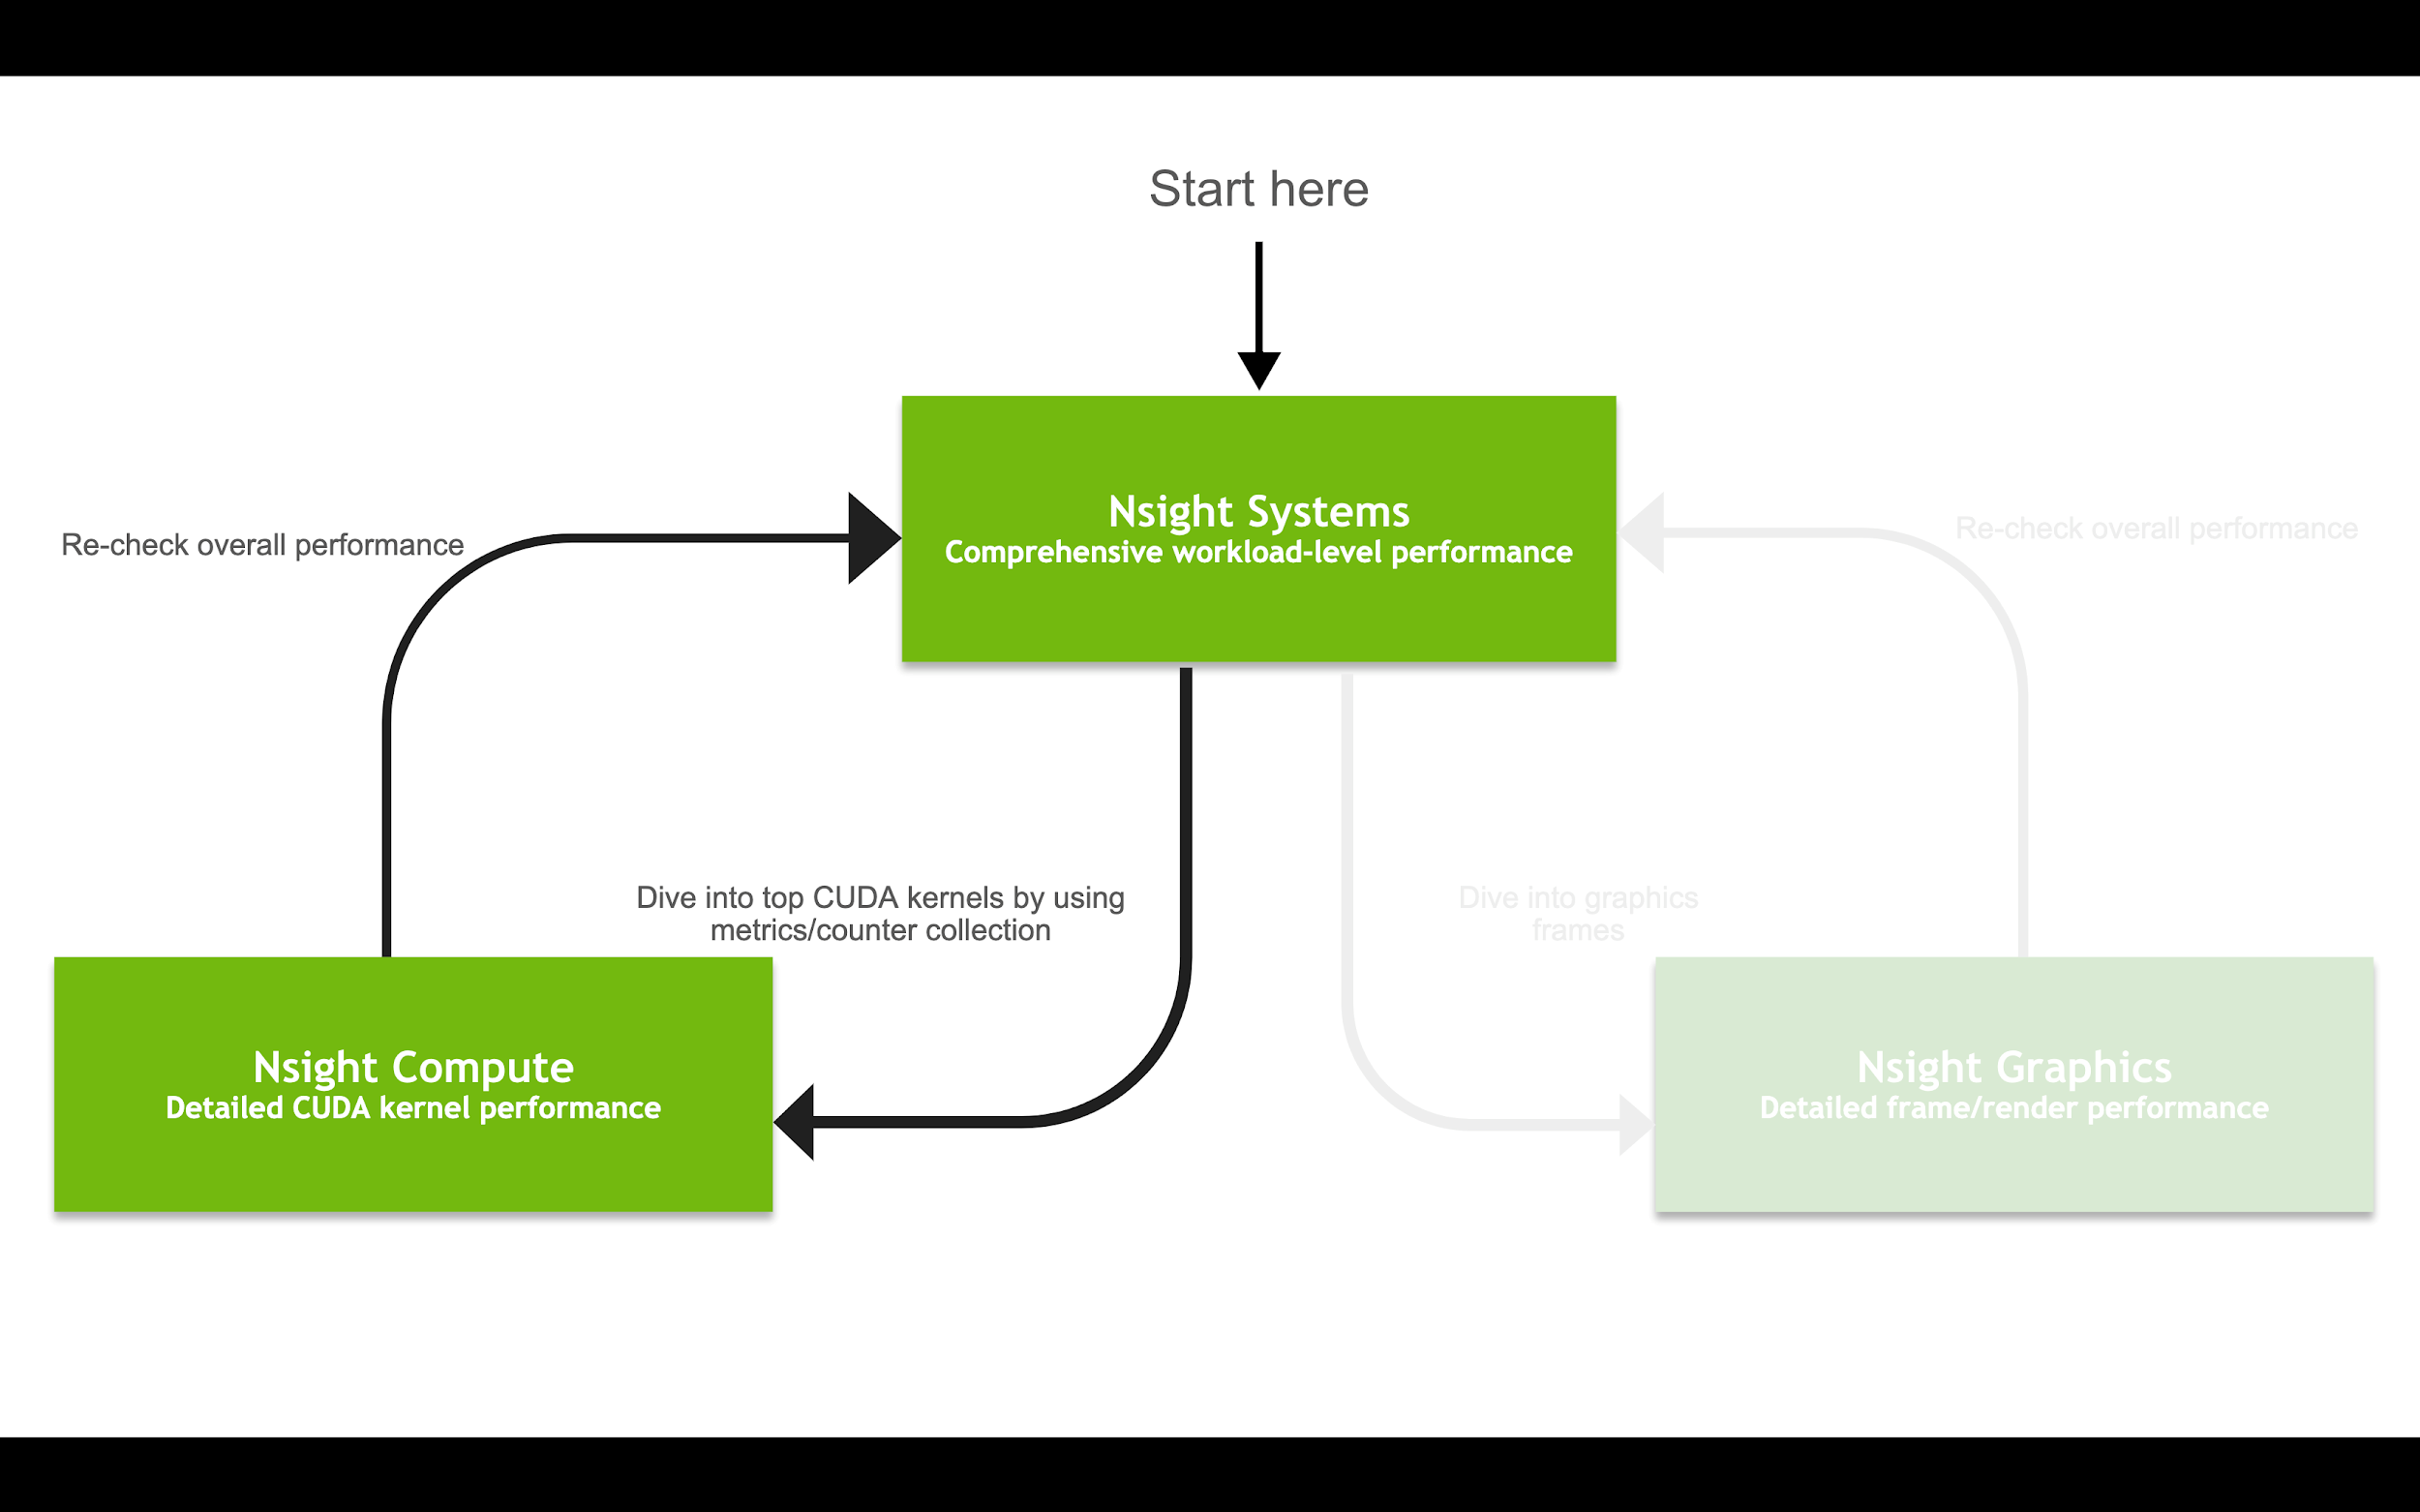
Nsight Systems provides a perfect solution for determining whether your application is limited by CPU, graphics or compute workflows. You can identify interactions that result in stutter such as mid-frame shader compilation. Inspect OptiX, Vulkan, Vulkan Ray Tracing, Direct3D and DirectX Raytracing timing in order to identify limiters that are impacting performance.
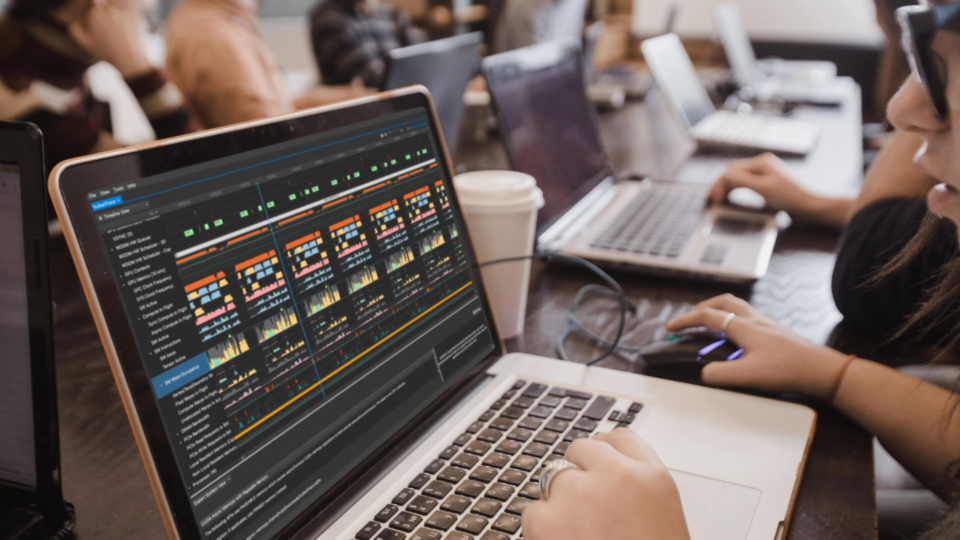
Users can work backward from GPU bubbles to the CPU algorithms or OS events that caused them. Thread utilization, state, call stack samples, API trace, and more can help you determine how to refactor algorithms to improve parallelism and avoid stutter.
Using Nsight Systems, you can determine if your workloads are limited by CPU, graphics or compute performance and use the right tool for the job.
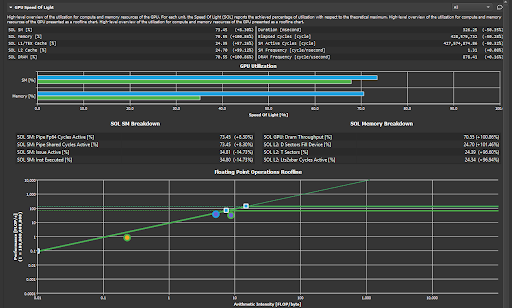
Nsight Compute and CUDA debuggers enable you to dive deeper into CUDA; NVIDIA’s groundbreaking computing platform and programming model. You can debug your CUDA code and ensure that it’s doing what you expect it to. Step line-by-line using the debugger and inspect variables. This even works for OptiX Ray Tracing applications.
You can profile code and verify that instructions are quickly executing, as well as analyze numerous performance metrics. Visualize application performance and get reports for kernels. Take advantage of roofline analysis to quickly and easily identify performance bottlenecks that help guide your optimization strategy for memory and compute usage.
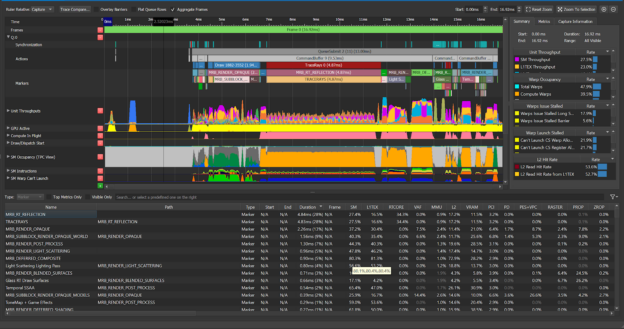
If graphics is your primary limiter, you can use Nsight Graphics. Capture and debug your frame in order to inspect API events and find hard to spot bugs. Our tools fully support NVIDIA RTX, so if you’re doing Ray Tracing using DXR, NVIDIA VKRay or the Khronos Ray Tracing extension, you can inspect your acceleration structures using our built in viewer. If shader performance is your concern, the new Shader Profiler provides detailed information on what shader instructions are being prevented from executing efficiently. By analyzing these stall reasons, you can make educated changes at the source code level to improve performance. This exciting new feature is now available in Nsight Graphics 2020.4, and can be downloaded here.
If you want to quickly dive into your application performance profile, capture a GPU Trace, which allows you to visualize performance metrics over over a few frames without stalling the GPU or requiring a frame capture. With a straightforward and intuitive user interface, we make it easy to establish workflows that allows you as a developer to quickly identify performance limiters associated with memory access, multiple queues, PCI transfer, GPU occupancy and many more metrics.
The Range Profiler provides additional number of performance metrics and allows developers to investigate the performance analysis of specific sub frame regions.
All of this works for Direct3D11, Direct3D12 and DirectX Raytracing applications. Supported on both Windows and Linux platforms, Nsight Graphics also supports Vulkan, NVIDIA Vulkan Raytracing and OpenGL applications.
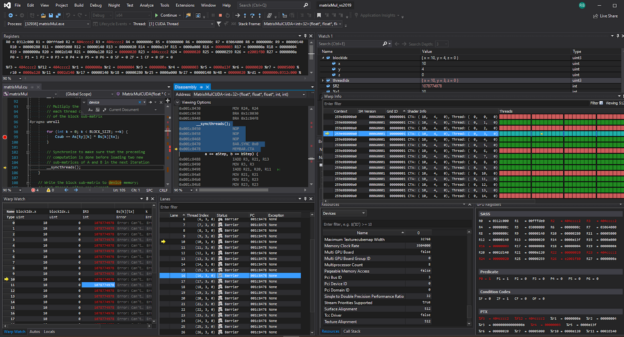
Many windows developers use Visual Studio as their primary development IDE. Nsight Visual Studio Edition’s debugger allows seamless debugging of CPU code and CUDA kernels, allowing you to break and step to any thread or warp and inspect the state of the GPU’s memory, registers, variables, and threads.
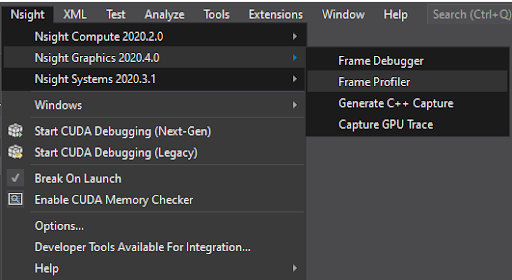
When the code is ready for performance analysis and tuning, the NVIDIA Nsight Integration Visual Studio extension allows for launching of other Nsight tools directly from Visual Studio with minimal effort by passing along all the project and build information to the desired Nsight tool activity. This configurable extension can be used with one or more tools and integrates with the Nsight Visual Studio Edition menu, as shown below.
Integration between development, debugging, analysis, and profiling yields greater productivity, which means faster time to market. Using NVIDIA developer tools, you’ll be saving countless hours while ensuring that your users have the best experience possible.
The latest version of the tools will be available soon at developer.nvidia.com/tools-overview/.
