The NVIDIA Ampere GPU architecture has arrived! It’s time to make sure that your applications are getting the most out of the powerful compute resources in this new architecture. With the release of CUDA 11, we are adding several features to the Nsight family of Developer Tools to help you do just that.
These additions improve usability, productivity, and make it easier for you to find bugs and performance issues in your compute-intensive applications on NVIDIA Ampere architecture and previous architecture generations. In addition to adding support for NVIDIA Ampere A100 GPUs, we are adding support for profiling Arm server base system architecture (SBSA) targets as well extending the supported features for Power architecture targets.
This post gives an overview for several new capabilities in the following tools:
- Nsight Systems
- Nsight Compute
- IDE integrations
- Command-line tools like cuda-gdb and Compute Sanitizer
For a high-level introduction to the Nsight tools, see NVIDIA Developer Tools Overview.
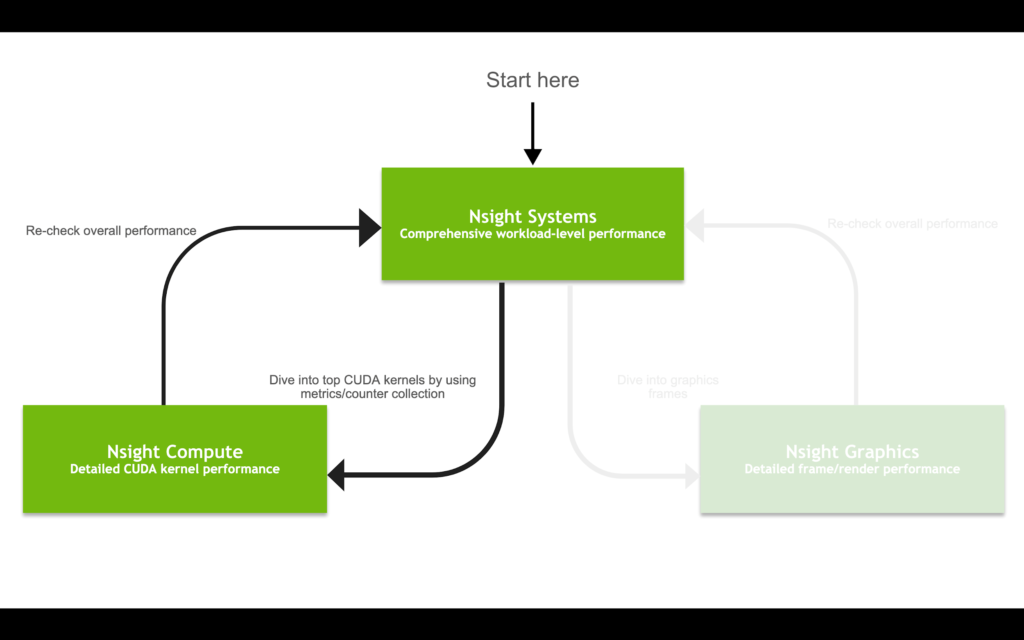
Depending on the goals of your application, you can use the various Nsight tools to trace, analyze, debug, and profile your code. As with all software development, it is an iterative process using the right tool for the right job.
This post focuses on the compute-side of developer workflows, as opposed to graphics, as shown in Figure 1. For more information about the recent Nsight Graphics update, see NVIDIA Announces Nsight Graphics 2020.2.

Nsight Systems 2020.3
Nsight Systems is the starting point for performance analysis of workloads that use both the CPU and GPU. It helps you identify the cause of complex performance issues as your application interacts with the entire system.
GPU starvation typically stems from underlying problems with non-optimal CPU-GPU coordination patterns, unexpected complex OS behaviors, or inefficient or ineffective thread pipelining and parallelism in an application’s algorithms.
HPC support has grown significantly after previous versions to include features such as MPI, OpenACC, OpenMP, improvement in the CLI to support multiple simultaneous sessions, and complex data mining capabilities to enable you to go beyond basic statistics. Professional visualization has improved with OptiX support, enhanced graphics interop trace, as well as a more detailed view of the Windows GPU subsystems.
MPI and OpenACC Trace
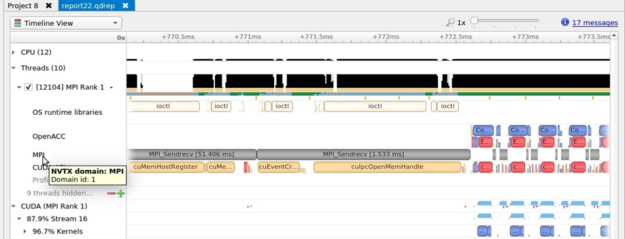
The MPI trace feature shown in Figure 2 enables you to analyze when your threads are busy or blocked in long-running functions of the Message Passing Interface standard. Support is available for libraries compatible with OpenMPI and MPICH.
OpenACC trace similarly enables you to see where code has been offloaded and parallelized onto the GPU, when decorated with the OpenACC compiler directives. These features help you understand and analyze the activities executing on the CPUs and GPUs in parallel.
OpenMP 5 trace
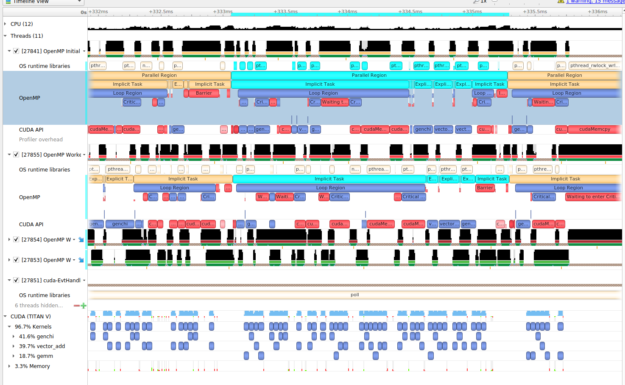
OpenMP is one of the most popular programming paradigms for multi-threaded parallelism. Tracing OpenMP code is now available for compilers supporting OpenMP 5 and the OMPT interface.
This new capability enables tracing of the parallel regions of code that are distributed either across multiple threads or to the GPU. This improves your ability to visualize the full behavior of your parallel application and correlate all the activity on the same timeline, as shown in Figure 3.
OptiX trace
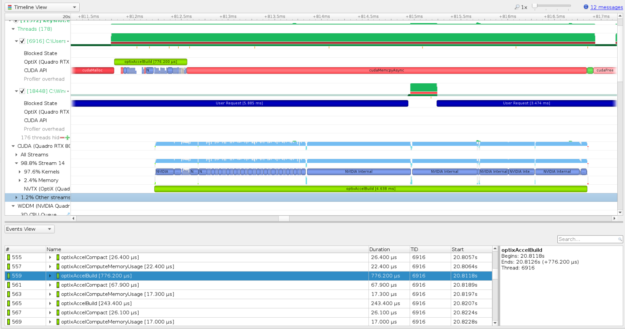
As the OptiX framework continues to grow in popularity, there is more need to profile and optimize these applications. Now, you can trace key OptiX functions on the CPU and GPU in Nsight Systems. OptiX GPU work appears like CUDA kernels and correlates from the CPU launch to the GPU workload in the CUDA stream that you provided to schedule the work (Figure 4).
This feature is available with OptiX 7.1, the drivers included with CUDA 11 toolkit, and the upcoming release of Nsight Systems 2020.3, which was released on the web simultaneously with the CUDA 11 toolkit.
Graphics API and Windows GPU subsystems support
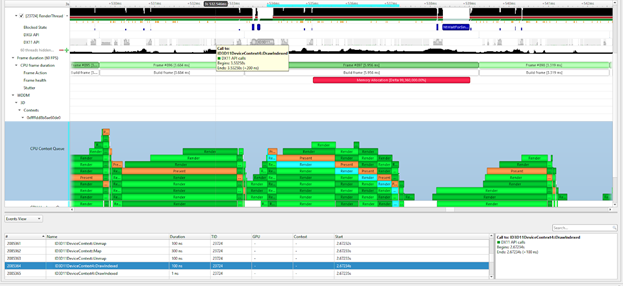
Nsight Systems is now capable of showing trace information on the CPU and GPU for OpenGL, Vulkan 1.2, Vulkan ray tracing extensions, Direct3D11, Direct3D12, DXR 1.1, and DirectML. On Windows, you are also able to visualize the Windows Display Driver Model (WDDM) queues for rendering, compute, copying, paging, and so on, as seen in Figure 5. This provides extra insight into how the Windows subsystems are involved in the orchestration of GPU compute and rendering.
CUDA Graph node correlation and NVTX projection
CUDA Graphs and NVTX extensions also help you program for the GPU and understand the behavior of the programs that you create.
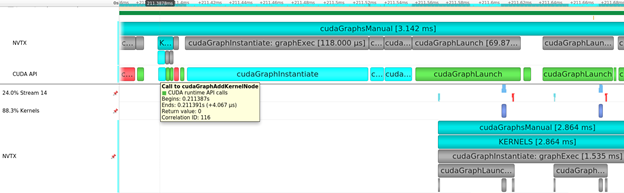
To help you understand the execution of the source of your CUDA kernels and execution of CUDA Graphs, kernels can now be correlated back through the graph launch, instantiation, and all the way back to the node creation, to identify the origin of the kernel executing on the GPU. Figure 6 shows that NVTX can also be projected through the same sequence so that all relevant ranges are available on the GPU CUDA stream visualization. This helps your contextual understanding, using annotations, of when and why a kernel was launched on the GPU.
While Nsight Systems is typically presented using its GUI, it also contains a rich set of command-line interface and data mining features, which have been dramatically improved over the version bundled with CUDA 10.2. You can now collect multiple reports over time from a single launch of an application and collect from multiple applications in parallel with multi-session support. You can also process your reports further with the commands for export and statistics (stats). For more information, see the Nsight Systems: Command Line Interface Feature Spotlight video.
Nsight Compute 2020.1
After you have used Nsight Systems, or other methods, to determine that GPU compute kernels are negatively impacting performance, it’s time to dig into them with Nsight Compute.
Nsight Compute provides a detailed, low-level analysis of CUDA kernels running on the GPU. It identifies hardware bottlenecks and provides advice to help you address them. This new release adds even more features to help you find and fix issues.
Roofline analysis
The Roofline model for performance analysis is quickly becoming one of the most useful methods for identifying compute and memory bottlenecks caused by hardware limitations. The model uses information about a workload’s arithmetic intensity (the ratio of memory reads vs. compute instructions) and the platform’s theoretical performance limits to determine whether a specific performance limit (roof) is causing a bottleneck.
The roofline model could previously be built by hand using measurements from performance analysis tools. This release automates that process and provides a preconstructed roofline chart for profiled compute kernels. Figure 7 shows an example of a roofline chart.
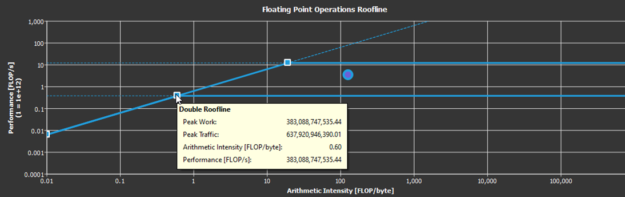
Roofline analysis gives you a visual representation that reveals whether your optimization efforts are likely to improve performance because of a hardware limit. Compute kernels near the bandwidth roofline must increase their arithmetic intensity to improve performance, and kernels near the compute rooflines may already be maximizing the compute resources. Kernels significantly below these boundary thresholds have more room to benefit from optimization.
Visualization of NVIDIA Ampere GPU architecture memory features
The NVIDIA Ampere GPU architecture comes with tons of new features to boost performance. Nsight Compute has added capabilities to help you understand how your workloads are taking advantage of this. Two examples are the new CUDA asynchronous copy and sparse data compression.
CUDA asynchronous copy enables data to be moved directly from the L2 cache into shared memory without needing to route through the register file. This saves both time and data movements. You can track the amount of data sent over this asynchronous copy as shown by the asynchronous copy line in Figure 8.
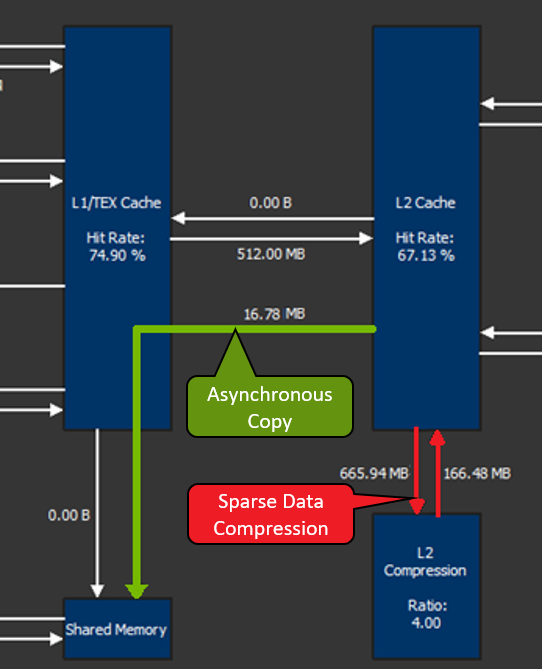
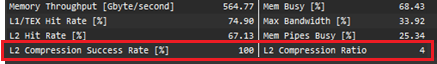
The NVIDIA Ampere GPU architecture also has hardware support for sparse data compression in the L2 cache. Certain data structures, like sparse matrices, may take up lots of unnecessary space in memory. Historically, compression has been done through software, but this addition of hardware support adds another level of performance optimization.
Nsight Compute shows the amount of data compressed through this feature (red emphasis in Figure 8) as well as the overall success rate and compression ratio (Figure 9). Understanding whether your application is taking advantage of the latest hardware features and if it is doing so efficiently is paramount when transitioning to a new platform.
Enhanced Speed of Light metrics
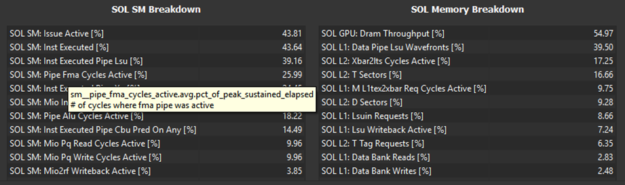
The Speed of Light (SOL) metrics in Nsight Compute are the heart of the performance optimization process. These metrics represent the important GPU hardware components and indicate how close they are to reaching their theoretical peaks, also known as their Speed of Light.
Recent releases of Nsight Compute expand this table of metrics to help you pinpoint the exact cause of GPU bottlenecks slowing down your workload (Figure 10).
There are many other new features in Nsight Compute that can’t all be covered in this post, including result filtering by NVTX domains, new hot spot tables, cross-linking between result sections and recommendations, and improved documentation. For complete details, see the Nsight Compute User Manual.
IDE integration
Every developer works in their own unique environment, so we’ve designed Nsight tools to integrate with the most popular IDEs. The CUDA 11 compilers and debuggers continue to be integrated into both Visual Studio and Eclipse IDEs through Nsight Visual Studio Edition and Nsight Eclipse Edition.
With this new release, we add access to the Nsight Compute and Nsight Systems analyses through the Visual Studio environment. Now you can launch the analysis tools right from the IDE. Figure 11 shows how the Nsight projects automatically import information from your project properties.
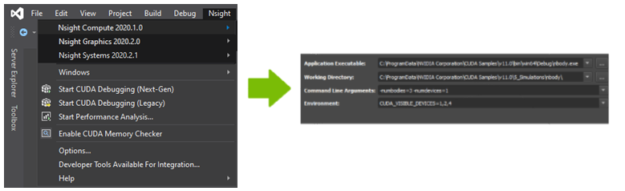
This integration makes the performance analysis of applications developed in Visual Studio seamless. Now you can focus on optimizing the code instead of worrying about the overhead of getting it all set up.
Command-line tools
We know the command line is still an important part of many developers’ workflows. While Nsight Systems and Nsight Compute also have command line interfaces, we’ve made improvements to the other command-line only tools as well.
The cuda-gdb debugger has several improvements, including significantly reducing module load times, improved handling and lineinfo debug information, and easier debugging with parallel cuda-gdb sessions. We have also upgraded to GDB 8.2 and brought back support for macOS X as a host operating system.
We are also releasing the new Compute Sanitizer tool, which is a complete rebuild and replacement of the cuda-memcheck tool. Compute Sanitizer is a functional correctness checking tool that helps you identify memory and threading errors in your CUDA code. The new Compute Sanitizer is built with several performance improvements, particularly for applications running on Windows and applications with lots of compiled functions and function calls such as heavily templated code or large CUDA libraries.
Summary
As you can see, our tools team recognizes the power of the new NVIDIA Ampere GPU architecture and is working hard to make sure that you can take full advantage of it. Whether you’re an experienced user or brand new to the Nsight family of tools, you should definitely try these features out for yourself when CUDA 11 is released for general availability. Let us know what you think.
Learn more about NVIDIA developer tools by following the GTC Digital content as we release on-demand sessions online. For product information including downloads, see NVIDIA Developer Tools, and connect directly through the user forums.
