NVIDIA GPUs are becoming increasingly powerful with each new generation. This increase generally comes in two forms. Each streaming multi-processor (SM), the workhorse of the GPU, can execute instructions faster and faster, and the memory system can deliver data to the SMs at an ever-increasing pace.
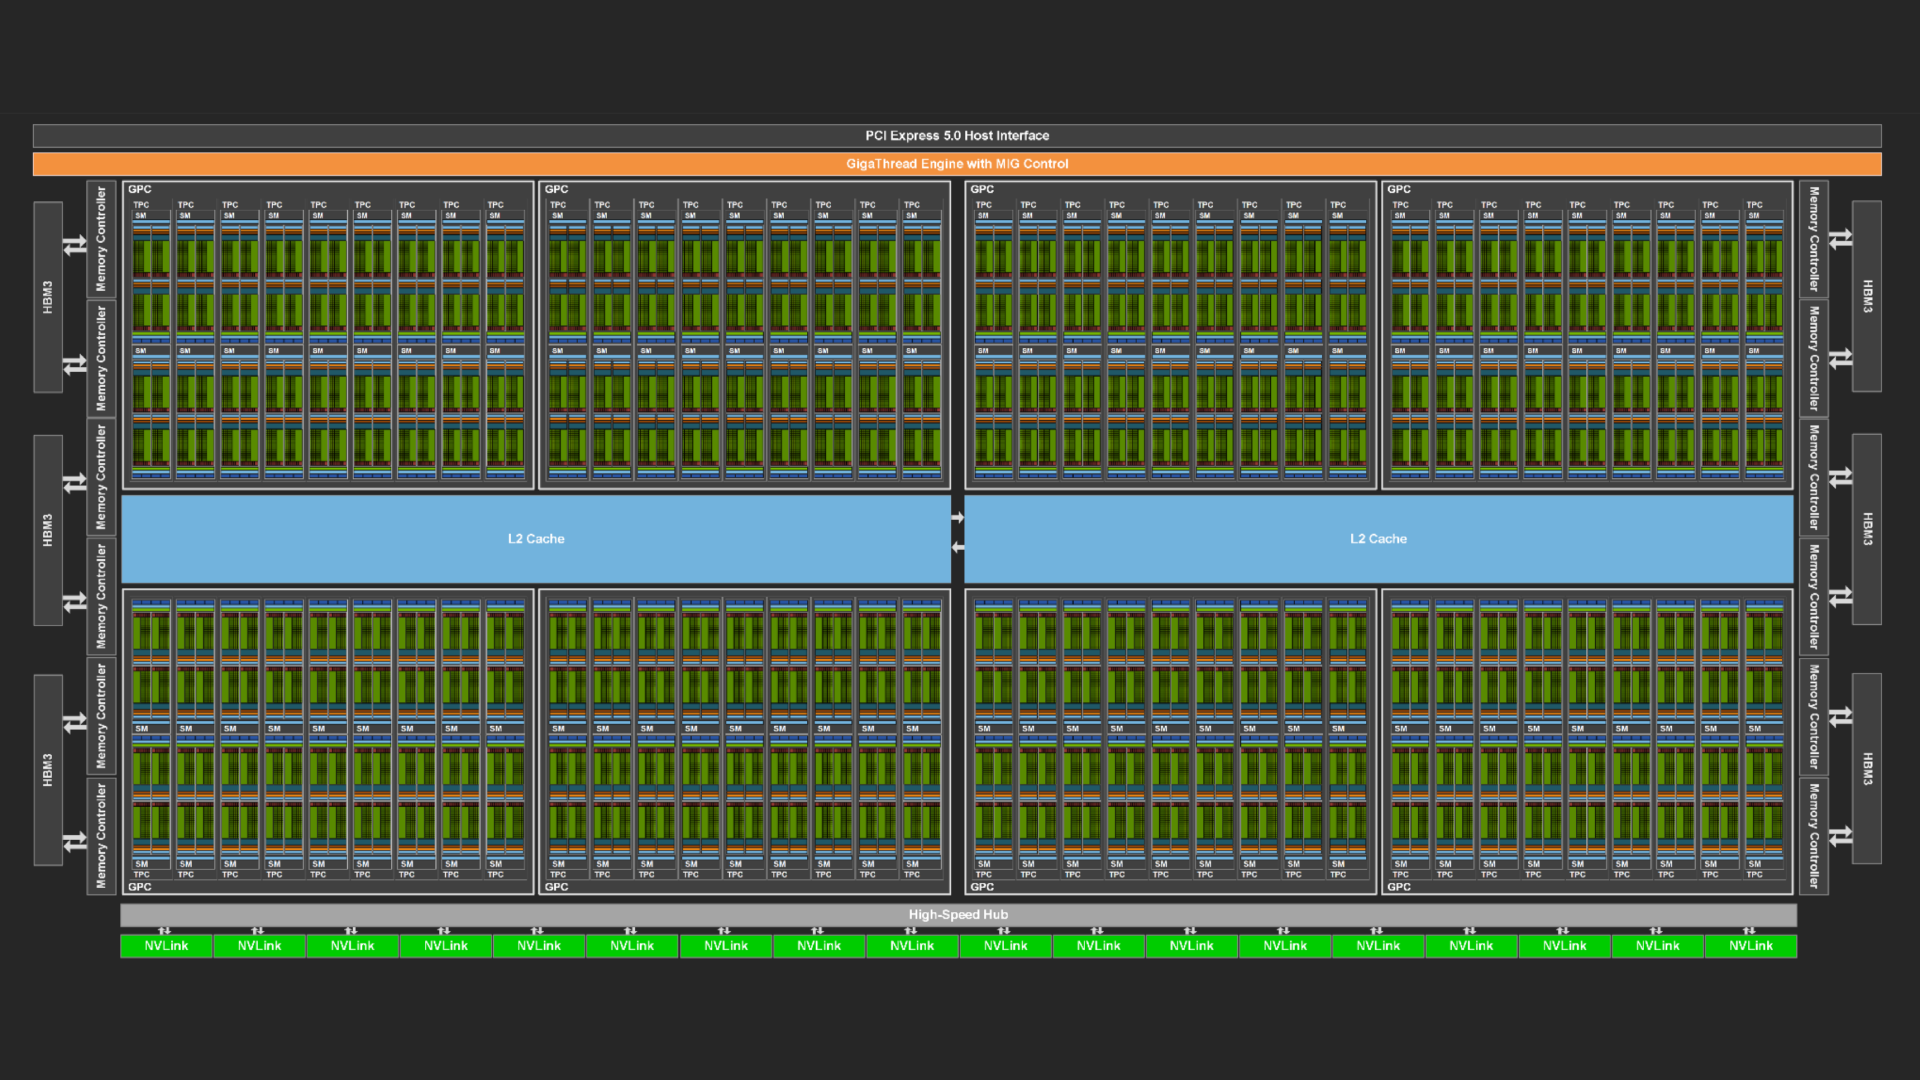
At the same time, the number of SMs also typically increases with each generation, which boosts the amount of computational concurrency that the GPU can support. For example, NVIDIA Volta, NVIDIA Ampere, and NVIDIA Hopper GPUs sport 80, 108, and 132 SMs, respectively.
In some cases, this growing concurrency creates a conundrum. Workloads to be run on the GPU must expose a corresponding level of concurrency to be able to saturate the GPU resources. A common way of doing this is by sending independent tasks to the GPU using multiple streams or, similarly, using the CUDA Multi-Process Service.
This post presents a way to determine whether these approaches are successful in occupying the GPU.
Santa Clara, we have a problem
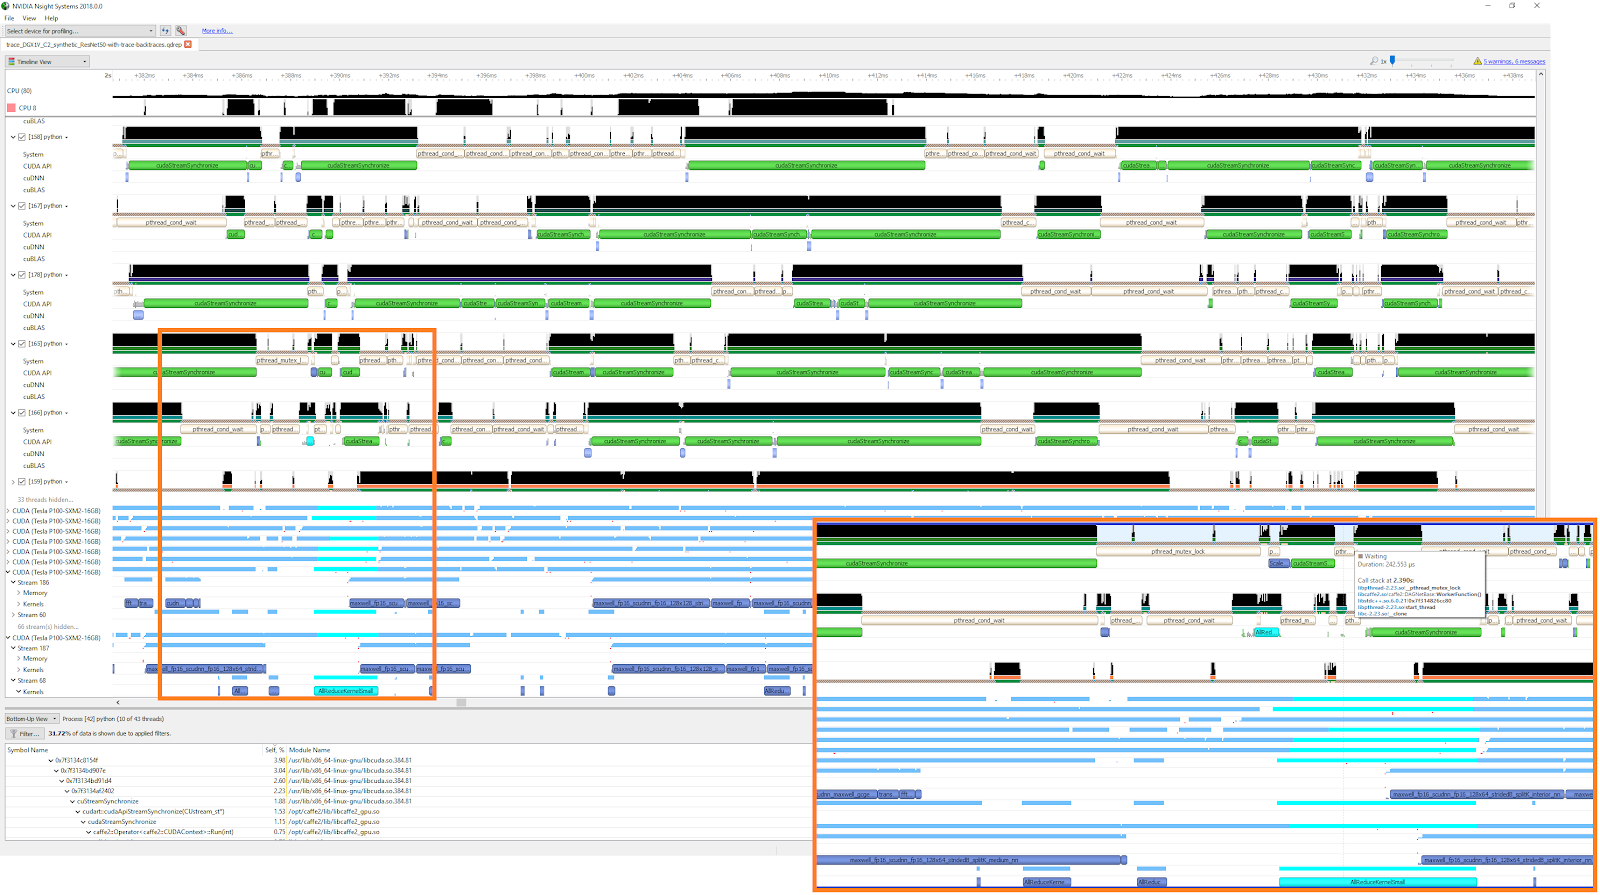
The NVIDIA Nsight Systems performance analysis tool can help determine whether chunks of work, called kernels, are executing on the GPU. Streams typically contain sequences of kernels that run one after the other. Each stream can be viewed on its own Nsight Systems timeline, which may reveal overlap between kernels in different streams. For example, in Figure 1, see the lines labeled “Stream 15” through “Stream 22.”

Alternatively, all streams may be shown on a single timeline, which gives an overall idea of how often the GPU is in use during the execution of the workload (Figure 1, line labeled “All Streams”).
What the standard Nsight Systems timeline does not show immediately is how many of the SMs of the GPU are busy at any one time. You can highlight a specific kernel in a popup view and examine its attributes, including the number of threads in each thread block, the size of the grid (total number of thread blocks belonging to the kernel), and even the theoretical occupancy (maximum number of thread blocks that can fit on one SM).
From these attributes, you can compute the number of SMs that are needed to execute the kernel. If that number is not an integral multiple of the total number of SMs on the GPU, any leftover SMs (the kernel’s “tail”) can be assigned to the thread blocks of one or more other kernels.
This concurrent execution of different kernels is enabled using multiple streams, the focus of this post. Getting an overview of how well a whole multi-stream workload uses the GPU on average would require piecing together the tails of concurrent kernels in the Nsight Systems timelines of all streams. Some special features of Nsight Systems may be exploited to make this otherwise non-trivial process quick and painless.
GPU metrics sampling to the rescue
When an Nsight Systems report has been obtained for a workload or a specific section thereof, data may be extracted from it explicitly in the form of a standard open-source SQLite database file. That SQLite file can also be obtained as a byproduct of the call to summarize statistics of the workload with the Linux command nsys stats. (This post focuses on the Linux operating system, but similar results can be obtained on Windows.)
With the introduction of Nsight Systems version 2021.2.4 in CUDA Toolkit 11.4, a special flag can be passed to the workload profiling command to help reach the desired goal:
nsys profile --gpu-metrics-device=N <other parameters>
In this flag, N is the sequence number of the GPU in a multi-GPU node that is being sampled. If you are using a single GPU, N equals 0.
When this flag is set, Nsight Systems records, with a default frequency of 10 KHz or a user-specified sample frequency, the percentage of all SMs in use (SM Active) during each sample period. This quantity can be viewed on its own timeline.
Figure 2 shows an example of a close-up, as well as an overview of an entire application, for SM Active. This gives more insight into how well the GPU is used, but it requires opening the Nsight Systems graphical user interface.


The analysis tool most suitable for this task is nsys stats, but without additional specification, this command emits just a summary of CPU and GPU activity, which is not sufficient.
However, the database query language Structured Query Language (SQL) enables the extraction of all that is needed from the SQLite file derived from the Nsight Systems report. SQLite files are logically structured as collections of tables, and any table column can be extracted using a simple SQL command. The column corresponding to the percentage of SMs in use is SM Active.
Formally, the quantity reported is an average of SM activity. 50% may mean that all SMs are active 50% of the time, or 50% of the SMs are active 100% of the time, or anything in between, but in practice, our earlier definition prevails.
If you aren’t familiar with SQL, make use of the DataService capability, which was introduced in Nsight Systems version 2023.4. It provides a convenient Python interface to query the SQLite database embedded in the collected report. The following script uses the DataService to extract the list of percentages of SM activity of a workload and derive several useful quantities.
import sys
import json
import pandas as pd
from nsys_recipe import data_service, log
from nsys_recipe.data_service import DataService

# To run this script, be sure to add the Nsight Systems package directory to your PYTHONPATH, similar to this:
# export PYTHONPATH=/opt/nvidia/nsight-systems/2023.4.1/target-linux-x64/python/packages

def compute_utilization(filename, freq=10000):
	service=DataService(filename)
	table_column_dict = {
    	"GPU_METRICS": ["typeId", "metricId", "value"],
    	"TARGET_INFO_GPU_METRICS": ["metricName", "metricId"],
    	"META_DATA_CAPTURE": ["name", "value"]
	}
	hints={"format":"sqlite"}
	df_dict = service.read_tables(table_column_dict, hints=hints)
	df = df_dict.get("GPU_METRICS", None)
	if df is None:
    	print(f"{filename} does not contain GPU metric data.")
    	return
	tgtinfo_df = df_dict.get("TARGET_INFO_GPU_METRICS", None)
	if tgtinfo_df is None:
    	print(f"{filename} does not contain TARGET_INFO_GPU_METRICS table.")
    	return
	metadata_df = df_dict.get("META_DATA_CAPTURE", None)
	if metadata_df is not None:
    	if "GPU_METRICS_OPTIONS:SAMPLING_FREQUENCY" in metadata_df['name'].values:
        	report_freq = metadata_df.loc[ metadata_df['name']=='GPU_METRICS_OPTIONS:SAMPLING_FREQUENCY']['value'].iat[0]
        	if isinstance(report_freq, (int,float)):
            	freq = report_freq
            	print("Setting GPU Metric sample frequency to value in report file. new frequency=",freq)

	possible_smactive=['SMs Active', 'SM Active', 'SM Active [Throughput %]']
	smactive_name_mask = tgtinfo_df['metricName'].isin(possible_smactive)
	smactive_row = tgtinfo_df[smactive_name_mask]
	smactive_name = smactive_row['metricName'].iat[0]
	smactive_id = tgtinfo_df.loc[tgtinfo_df['metricName']==smactive_name,'metricId'].iat[0]
	smactive_df = df.loc[ df['metricId'] == smactive_id ]

	usage = smactive_df['value'].sum()
	count = len(smactive_df['value'])
	count_nonzero = len(smactive_df.loc[smactive_df['value']!=0])
	avg_gross_util = usage/count
	avg_net_util = usage/count_nonzero
	effective_util = usage/freq/100

	print(f"Avg gross GPU utilization:\t%lf %%" % avg_gross_util)
	print(f"Avg net GPU utilization:\t%lf %%" % avg_net_util)
	print(f"Effective GPU utilization time:\t%lf s" % effective_util)
	return metadata_df

if __name__ == '__main__':
	if len(sys.argv)==2:
    	compute_utilization(sys.argv[1])
	elif len(sys.argv)==3:
    	compute_utilization(sys.argv[1], freq=float(sys.argv[2]))
Let the sum of all percentages be Sp and the number of samples Ns, then Sp/Ns equals the average percentage of all SMs in use during the entire workload. We call this the gross GPU utilization.
This may be exactly what you want, but often a workload contains some sections where no kernels are being launched at all, for example when data is being copied from the host CPU to the GPU. Excluding those sections by monitoring automatically whether the SM usage percentage at a sample point is greater than zero (let that number of samples be Nsnz) and computing Sp/Nsnz delivers the average percentage of SMs in use during measurable kernel executions. We call this the net GPU utilization.
Finally, it may be useful to compute for a certain workload or section thereof the effective amount of time that the GPU would have been fully in use had all samples been condensed. For example, if the samples show 40% SM utilization over a period of 5 seconds, then the effective GPU utilization time would be 0.4*5=2 seconds. This time can be compared to the duration of the Nsight Systems timeline where the relevant kernel executions take place. Let that duration be Dt and let the sum of effective GPU utilization times be Sdt, then Sdt/Dt indicates how well the SMs of the GPU are used in the windows of interest.
An example
The utility of these three quantities can be shown by the following scenarios, applied to a realistic workload (Figure 4).
Quantity Sp/Ns represents the average percentage of SMs in use throughout the entire workload, indicated by the open, black, double-headed arrow in Figure 4, including during the six periods surrounding the dense blue blocks of kernel executions when there is no SM activity. For this workload, that percentage is 70.
Quantity Sdt/DT*100 represents the average percentage of SMs in use during the GPU busy time, indicated by the solid, red, double-headed arrows in Figure 4. That includes short, embedded sections within the five busy windows when briefly no kernels are being executed (not visible at the scale of the figure representing the entire workload). For this workload, that percentage is 77.
Quantity Sp/Nsnz represents the average percentage of SMs in use whenever Nsight Systems determines that at least one SM is busy. This ignores any short, embedded periods of no SM activity within the five GPU busy periods. For this workload, that percentage is 79.
The future
New features are added to NVIDIA analysis tools continually. Consider the recent development of recipes, which enable convenient analysis of cluster-level applications, performance regression studies, and more.
NVIDIA is also paying increasing attention to providing access to Nsight System’s GPU performance details through the popular Python scripting language, which is expected to obviate the need for learning other languages like C or SQL. Other recent additions to Nsight Systems functionality include statistical and expert systems analysis.
Conclusion
Analysis of this example workload shows that there are some periods when the SMs are not used at all, but overall SM idle time is modest.
During SM busy windows, the GPU is decently saturated, especially considering the fact that grid and thread block sizes vary widely, with some grids comprising just a single thread block—these can only occupy a single SM. Consequently, the multiple streams that make up the workload function well to improve GPU utilization.
This insight was derived with minimal effort. The Python script used to determine the three utilization metrics mentioned in this post assumes that the sample frequency is either supplied explicitly by the user for input reports obtained by older versions of Nsight Systems, is allowed to take on the default value of 10 KHz for such versions, or can be extracted from the input report for newer versions of Nsight Systems.
A high percentage of SM utilization does not imply that the SMs are used efficiently. For myriad reasons, the kernels executing on the SMs may suffer significant or even extreme stalls. The only fact a high percentage of SM utilization conveys is that most of the GPU’s SMs are active most of the time, which is a prerequisite for good performance.
For more information, see the following resources:
- Download the CUDA Toolkit
- Get started with Nsight Systems
- Get started with Nsight Compute
- Dive deeper and ask questions in the CUDA developer forum
