As GPU performance steadily ramps up, your application may be overdue for a tune-up to keep pace. Developers have used independent CPU profilers and GPU profilers in search of bottlenecks and optimization opportunities across their disjointed datasets for years. Using these independent tools can result in picking small optimizations based on false positive indicators or missing large opportunities that fall into the gaps between the tools if you’re not careful. NVIDIA now offers its new Nsight Systems to address these problems, helping you see the bigger picture.
Introducing NVIDIA Nsight Systems
NVIDIA Nsight Systems provides developers with a more complete and unified view of how their applications utilize a computer’s CPUs and GPUs. These new performance analysis tools assist you in visualizing an application’s algorithms in order to identify the largest opportunities for optimizing and tuning algorithms. Using Nsight Systems can help you to scale your application more efficiently across varying levels of hardware, from small laptops to powerful multi-GPU servers such as DGX-2.
Nsight Systems allows you to identify issues such as GPU starvation, unnecessary GPU synchronization, insufficient CPU parallelization or pipelining, and unexpectedly expensive CPU or GPU algorithms. Nsight Systems utilizes low overhead tracing and sampling techniques to collect process and thread activity. It correlates that data across CPU cores and GPU streams. This correlation data will enable developers to investigate bottlenecks from the “scene of the crime” back to the circumstances that facilitated it.
GPU Starvation Investigations
NVIDIA designed Nsight Systems to make it easy to spot GPU starvation and work backward to understand the cause.
Figure 1 shows how you can track kernel coverage. The CUDA device row contains blue height graphs representing CUDA kernel coverage for a given segment of time, relative to the zoom level. The first red box shows the GPU having no work to execute, while the second red box shows very sparse coverage; only 5% of the GPU is occupied with work at the time most of those pixels represents. The CPU algorithms feeding the GPU should be investigated for optimization opportunities in these cases.
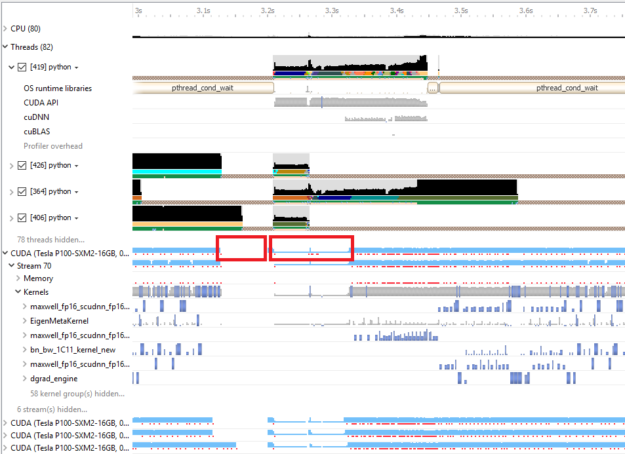
Nsight also allows the developer to investigate back in time by using our GPU correlation feature in order to spot the underlying CPU algorithm. The developer will find the correlated CPU-side CUDA API launch event by selecting the CUDA kernel on the GPU after the gap. Figure 2 shows the CPU thread (413) launching the kernel from GPU stream 70. Later examples will show how to learn more about investigating the CPU side of your algorithms.

Unnecessary GPU Synchronization Calls
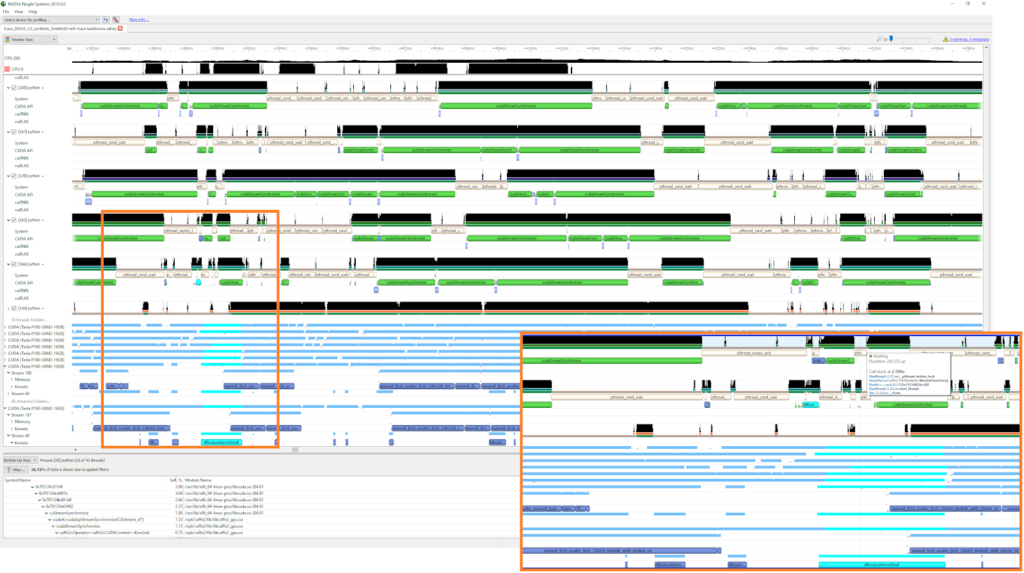
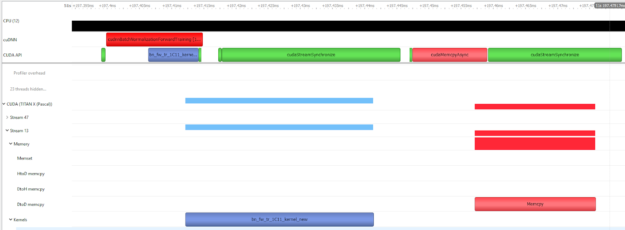
Similar to GPU starvation, low or empty GPU utilization areas can also reveal unnecessary GPU synchronization calls. You can see in figure 3 how the CPU asks the GPU to synchronize even though the CUDA stream already enforces ordering of execution. The user is paying a second time penalty by immediately invoking cudaStreamSynchronize after a cudaMemcpyAsync, ensuring that the CPU and GPU are in sync instead of skipping the first sync. Identifying these situations and removing unnecessary cuda*Synchronize functions, or switching to CUDA events frequently results in more tightly packaged GPU work.
API Trace
Understanding the CPU algorithms leading up a particular GPU event can be done with a combination of automation instrumentation and optional manual annotations. Several features in Nsight System offer assistance unavailable in previous GPU profilers. API trace has been shown in all of the images in this article. Libraries such as CUDA, cuDNN, cuBLAS, and OpenGL can all be traced to identify GPU API related issues.
Figure 4 below reveals OS runtime libraries trace and thread call-stack backtrace. These features can identify the context of resource management and thread synchronization issues which could prevent a thread from launching work in sufficient time to keep the GPU busy.

Sampling
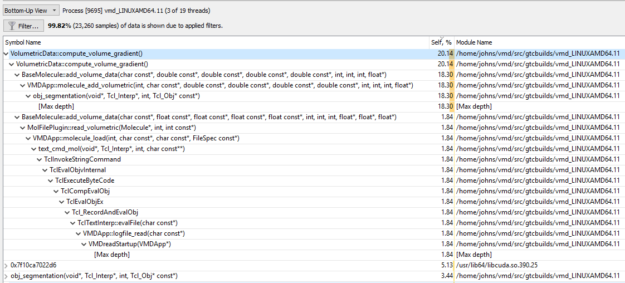
Thread call-stack information can also be collected via sampling and is presented relative to samples that fall into a selected range of time and filter properties. Figure 5 shows how thread call-stack information is viewed.
Annotated source code
NVIDIA’s Tools Extensions (NVTX) is a source code annotation library that developers can use to highlight their code so that it can appear in the timeline. The latest version of NVTX offers incredibly low overhead and only logs data when tools are profiling the application. The following picture is an example from VMD, a high-performance molecular visualization tool, marking its application phases and algorithms with NVTX.

3x Performance Increase in VMD
VMD developer John Stone presented how he achieved a greater than 3x performance increase in VMD at the 2018 GTC in San Jose, California. This presentation is full of other great examples, including optimizations also made to Lattice Microbes for spatial stochastic simulation.
Getting Started
NVIDIA Nsight Systems offer a robust set of profiling and analysis tools for developers using NVIDIA GPUs. NSight Systems enables analysis of CPU and GPU code, lets you investigate CPU-GPU interactions, and collect thread-call statistics. A straightforward GUI enables you to quickly visualize key elements. You can learn more about NVIDIA Nsight Systems, as well as download the tool, by visiting the product page.
