The latest update to NVIDIA Nsight Systems—a performance analysis tool—is now available for download. Designed to help you tune and scale software across CPUs and GPUs, this release introduces several improvements aimed to enhance the profiling experience.
Nsight Systems is part of the powerful debugging and profiling NVIDIA Nsight Tools Suite. You can start with Nsight Systems for an overall system view and avoid picking less efficient optimizations based on assumptions and false-positive indicators.
2021.5 highlights
- Statistics now available in user interface
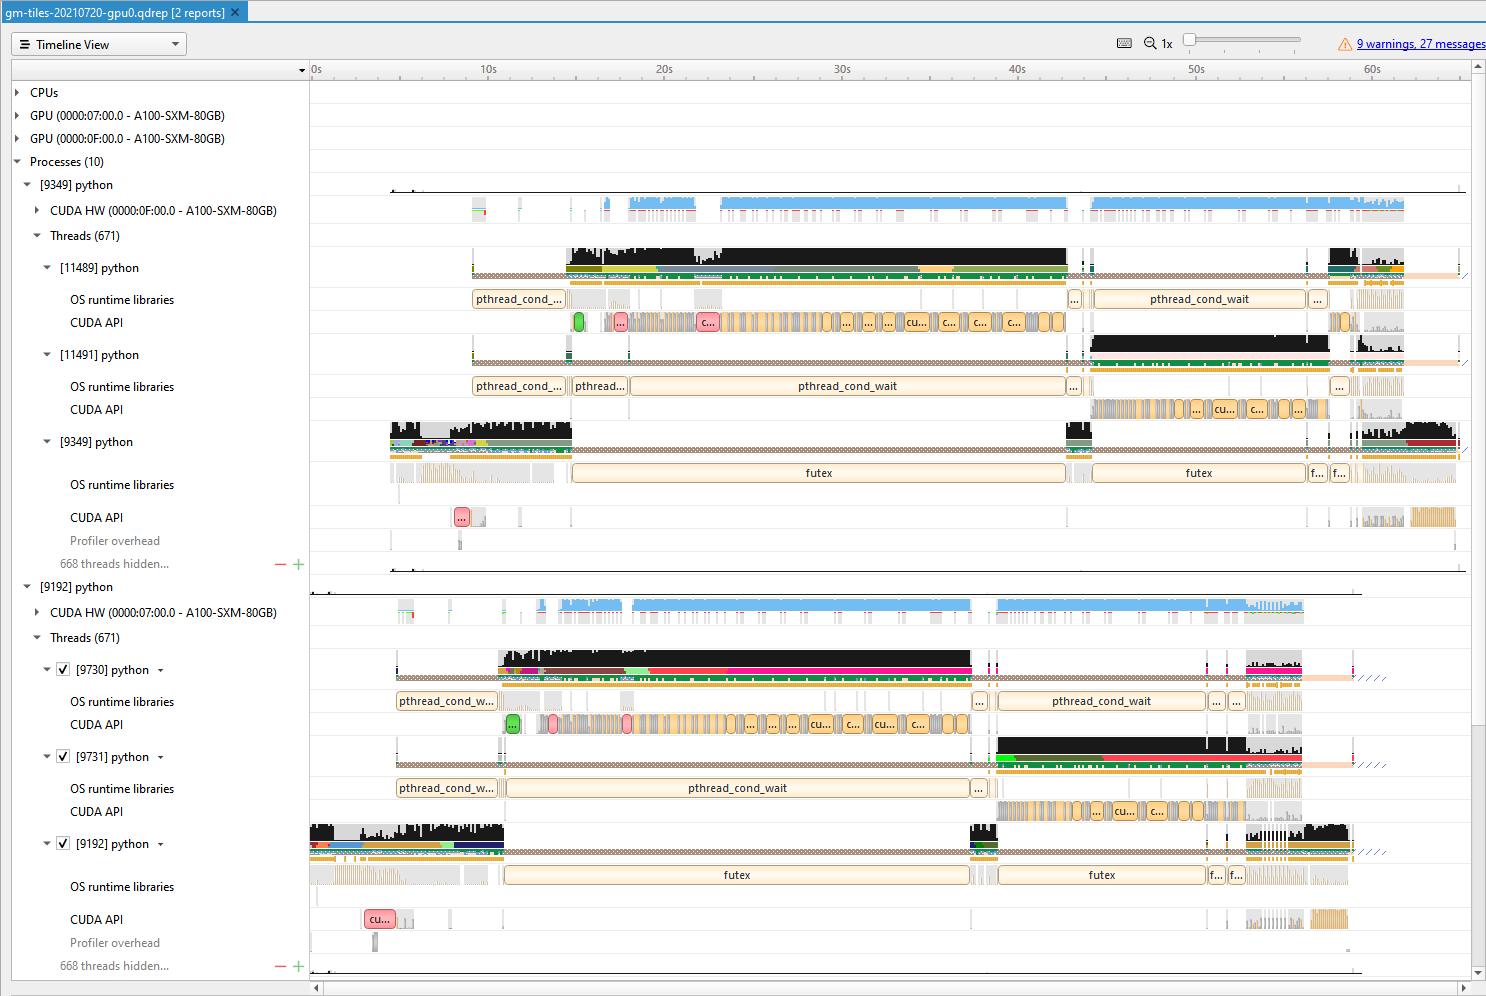
- Multi-report view with horizontal and vertical layouts to aid investigations across server nodes, VMs, containers, ranks, and processes (coming soon)
- Expert system now includes GPU utilization analysis for OpenGL and DX12
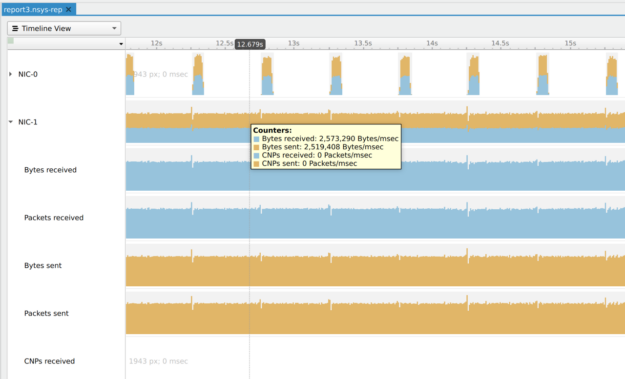
- NVIDIA NIC Infiniband metrics sampling (experimental)
- DirectX12 memory operations and warnings
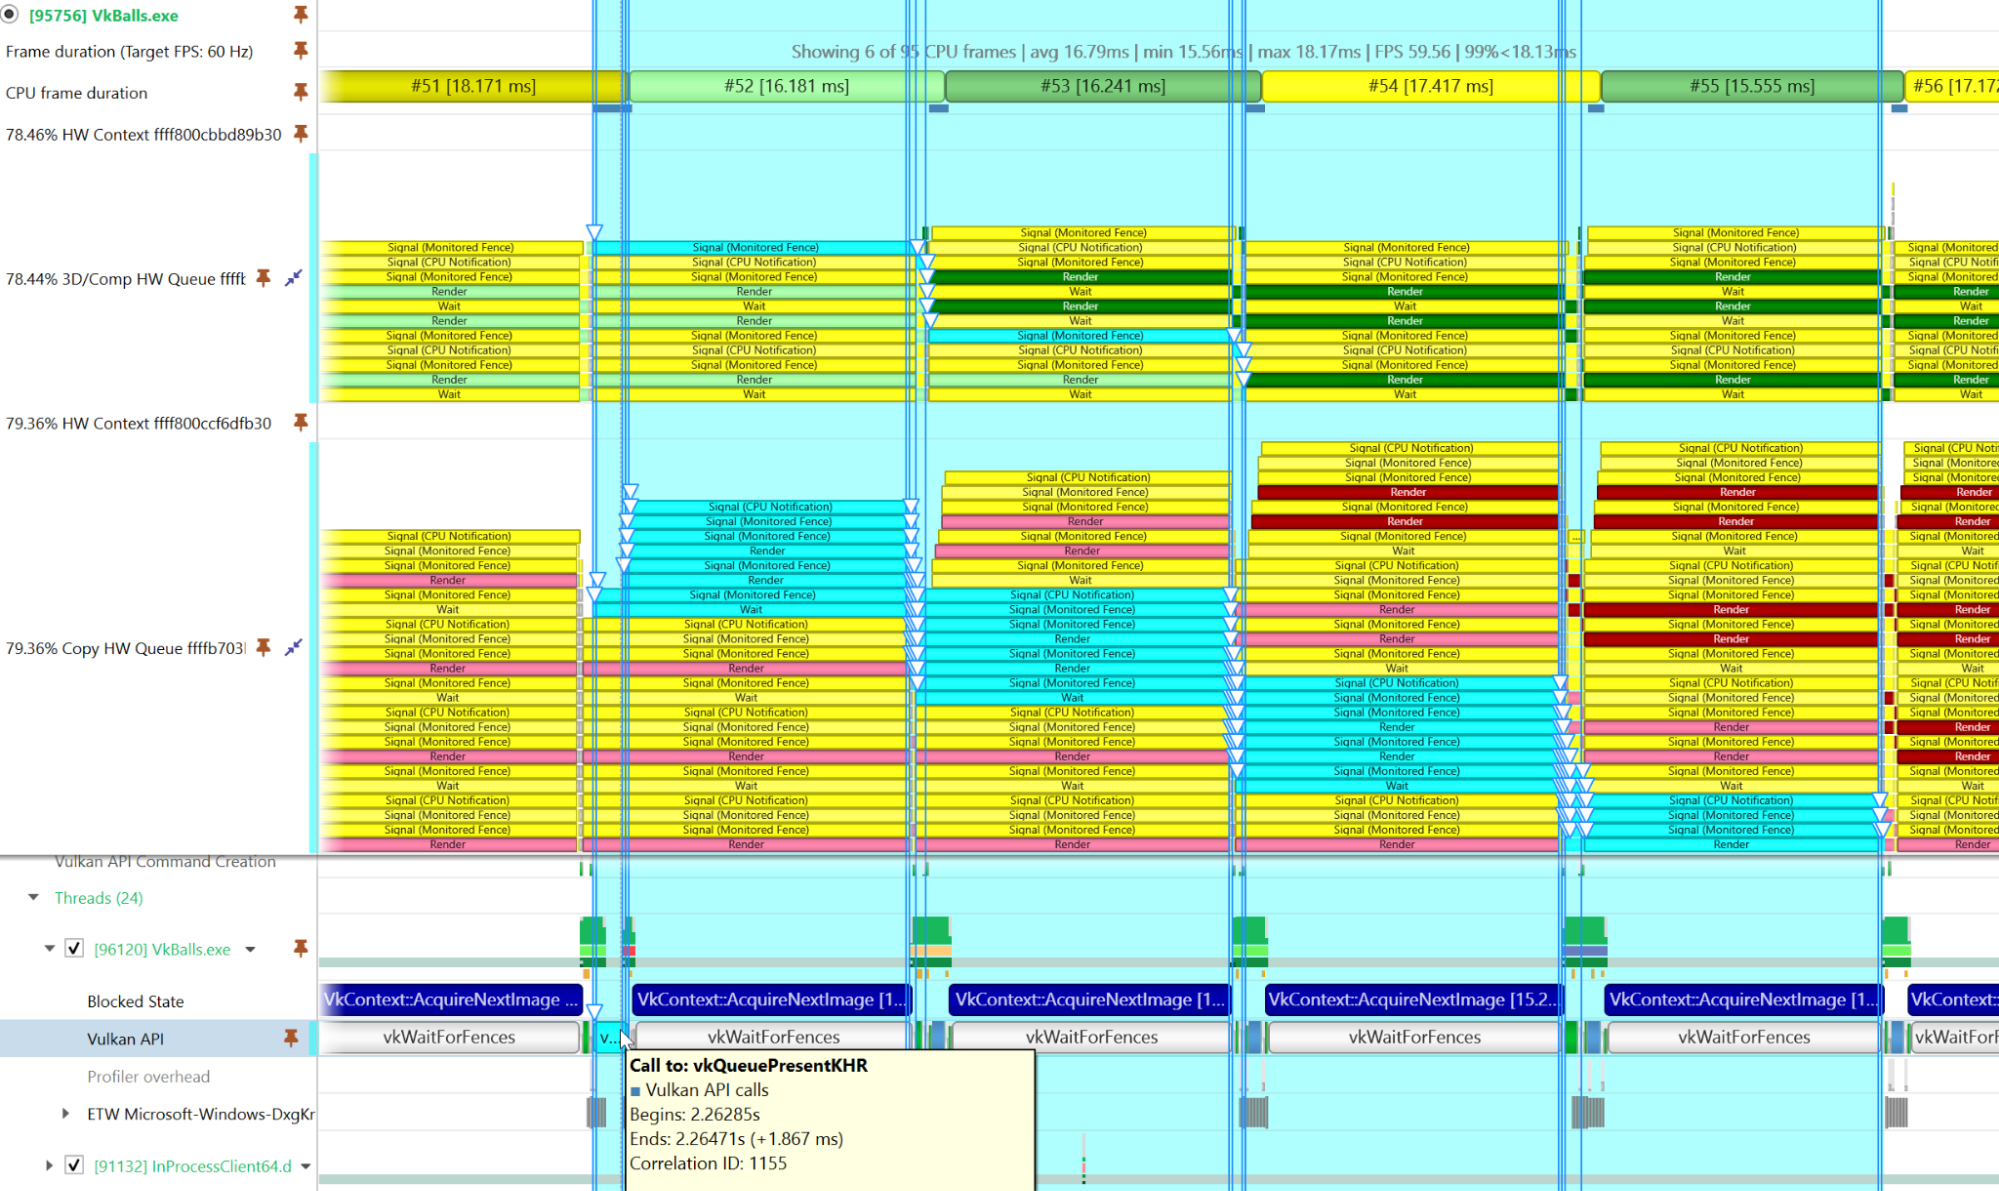
- DXGI/DX12/Vulkan API calls correlation to WDDM queue packets
- Windows 11 support
Multireport view enhancements (coming soon) can improve investigations. They support merging into a single timeline reports that are continuations of existing sessions or reports captured simultaneously from other server nodes, VMs, container, rank, and process.
NVIDIA NIC Infiniband metrics sampling (experimental) enables you to understand details of server communications, such as throughput, packet counts, and congestion notifications.
Using DirectX12 trace, a new memory operations row highlights memory usage warnings and situations where expensive functions are called when resources are non-persistently mapped.
WDDM trace now correlated graphics API calls to queue packets so that you can better understand workload creation and its progress through the Windows display driver model.
For more information, see the following resources:
- Optimizing DX12 Resource Uploads to the GPU Using CPU-Visible VRAM
- If you are an Nvprof or NVIDIA Visual Profiler user:
- For future release highlights and feature spotlights, subscribe to the NVIDIA Developer YouTube channel
- To download the latest release of Nsight Systems, see the Nsight Systems product page
- Ask questions or give feedback in the forums

