
As ray tracing becomes the predominant rendering technique in modern game engines, a single GPU RayGen shader can now perform most of the light simulation of a frame. To manage this level of complexity, it becomes necessary to observe a decomposition of shader performance at the HLSL or GLSL source-code level. As a result, shader profilers are now a must-have tool for optimizing ray tracing.
In this post, I’ll show you how to use the NVIDIA Nsight Graphics GPU Trace Profiler to analyze low-level shader performance, and why it’s important to enable the DirectX Compiler (DXC) debugging information option (-Zi) during shader compilation. Throughout the post, I’ll use:
- The DirectX 12 demo app from the NVIDIA RTX Path Tracing SDK v1.2.0, with default settings, in full-screen mode, 1080 pixels.
- The public Windows build of NVIDIA Nsight Graphics (2023.4).
- A GeForce RTX 4080 with driver version 546.33.
GPU Trace without shader debugging information
The Path Tracing SDK sample compiles all of its shaders with embedded shader debugging information (-Zi) as a DXC command-line option within the CMake file. To simulate what would happen without using -Zi, I removed -Zi in the CMake file and did a rebuild in the Visual Studio solution.
I also generated a GPU Trace from the modified Path Tracing SDK demo app, with the default settings (the Real-Time Shader Profiler enabled and locked GPU clocks). Figure 1 shows how this looks in the tool with the PathTrace marker selected.
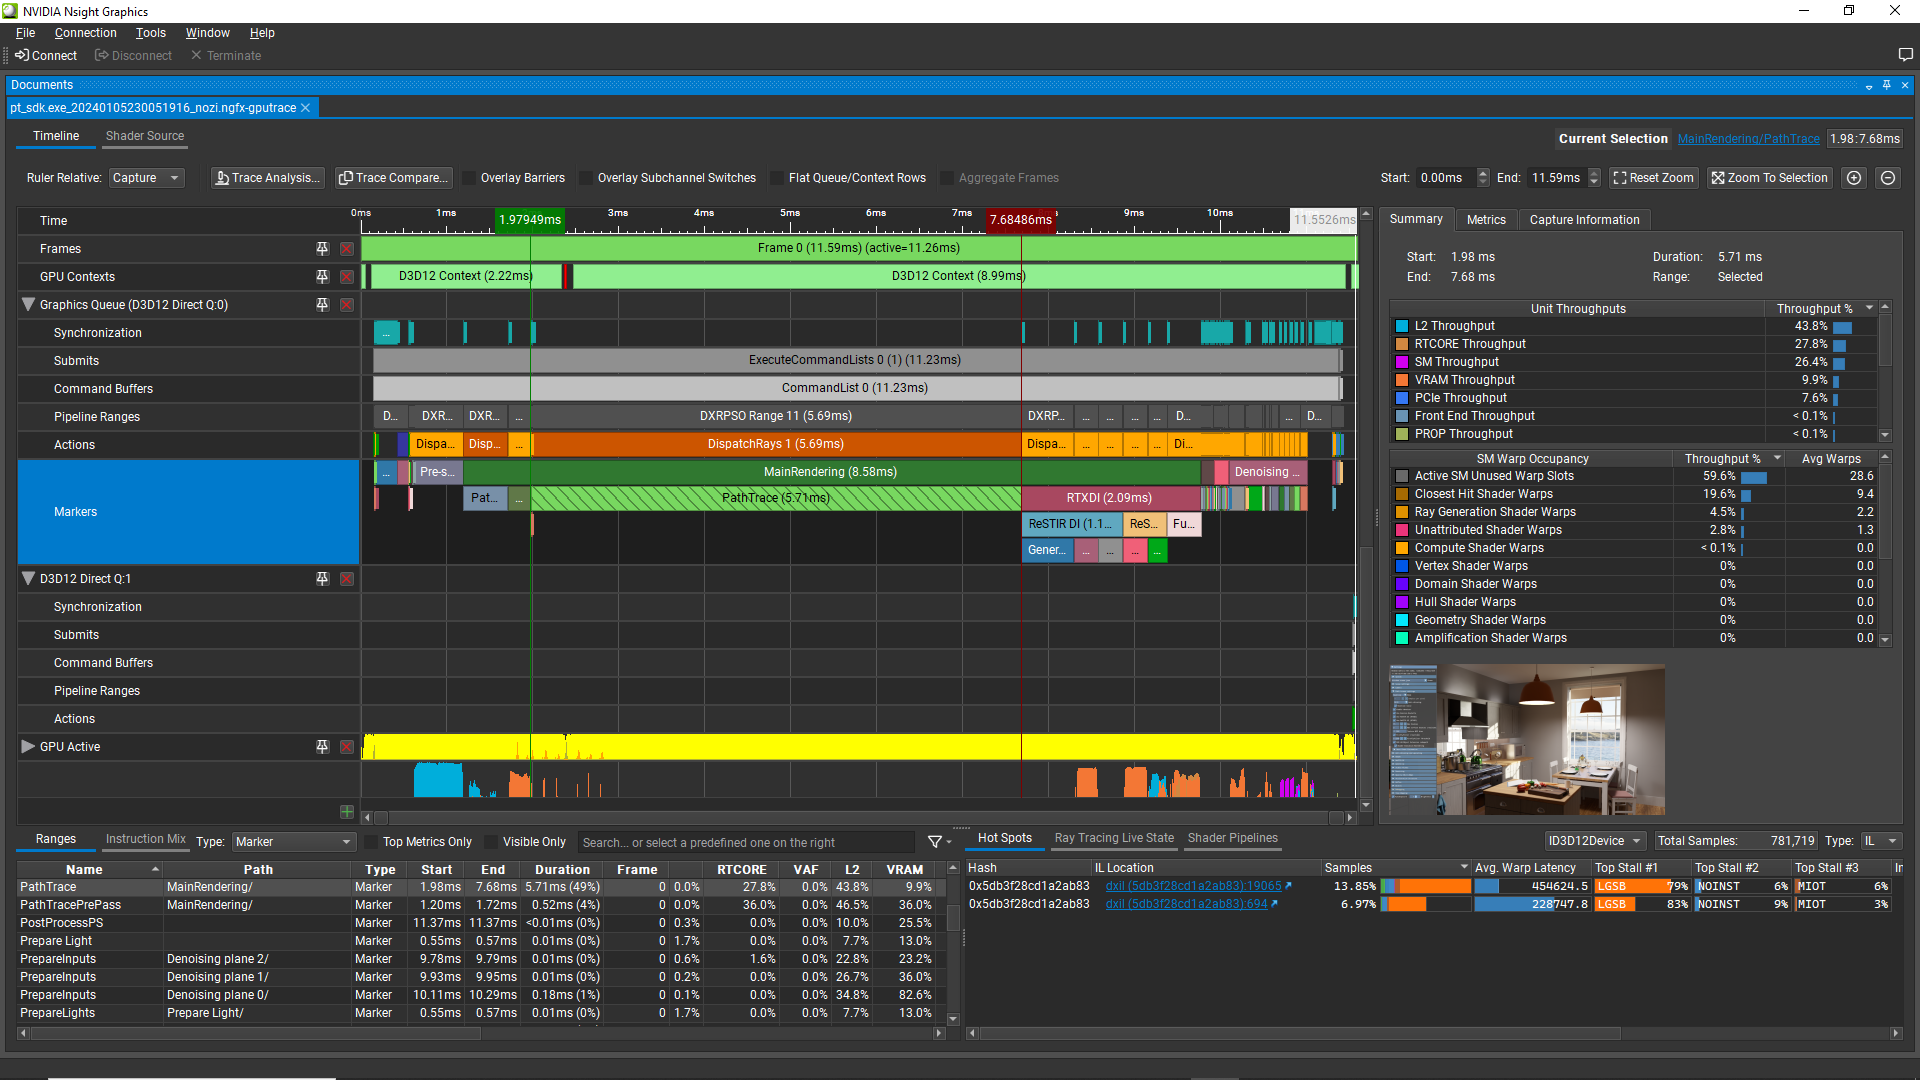
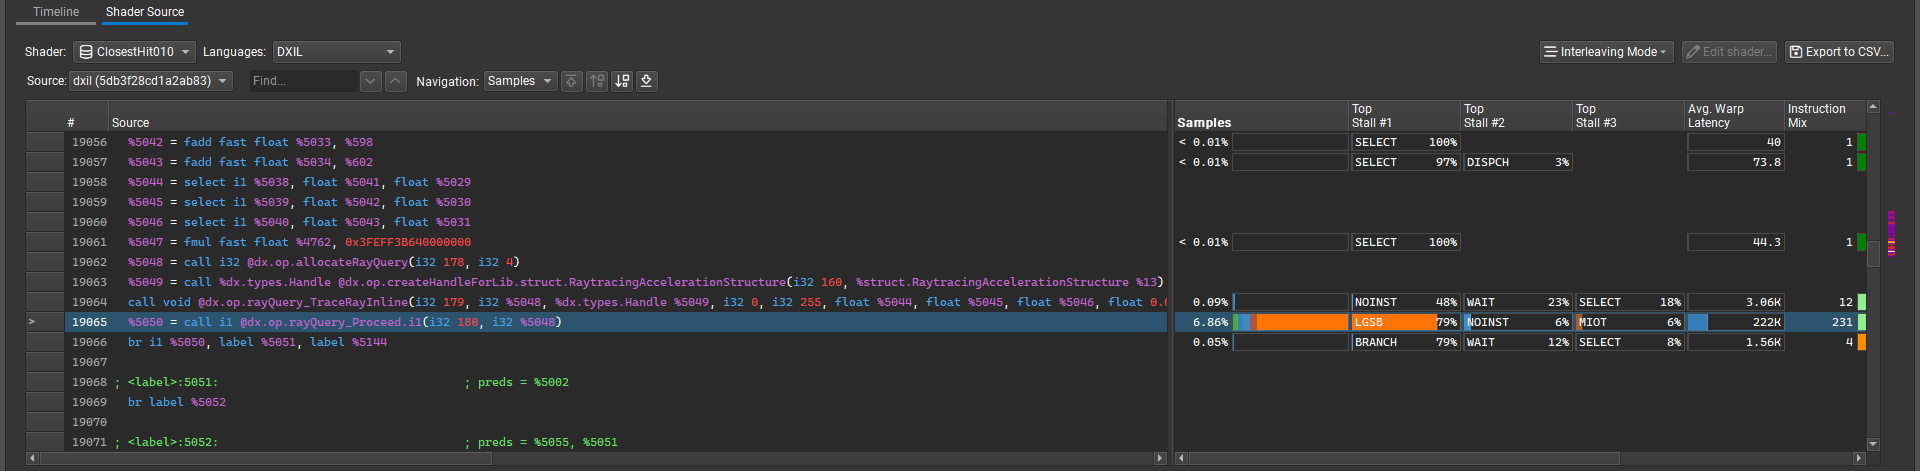
The hot spots don’t show any HLSL, but only DXIL links. Clicking the DXIL link for the top hot spot, the tool jumps to a line of DXIL and shows Sample% and Stall reason%s for that line. It’s challenging to know what line of HLSL this line maps to (Figure 2).
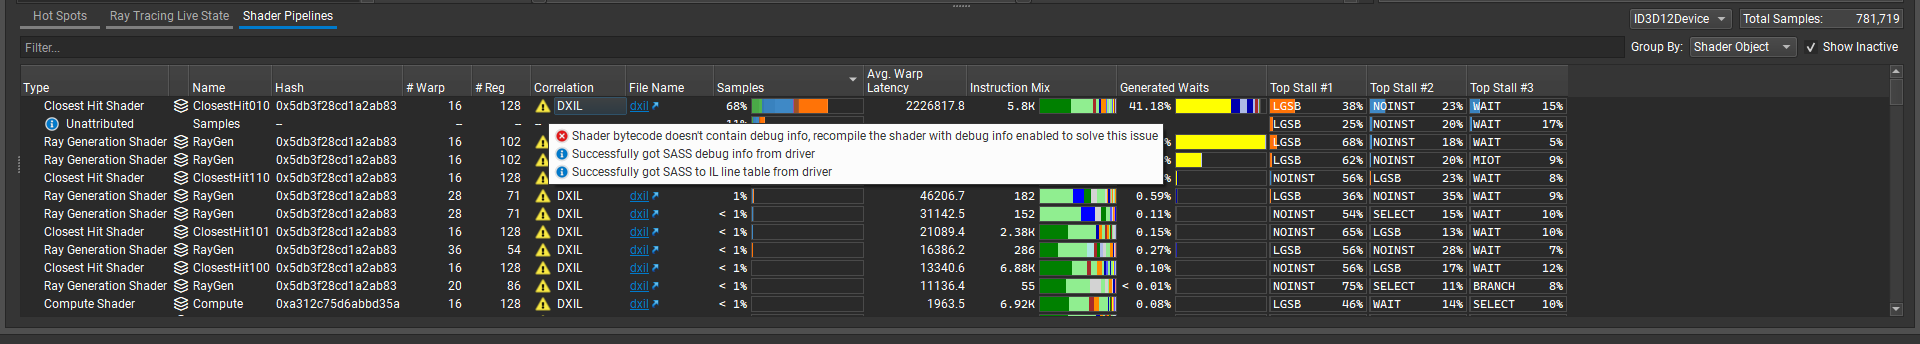
Looking at the Shader Pipelines tab in the bottom panel (Figure 3), notice that the Correlation column contains the warning, “Shader bytecode doesn’t contain debug info, recompile the shader with debug info enabled to solve the issue.”
The GPU Trace Profiler gathers its shader profiling data at the SASS level, which is the low-level instruction set that executes on the GPU. It can always correlate the SASS-level profiling data to the DXIL (or SPIR-V) intermediate language.
However, for the GPU Trace Profiler to correlate the profiling data to the high-level language (HLSL or GLSL), the DXIL must contain shader debugging information. Specifically, it must contain HLSL source code and line tables that correlate HLSL lines to DXIL lines. See the Shader Compilation section of the NVIDIA Nsight Graphics User Guide for how to enable shader debugging information depending on how the HLSL is compiled.
During development, I recommend embedding the shader debugging information into the DXIL blobs. In other words, use -Zi -Qembed_debug instead of shader PDBs, so that your GPU Trace files are standalone. For details, see microsoft/DirectXShaderCompiler on GitHub.
With this approach, you don’t need to manually keep track of which shader PDBs go with which trace. If embedding the shader debugging information makes the DXIL blobs too large or causes issues, you can also configure DXC to write the shader debugging information as separate shader PDBs files into a folder using the -Zi and -Fd DXC options. In this case, you’ll need to configure the search path for Separate Shader Debug Info in the Nsight Graphics Options before loading the GPU Trace file.
GPU Trace with shader debugging information
Figure 4 shows the Shader Pipelines section after rebuilding the visual studio solution of the demo app with the original DXC command line arguments, -Zi -Qembed_debug, for the ray-tracing shaders, and having captured a new trace with the GPU Trace Profiler.
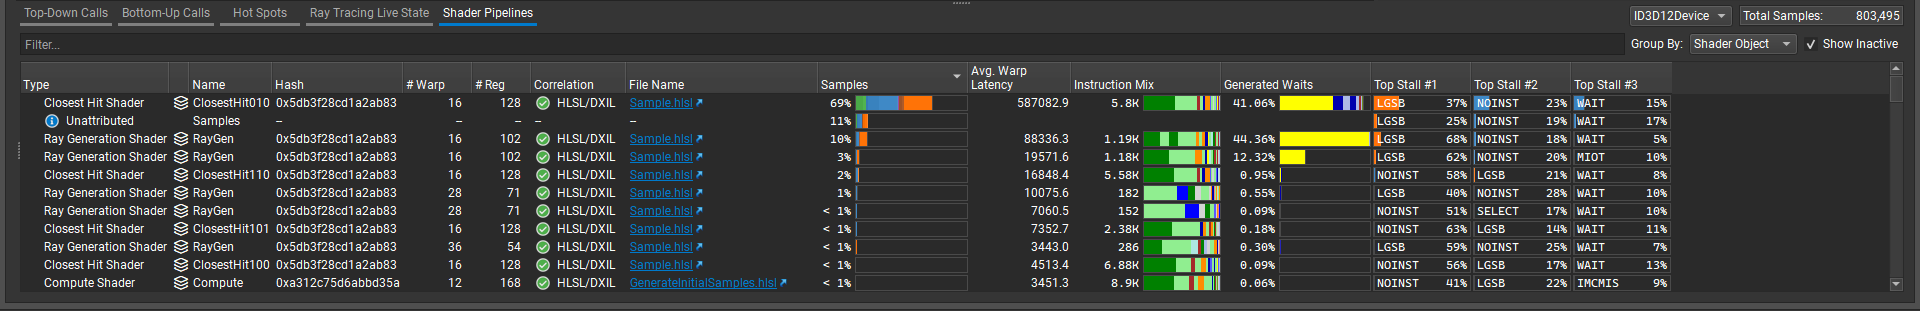
-Zi in the Shader Pipelines section By clicking on the Bottom-Up Calls tab, you can now easily see HLSL functions that are expensive, what type of GPU work they do, and what is limiting them at a high level (Figure 5). Note that the Bottom-Up Calls tab is absent when no debugging symbols are loaded, along with the Top-Down Calls tab.
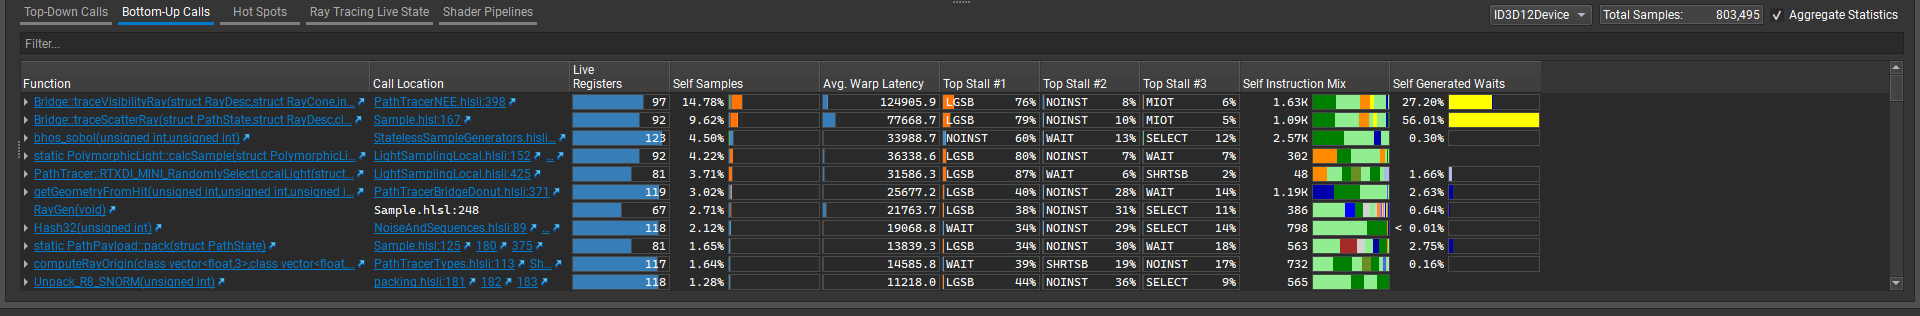
In this example, the third HLSL function in the Bottom-Up Calls section is a random number generator, bhos_sobol, taking 4.5% of the PathTrace marker, and with top issue stall NOINST (waiting on an instruction cache miss, typically) for 60% of the HLSL function.
In Figure 6, the HLSL view shows that the body of the unrolled loop is where all of the latency is produced, and the top SM issue stall reason is NOINST. This can be explained by the presence of an unrolled loop with many iterations, which produces many hardware instructions and puts pressure on the instruction caches of the GPU.
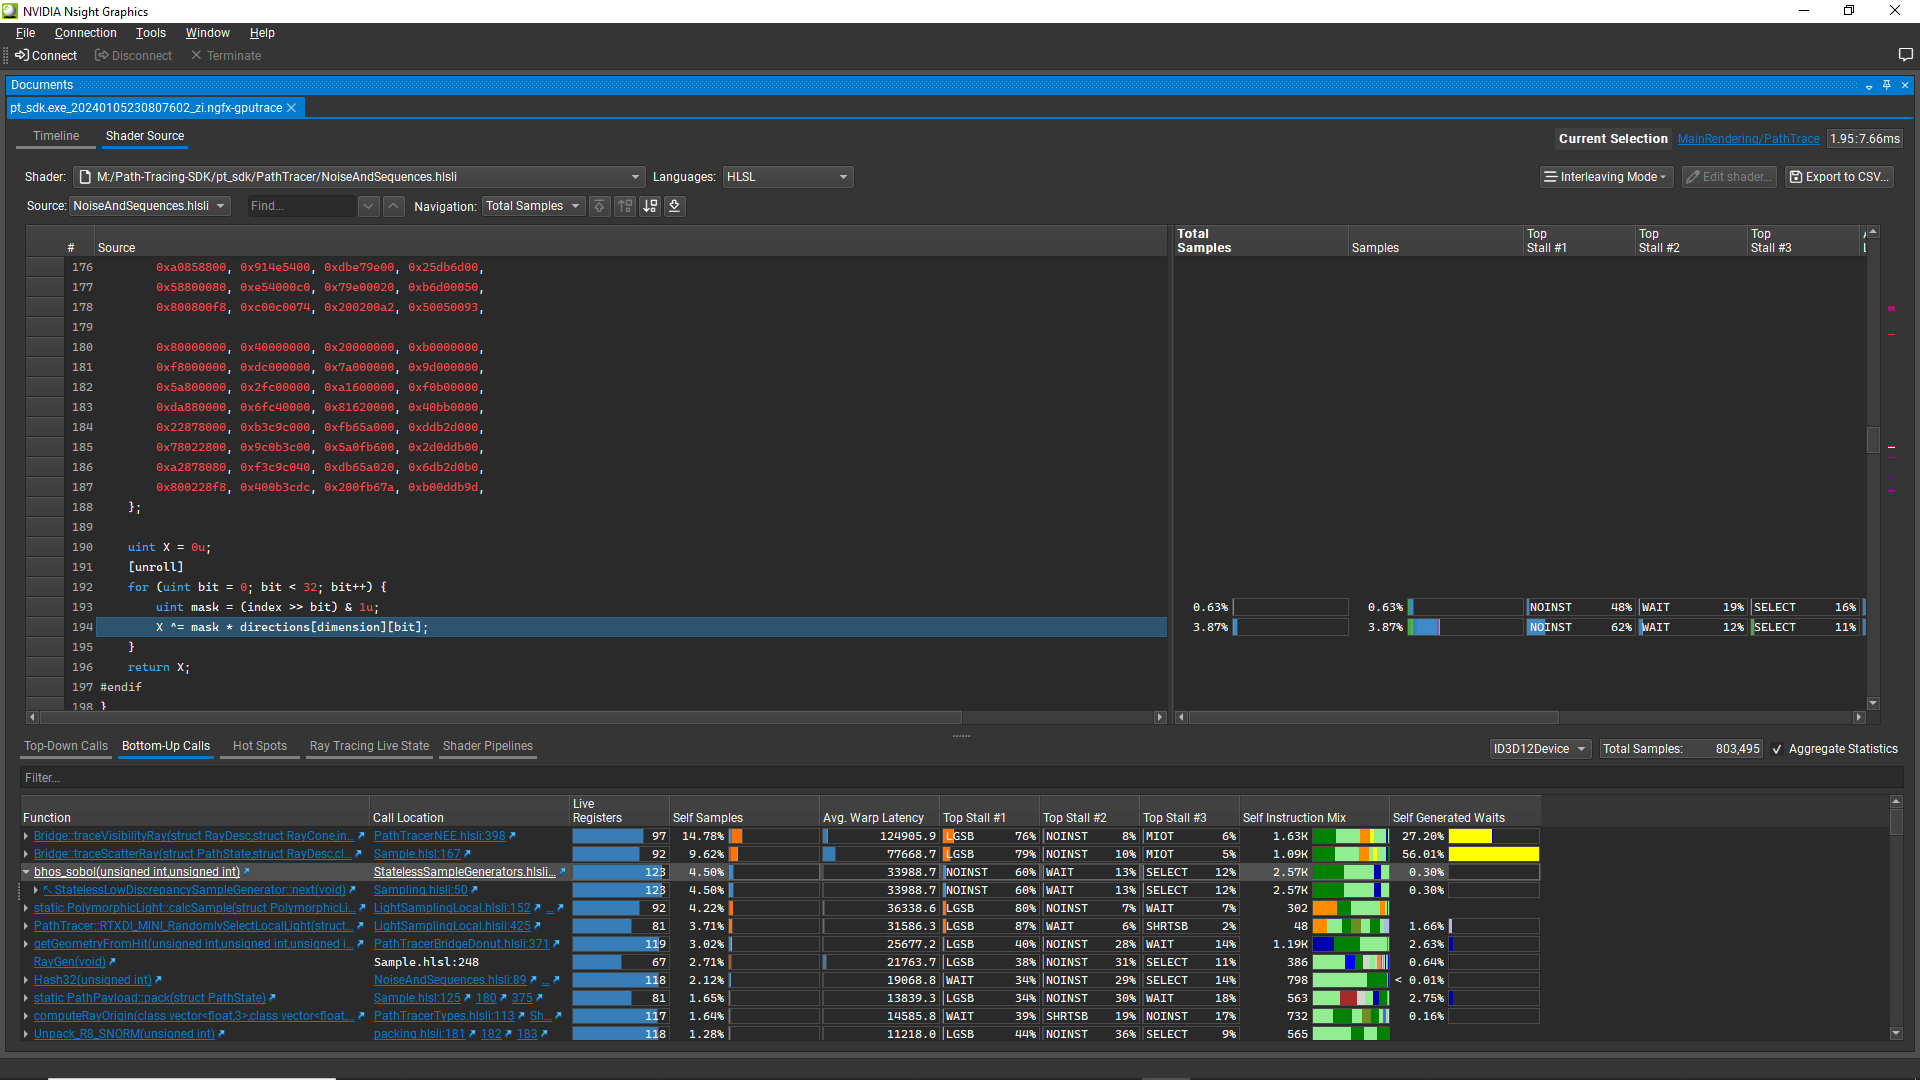
bhos_sobol functionAs the instruction cache is limited, one possible optimization strategy for this function is to precompute its output values in a structured buffer. SDK release v1.2.0 already supports this path, although it is not enabled by default.
// In Config.h
#define  USE_PRECOMPUTED_SOBOL_BUFFER       1               // see NoiseAndSequences.hlsli - still experimental, faster but lower quality and more RAM - not a clear win

// In NoiseAndSequences.hlsli
uint bhos_sobol(uint index, uniform uint dimension)
{
    return SOBOL_PRECOMPUTED_BUFFER[ (index % SOBOL_PRECOMPUTED_INDEX_COUNT) + SOBOL_PRECOMPUTED_INDEX_COUNT * dimension ];
}
Conclusion
When using the Real-Time Shader Profiler in NVIDIA Nsight Graphics GPU Trace, I recommend verifying that all of your shaders have HLSL Correlation enabled in the Shader Pipelines section of the bottom-right panel. If you see shaders with significant Samples% missing HLSL correlation, first recompile these shaders with debugging information enabled, as documented in the NVIDIA Nsight Graphics User Guide. Then capture a new GPU Trace.
To continue trying to use the shader profiler data without HLSL correlation would be a waste of time, compared to re-running with HLSL correlation enabled. HLSL Debug Data is also important for features like the Nsight Graphics Shader Debugger, enabling you to properly debug your shader code, as well as for NVIDIA Nsight Aftermath.
Acknowledgments
For their contributions to this post, I’d like to thank Aurelio Reis, Avinash Baliga, Axel Mamode, Robert Jensen, Iain Cantlay, Filip Strugar, Ivan Fedorov, and Juha Sjoholm.
