
Debugging code is a crucial aspect of software development but can be both challenging and time-consuming. Parallel programming with thousands of threads can introduce new dimensions to the already complex debugging process.
There are various tools and techniques available to developers to help make debugging simpler and more efficient. This post looks at one such suite of debugging tools: NVIDIA Compute Sanitizer. We explore the features and walk you through examples that show its use, so that you can save time and effort in the debugging process while improving the reliability and performance of your CUDA applications.
Compute Sanitizer is bundled in the CUDA Toolkit. For more information about using Computer Sanitizer to catch bugs related to uninitialized device arrays and synchronization, see Efficient CUDA Debugging: Memory Initialization and Thread Synchronization with NVIDIA Compute Sanitizer.
What is Compute Sanitizer?
Compute Sanitizer is a suite of tools that can perform different types of checks on the functional correctness of your code. A key debugging challenge is finding the bug’s root cause. Resolving it is usually easier than tracking it down. This is especially true in parallel execution environments where the source of a bug can be transient.
Compute Sanitizer excels at root-cause debugging by checking your code for memory access violations, race conditions, access to uninitialized variables, and synchronization errors. All these could manifest as bugs but with behavior that would not necessarily lead directly to the root cause in the source code.
You may already be familiar with one tool for debugging: cuda-memcheck. This tool was deprecated in CUDA 11.6 and has been removed in CUDA 12.0 and later. Compute Sanitizer takes its place, with additional capabilities such as improved performance and support for Microsoft hardware-accelerated GPU scheduling, as well as much broader support for features beyond memory checking.
There are four main tools in Compute Sanitizer:
memcheck: Memory access error and leak detectionracecheck: Shared memory data access hazard detection toolinitcheck: Uninitialized device global memory access detection toolsynccheck: Thread synchronization hazard detection
As well as these tools, Compute Sanitizer has some additional capabilities:
- An API to enable the creation of sanitizing and tracing tools that target CUDA applications.
- Integration with NVIDIA Tools Extension (NVTX)
- Coredump support for use with CUDA-GDB
- Suppression features for managing the output of the tool
Getting started with Compute Sanitizer
Compute Sanitizer is available for free as part of the CUDA Toolkit. For more information and a link to download the toolkit, see NVIDIA Compute Sanitizer.
When you have the toolkit installed, launch Compute Sanitizer from the command line, using the following format:
$ compute-sanitizer [options] app_name [app_options]
Table 1 shows a selection of the Compute Sanitizer options. For more information, see Command-Line Options in the Compute Sanitizer User Manual.
| Option | Description |
--kernel-regex kns=myKernelSubstring | Controls which kernels are checked by Compute Sanitizer tools. Useful for large, complex code to manage testing and tool output. |
–-launch-skip N | Skips N kernel launches before beginning checking. |
–-log-file filename | Sets a file that Compute Sanitizer writes to. Normally, Compute Sanitizer writes directly to stdout. |
--generate-coredump yes | Creates a CUDA coredump when an error is detected, which can be loaded up later into the CUDA debugger cuda-gdb for further analysis. |
Compiling for Compute Sanitizer
Compute Sanitizer can successfully analyze and check GPU applications without any special compilation flags. However, the output of the tools can be made more useful by including some extra flags at the compilation stage of your code, such as -lineinfo to generate line number information without impacting your code on an optimization level. Then Compute Sanitizer can attribute errors to lines of source code.
Compute Sanitizer memory checking
Perhaps the most used tool in Compute Sanitizer is the memory checker. The following code example shows a simple CUDA program for multiplying each element of an array by a scalar. This code executes to completion without complaint, but can you see anything wrong with it?
#include <assert.h>
#include <stdio.h>

#define N 1023

__global__ void scaleArray(float* array, float value) {
  int threadGlobalID    = threadIdx.x + blockIdx.x * blockDim.x;
  array[threadGlobalID] = array[threadGlobalID]*value;
  return;
}

int main() {
  float* array;
  cudaMallocManaged(&array, N*sizeof(float)); // Allocate, visible to both CPU and GPU
  for (int i=0; i<N; i++) array[i] = 1.0f;    // Initialize array

  printf("Before: Array 0, 1 .. N-1: %f %f %f\n", array[0], array[1], array[N-1]);
  scaleArray<<<4, 256>>>(array, 3.0);
  cudaDeviceSynchronize();

  printf("After : Array 0, 1 .. N-1: %f %f %f\n", array[0], array[1], array[N-1]);
  assert(array[N/2] == 3.0); // Check it's worked
  exit(0);
}
Ten points if you spotted the out-of-bounds array access:
- The execution configuration
<<<4, 256>>>launches 4 blocks with 256 threads in each, so 1,024 threads in total. - The array has length N=1023, indexed 0, 1 …, N-2=1021, N-1=1022.
- At some point, the 1024th thread, which has a
threadGlobalIDvalue of1023 = threadIdx.x + blockIdx.x * blockDim.x = 255+3*256, attempts to execute the code. - An out-of-bounds array access is attempted as
array[1023].
This leads to a pesky bug: “undefined behavior.” It may well fail silently. In a larger program, it could cause severe correctness issues impacting other memory allocations or may even cause segmentation faults.
Try compiling and running the code:
$ nvcc -lineinfo example1.cu -o example1.exe
$ ./example1.exe
Before: Array 0, 1 .. N-1: 1.000000 1.000000 1.000000
After : Array 0, 1 .. N-1: 3.000000 3.000000 3.000000
Bring in Compute Sanitizer to assist. Try running the following command and you should see a similar output:
$ compute-sanitizer --tool memcheck ./example1.exe

========= COMPUTE-SANITIZER
Before: Array 0, 1 .. N-1: 1.000000 1.000000 1.000000
========= Invalid __global__ read of size 4 bytes
=========     at 0x70 in /home/pgraham/devblog/NCS/example1.cu:8:scaleArray(float *, float)
=========     by thread (255,0,0) in block (3,0,0)
=========     Address 0x7f3aae000ffc is out of bounds
=========     and is 1 bytes after the nearest allocation at 0x7f3aae000000 of size 4092 bytes
...
For more information about how to interpret this output, see Understanding Memcheck Errors but we can discuss some of the key features. First, you get the error info Invalid __global__ read because the GPU is trying to read some global memory that is not a legitimate address. Then, you get the file and line number and the actual thread and block that caused this. In this case, example1.cu:8 maps to the line array[threadGlobalID] = array[threadGlobalID]*value; in the source.
Now you can fix the code. There are various options to do this but adding if threadGlobalID<N before the erroneous line is probably easiest. Recompile and run the memcheck tool again to confirm.
Now, did you spot anything else wrong?
20 points if you spotted the lack of cudaFree for the MallocManaged array at the end of the code. Again, the code runs to completion. You appear to get the right answer, but in not freeing allocated memory, you’ve introduced a leak! This could reduce the amount of memory available to subsequent applications or even lead to system instability.
The vanilla run of memcheck missed this. How can you check for these errors? One of the additional options for the memcheck tool can help you here: --leak-check=full.
$ compute-sanitizer --tool memcheck --leak-check=full ./example1.exe

========= COMPUTE-SANITIZER
Before: Array 0, 1 .. N-1: 1.000000 1.000000 1.000000
After : Array 0, 1 .. N-1: 3.000000 3.000000 3.000000
========= Leaked 4092 bytes at 0x7ff652000000
=========     Saved host backtrace up to driver entry point at allocation time
=========     Host Frame: [0x2b7e93]
=========                in /usr/lib/x86_64-linux-gnu/libcuda.so.1
=========     Host Frame:__cudart585 [0x439a0]
=========                in /home/pgraham/devblog/NCS/./example1.exe
=========     Host Frame:__cudart836 [0x10c76]
=========                in /home/pgraham/devblog/NCS/./example1.exe
=========     Host Frame:cudaMallocManaged [0x51483]
=========                in /home/pgraham/devblog/NCS/./example1.exe
=========     Host Frame:cudaError cudaMallocManaged<float>(float**, unsigned long, unsigned int) [0xb066]
=========                in /home/pgraham/devblog/NCS/./example1.exe
=========     Host Frame:main [0xac2e]
=========                in /home/pgraham/devblog/NCS/./example1.exe
=========     Host Frame:__libc_start_main [0x24083]
=========                in /usr/lib/x86_64-linux-gnu/libc.so.6
=========     Host Frame:_start [0xab0e]
=========                in /home/pgraham/devblog/NCS/./example1.exe
=========
========= LEAK SUMMARY: 4092 bytes leaked in 1 allocations
========= ERROR SUMMARY: 1 error
You should see output like that shown in the code example. cudaError is highlighted, which shows that your call to cudaMallocManaged created the memory that leaked. The allocated memory was not freed before the code exited. Adding cudaFree(array); at the end just before exit(0); fixes that. Do that, recompile, execute, and check that you (and the memcheck tool) are now happy with your code.
This is a simple program to scale an array on the GPU, used to show how Compute Sanitizer and memcheck work. When accessing arrays in CUDA, use a grid-stride loop to write code for arbitrarily sized arrays. For more information about error-checking code around calls to the CUDA API, see How to Query Device Properties and Handle Errors in CUDA C/C++.
What is a data race?
Data races are an issue particular to parallel programming approaches. They occur when multiple threads access shared data concurrently, and at least one of the accesses is a write operation. Figure 1 shows a simple example.
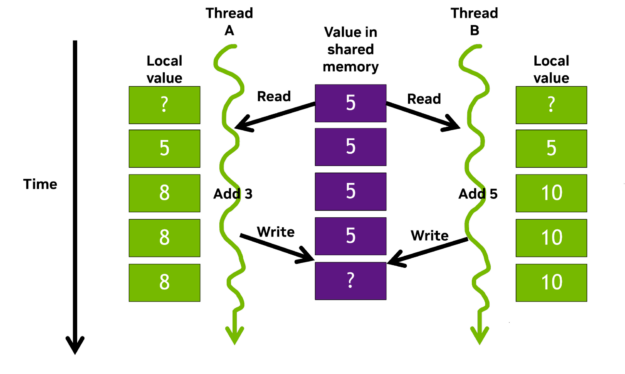
Storage declared with the __shared__ qualifier is placed in on-chip shared memory. All threads within the same thread block can access this per-block shared memory, at much faster speeds compared to global memory access. Shared memory is frequently used for inter-thread communication and as a temporary buffer to hold data being processed.
Consider Thread A and Thread B working in parallel and contributing their local tally to a shared counter. The threads add their own local value to the shared value and write their sum back to shared memory simultaneously. As A and B are now writing different values to the same address, a data race occurs and the result is suddenly incorrect, potentially even undefined.
There are mechanisms to avoid this situation. For example, locks and atomic operations help ensure correct behavior by protecting updates to shared values. However, we are all fallible. In complex code with thousands of threads, it may be ambiguous whether there is even an issue. The shared value may well still increase, just not in the manner data values would suggest, yielding what appears to be a successful run with incorrect values.
This is where the Compute Sanitizer racecheck feature is so valuable. This tool is a race condition detection feature that helps you identify and resolve data races in your CUDA code.
The following code example shows the GPU kernel used to demonstrate racecheck:
#include <assert.h>
#include <stdio.h>

#define N 1024

__global__ void blockReduceArray(int* array, int* sum) {
  int threadGlobalID = threadIdx.x + blockIdx.x * blockDim.x;
  __shared__ int blockSum;

  if (threadIdx.x  == 0 ) {
    sum[blockIdx.x] = 0; // Initialise the return value
    blockSum = 0;        // Initialise our block level counter
  }
  __syncthreads();

  // Add each thread's value to our block level total
  blockSum += array[threadGlobalID];
  __syncthreads();

  // Set the return value
  if (threadIdx.x  == 0 ) sum[blockIdx.x] = blockSum;
  return;
}

int main() {
  int globalSum;
  int* sum;
  int* array;
  int numBlocks = 4;
  cudaMallocManaged(&array, N*sizeof(int));
  cudaMallocManaged(&sum, numBlocks*sizeof(int));
  for (int i=0; i<N; i++) array[i] = 1; // Initialize array

  blockReduceArray<<<numBlocks, N/numBlocks>>>(array, sum);
  cudaDeviceSynchronize();

  // Do a reduction on the host of the block values
  globalSum = 0;
  for (int i=0; i<numBlocks; i++) globalSum += sum[i];
  printf("After kernel - global sum = %d\n", globalSum);

  cudaFree(sum);
  cudaFree(array);
  exit(0);
}
The example adds up all the values in an array to produce a single value, also known as a reduction operation. It sums up at the block level on the GPU. Then, each block’s total is returned to the host and summed again to return the total value of adding every value in the array. This example uses the fast shared memory as a buffer to hold the running total of array element additions.
This approach avoids unnecessary writes to global memory until the final update at the end of the kernel. When introducing such optimizations it’s a good idea to use an analysis-driven method. Profile the code, check for any bottlenecks, underutilized hardware, or algorithms to optimize; apply your changes; and then repeat.
After you’ve familiarized yourself with the code, compile and run it to see if it works. You’re initializing each element of the array to one, and there are 1,024 of them, so the final summation should be 1,024. Here’s the output:
$ nvcc -lineinfo example2.cu -o example2.exe
$ ./example2.exe
$
After kernel - global sum = 4
Another bug: 4 is definitely not 1,024, as you were expecting!
Compute Sanitizer racecheck helps you determine what failed and avoid such a scenario. The racecheck command is executed in a similar manner to memcheck and the following example shows the output from the command. Line number 17 is the problem, as shown in the error message.
$ compute-sanitizer --tool racecheck ./example2.exe

========= COMPUTE-SANITIZER
========= Error: Race reported between Read access at 0xe0 in /home/pgraham/devblog/NCS/example2.cu:17:blockReduceArray(int *, int *)
=========     and Write access at 0x100 in /home/pgraham/devblog/NCS/example2.cu:17:blockReduceArray(int *, int *) [16 hazards]
=========
After kernel - global sum = 4
========= RACECHECK SUMMARY: 1 hazard displayed (1 error, 0 warnings)
If you look at that highlighted line of code, you can see the issue:
  ...
  // Add each thread's value to the block level total
  blockSum += array[threadGlobalID];
  ...
All the threads in the block are simultaneously trying to read the shared memory value stored as blockSum, add their array value to it, and write it back to the shared memory address. This creates a race condition like the example in Figure 1. As a result, each thread reads the shared value (0), increments it (1), then writes 1 back. Ultimately, the shared value ends up being 1 instead of 256, and when each of those are added together from the four blocks, you see the wrong answer of 4.
You can fix this particular issue for the block reduction code by changing line 17 to use atomicAdd:
atomicAdd(&blockSum, array[threadGlobalID]);
This operation protects access to the shared value blockSum by ensuring that it is read from, incremented, and written out in serial by the accessing threads. The code now runs correctly.
By the way, the use of atomicAdd in the fix may introduce a slowdown in the code performance. For instance, it is potentially serializing all 256 threads per block. NVIDIA CUB is a reusable software components repository that has both block-level and device-level primitives for performing highly optimized reductions.
Where possible, we recommend using libraries or components such as CUB, when developing and performance-tuning common code patterns, as they often trump the performance of what you could implement in a reasonable time. And they are usually bug-free!
If it was not such straightforward code where you knew the expected answer, something like this race condition could easily be left undiscovered. So, racecheck has helped avoid hard-to-decipher problems further down the line.
Conclusion
Use NVIDIA Compute Sanitizer today by downloading the CUDA Toolkit.
Hopefully, we have given you an idea of how to get started with Compute Sanitizer. Of course, the tools are feature-rich and we have only skimmed the surface. For more information and examples of using Compute Sanitizer, see the /NVIDIA/compute-sanitizer-samples GitHub samples repo and the Compute Sanitizer User Manual.
These recent GTC sessions cover some of the newer features introduced in Compute Sanitizer:
- From the Macro to the Micro: CUDA Developer Tools Find and Fix Problems at Any Scale
- Debugging CUDA: An Overview of CUDA Correctness Tools
For support, the Developer Forums, and the subforum dedicated to the Compute Sanitizer tool are great places to start.
To learn more about using Compute Sanitizer to catch bugs related to uninitialized device arrays and synchronization, see Efficient CUDA Debugging: Memory Initialization and Thread Synchronization with NVIDIA Compute Sanitizer.
Let us know if you would like a deeper dive on any of the features not discussed in this post. Good luck with your bug hunt!
