Technical Blog
Tag: Profilers / Debuggers / Code Analysis
Subscribe
News
May 31, 2022
Improve Guidance and Performance Visualization with the New Nsight Compute
NVIDIA Nsight Compute is an interactive kernel profiler for CUDA applications. It provides detailed performance metrics and API debugging through a user...
3 MIN READ
News
Mar 24, 2022
Record, Edit, and Rewind in Virtual Reality with NVIDIA VR Capture and Replay
Developers and early access users can now accurately capture and replay VR sessions for performance testing, scene troubleshooting, and more with NVIDIA Virtual...
5 MIN READ
News
Jan 25, 2022
NVIDIA Nsight Systems 2022.1 Introduces Vulkan 1.3 and Linux Backtrace Sampling and Profiling Improvements
The latest update to NVIDIA Nsight Systems—a performance analysis tool designed to help developers tune and scale software across CPUs and GPUs—is now...
2 MIN READ
News
Jan 25, 2022
NVIDIA Nsight Graphics 2022.1 Supports Latest Vulkan Ray Tracing Extension
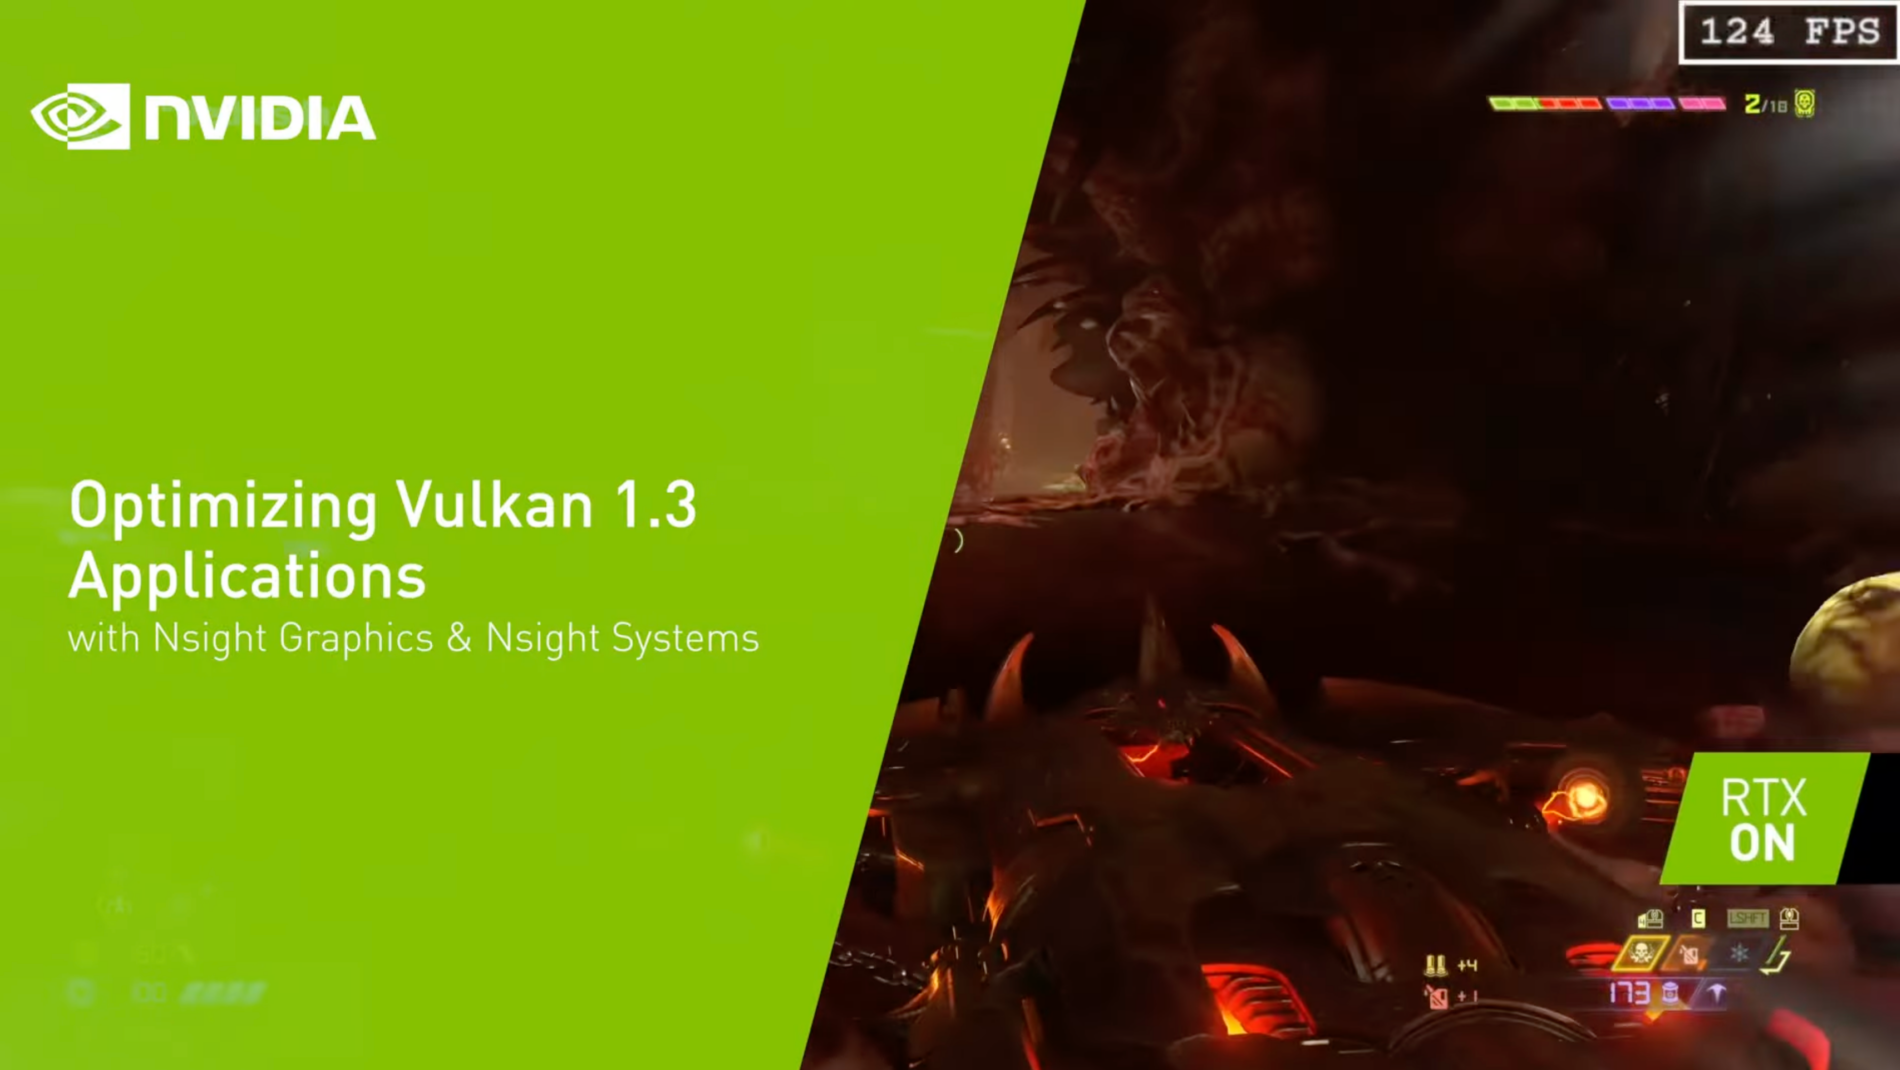
Today, NVIDIA announced the latest Nsight Graphics 2022.1, which supports Direct3D (11, 12, DXR), Vulkan 1.3 ray tracing extension, OpenGL, OpenVR, and the...
3 MIN READ
Technical Walkthrough
Feb 12, 2021
Boosting Productivity and Performance with the NVIDIA CUDA 11.2 C++ Compiler
The 11.2 CUDA C++ compiler incorporates features and enhancements aimed at improving developer productivity and the performance of GPU-accelerated applications....
21 MIN READ
Technical Walkthrough
Aug 02, 2019
Transitioning to Nsight Systems from NVIDIA Visual Profiler / nvprof
The Nsight suite of profiling tools now supersedes the NVIDIA Visual Profiler (NVVP) and nvprof. Let’s look at what this means for NVIDIA Visual Profiler or...
17 MIN READ