
NVIDIA Nsight Systems is a comprehensive tool for tracking application performance across CPU and GPU resources. It helps ensure that hardware is being efficiently used, traces API calls, and gives insight into inter-node network communication by describing how low-level metrics sum to application performance and finding where it can be improved.
Nsight Systems can scale to cluster-size problems with multi-node analysis, but it can also be used to find simple performance improvements when you’re just starting your optimization journey. For example, Nsight Systems can be used to see where memory transfers are more expensive than expected. A quick look at memory activity will catch and correlate performance tolls and suggest how to resolve them.
In this deep dive, I look at the changes between GROMACS 2019 and GROMACS 2020. I go step-by-step with Nsight Systems to find GPU and memory optimization opportunities in the previous version and examine how they were resolved in the newer one.
GROMACS 2019
GROMACS is a versatile and widely used software package designed for molecular dynamics (MD) simulations of biomolecules, such as proteins, lipids, and nucleic acids. It’s used to help researchers examine important biological processes for disease prevention and treatment.
I analyzed GROMACS 2019 using Nsight Systems on an Arm server system with NVIDIA Volta GPUs. Nsight Systems includes both a user interface and a CLI, called nsys.
The following command runs nsys to collect trace information for CUDA and NVTX with no CPU sampling. It’s used here to gather performance data from the target Arm server, which can then be analyzed in the Nsight Systems user interface as usual. For more information about nsys and the profiling options, see Example Single Command Lines.
nsys profile -t cuda,nvtx -s none gmx mdrun -dlb no -notunepme -noconfout -nsteps 3000
Figure 1 shows executing this command and opening the report file.
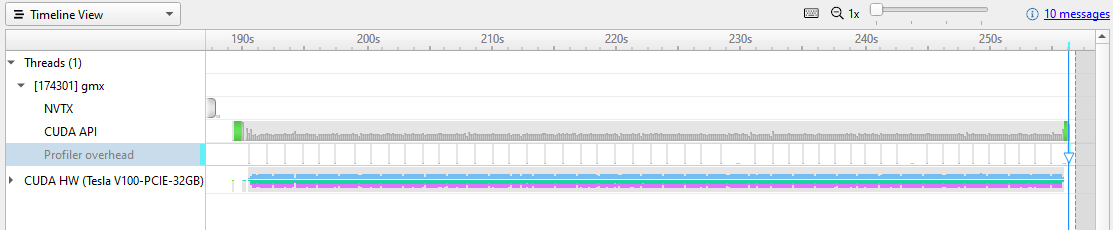
Nsight Systems uses level of detail (LOD) scaling to show you how much GPU usage is under each pixel on the timeline. However, at this zoom level, the data is way too dense to see real patterns. Zooming in reveals the granularity of what Nsight Systems captured.
Likewise, there is information about the GPU activity, but details are organized under drop-downs. Expand the GPU line to reveal information about streams and contexts.
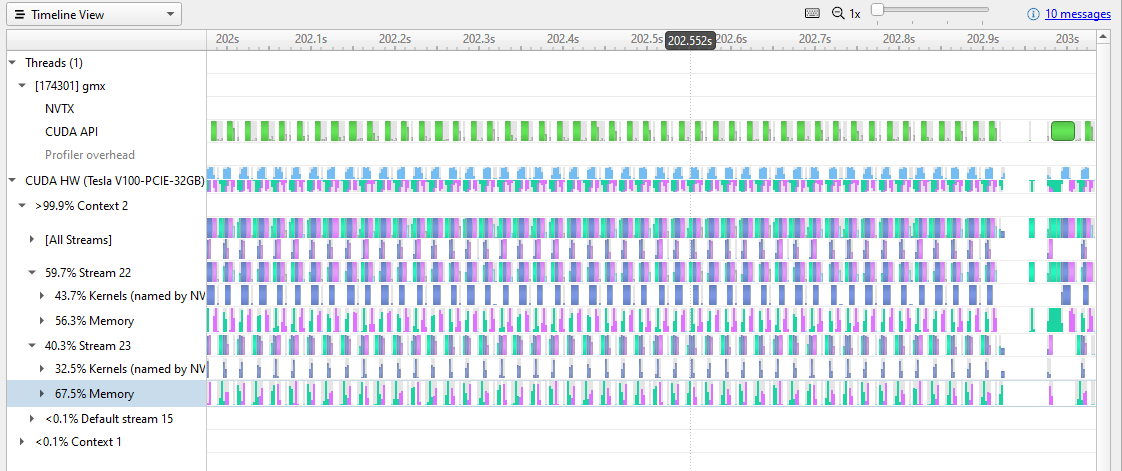
In Figure 2, you can start to see a repetitive pattern of memory transfers and kernel activity on the GPU. Repetitive patterns are normal, but you can also see that a lot of time is being spent on memory transfers. There are gaps in the GPU activity that indicate opportunities for improvement.
Figure 3 zooms in further to 0.1 sec clock time.
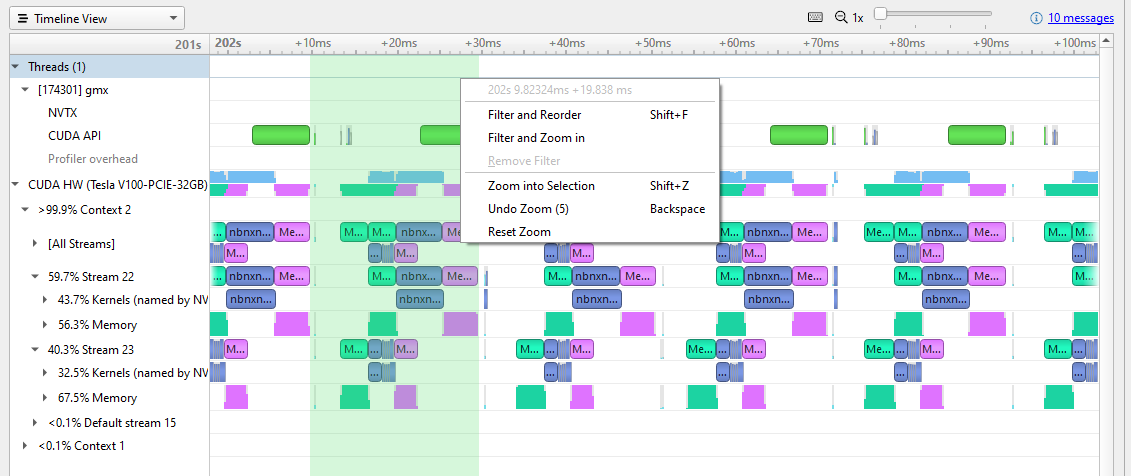
At this resolution, you can clearly see the pattern of activity on the GPU. In each repetition, there is a host-to-device memory transfer (green), some kernel work (blue), and then a memory transfer back to the host (magenta). You can also see the pause after each kernel is run, before the new memory transfer starts.
Figure 3 shows shift-dragging across a single iteration, from the end of the previous device-host transfer to the end of this iteration’s device-host transfer (the selection marked in green). Right-clicking here brings up the menu, and you can zoom in to isolate this iteration.
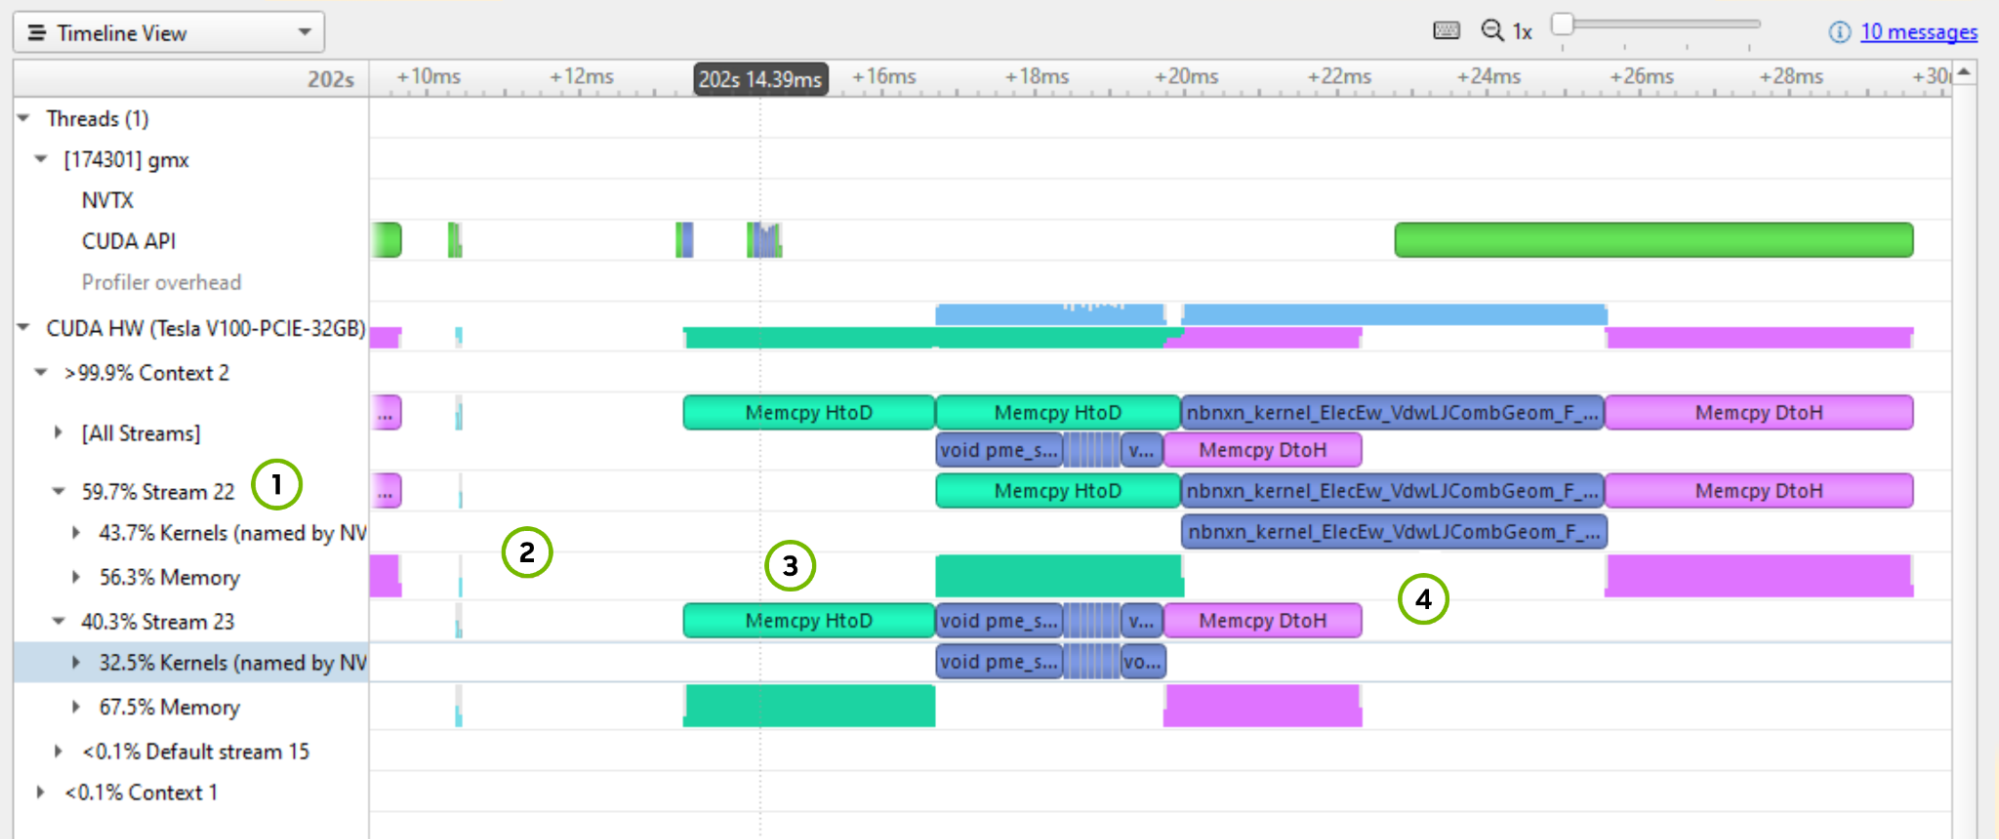
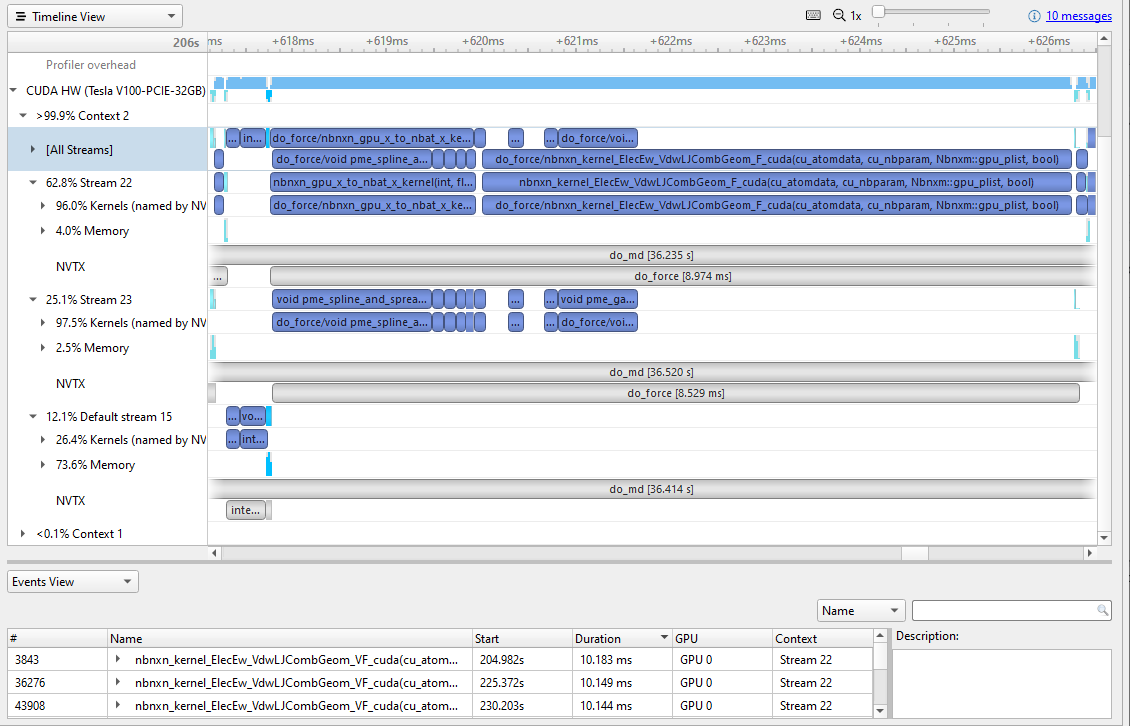
A few things marked on Figure 4 to point out:
- The [All Streams] row is an amalgamation of the streams. Focus on the breakdown, and notice that there is one active context with two active streams (Stream 22 and 23) and that the Default stream is inactive. Each stream is spending more than half of its time on memory transfers. This high percentage is a strong indication that you must optimize the size of memory transfers and consider moving them to the default stream.
- The iteration takes ~19 ms, but 3 ms of that time is in an empty gap between chunks of activity. This implies that there is a ~17% speedup waiting to be captured. A good next step would be to run a CPU profile to check for a programmatic reason for the pause.
- Memory transfers are serialized. Stream 23 gets data from the host, while Stream 22 waits, doing no work until it can get its data. The same thing happens after the work is complete.
- The most dominant work kernel is
nbnxn_kernel_ElecEw_VdwLJCombGeom_VF_cuda. I suggest resolving gaps on the CPU and GPU timelines before diving deeper into individual kernels.
To look for the most expensive kernels, right-click the [All Streams] row and choose Show in Events View (Figure 5).
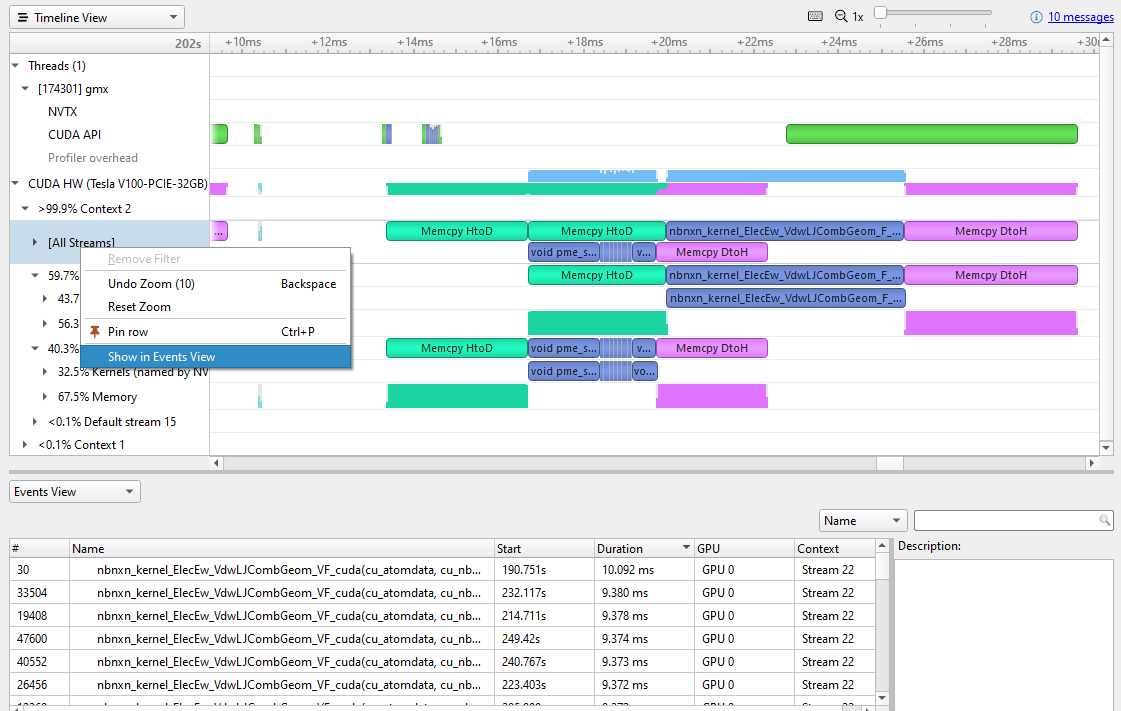
Sorting the Events view by duration reveals the most expensive kernels. Different instances vary a bit, but the most expensive is currently ~10 msec. Clicking on a particular kernel instance highlights all the events that correlate with it on the timeline in cyan.
In Figure 6, a cyan marker on a closed row indicates that something in that row is highlighted. Arrows at the top or left-hand side of the timeline indicate that something highlighted is currently off the screen.
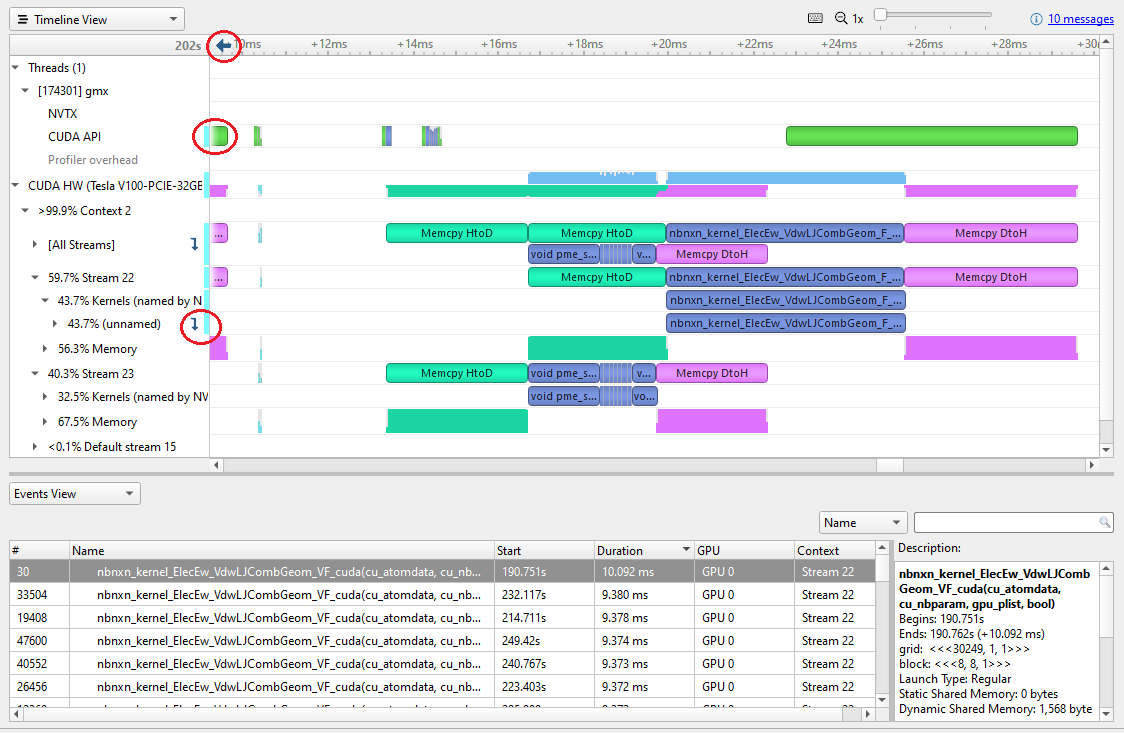
Alternatively, you can right-click in the event table and choose Show Current in Timeline to zoom the timeline to that kernel.
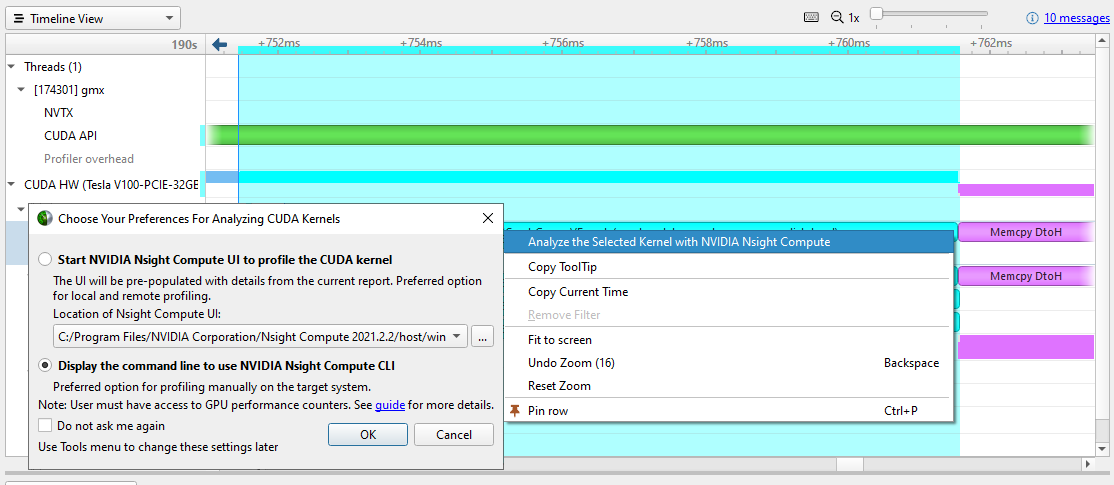
Most of the time, you concentrate on removing timeline gaps and making sure that work is distributed to all CPUs and GPUs before diving into individual kernels. When that time comes, or if kernel performance is out of line with your expectations, you can right-click the kernel of interest and choose Analyze the Selected Kernel with NVIDIA Nsight Compute.
Nsight Compute is a powerful standalone tool for profiling, debugging, and optimizing CUDA kernels. You can launch its user interface or CLI directly from the problematic kernel in Nsight Systems, if it’s installed on your machine.
GROMACS 2020
Improvements were made to GROMACS in collaboration between NVIDIA and the Stockholm GROMACS development team. For more information about the specifics, see Bringing Gromacs Up to Speed on Modern Multi-GPU Systems.
There are a couple of changes that you may notice:
- The
nbnxn_gpu_x_to_nbat_x_kernel is the GPU implementation of a function to convert coordinate data of atoms from “XYZ” into a structure that also has charge in it for data locality: XYZQ. In GROMACS 2019, this was done on the CPU. The 2020 release resized and moved memory transfers to the default stream. - The long kernel
nbnxn_kernel_ElecEw_VdwLJCombGeom_VF_cudanow enables overlapped kernel execution between the two streams.
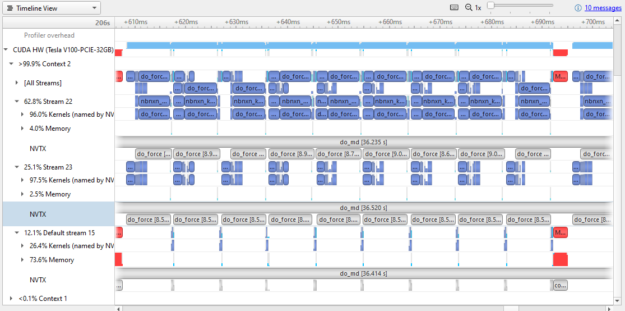
Compare the results in Figure 8 to Figure 3. Both show ~100 msec of wall clock time. As you can see in Figure 8, a lot more of the GPU time is actually doing work. GPU usage has clearly been optimized between versions.
Almost all the memory transfer work has been moved onto the default stream, meaning that the two active streams have little time spent in memory transfer operations (4% and 2.5% compared to over 50% in GROMACS 2019). Small memory transfers have also been combined to larger sizes that still fit in transfer buffers.
Comparing Figure 4 (one work slice of GROMACS 2019) to Figure 9 (one work slice of GROMACS 2020) is not quite a fair comparison. As I mentioned earlier, much of the memory transfer was bundled up and shifted to the default stream. There are several interesting things to note:
- There is much more parallel kernel execution between the two streams.
- The
nbnxn_gpu_x_to_nbat_x_kernel is being run on the GPU before the expensive calculation. Moving this to the GPU instead of the CPU has not only filled up some of the gap time, but it also removed some of the memory transfer overhead. - The expensive kernel,
nbnxn_kernel_ElecEw_VdwLJCombGeom_VF_cuda, has not gotten any faster. The longest instance is still roughly 10 ms. However, because it is more efficiently fed data for this whole iteration of running, that work is reduced to 10 ms instead of the 19 ms in GROMACS 2019.
Now that the gaps are cleared out, nbnxn_kernel_ElecEw_VdwLJCombGeom_VF_cuda is dominating the run time, indicating that your performance tuning journey should move on to that kernel next.
Key takeaways
Improving CUDA kernels is not the first thing that you should do when optimizing GPU code. Improving memory utilization and making sure that the GPU is “fed” enough makes the most immediate impact.
This can be especially important when initially refactoring for GPU or when moving to new generations of GPU hardware. If the GPU is starved for work, you will never realize the performance gains available.
Ready to get started?
This is just the beginning of all the system performance information that Nsight Systems has to offer.
NVIDIA Nsight Systems is available from the NVIDIA CUDA ToolKit public download. You can also obtain the most recent, updated Nsight Systems with enhancements and fixes beyond the version shipping in the NVIDIA CUDA Toolkit on the Nsight Systems page.
For more information about GROMACS, see http://manual.gromacs.org/documentation/.
For other recent posts, see the following:
- Understanding the Visualization of Overhead and Latency in Nsight Systems
- Optimizing DX12 Resource Uploads to the GPU Using CPU-Visible VRAM
For a full list of posts, videos, and other tutorials, see the Other Resources section of the Nsight Systems documentation.
Have a question? Post it to the NVIDIA forums using NVIDIA Nsight Systems. Drop a message at nsight-systems-feedback@nvidia.com. Or just choose Feedback in the application to let us know what you are seeing and what you think.
