
When developing on NVIDIA platforms, the hardware should be transparent to you. GPUs can feel like magic, but in the interest of optimized and performant games, it’s best to have an understanding of low-level processes behind the curtain. NVIDIA Nsight Developer Tools are built for this very reason.
Imagine a proud homeowner who lives in a house that they love and want to take care of. Of course, this includes updating the utilities, doing a spring cleanup, and maybe even building a new addition. But taking care of a home also includes the often not-so-pretty maintenance work. Is there a leaky pipe causing water damage? The kitchen sink is running brown, so could this be related to a pipe issue? Now there’s mold under the shingles, the floorboards have started to creak, and the AC doesn’t want to start. There are more questions than answers and solutions can seem helplessly out of reach.
Managing any project, from game development to homeownership, requires due diligence to ensure that all parts are working as intended. This can be a daunting challenge; when issues stem from some underlying breakpoint, how do you fix what you can’t see? Ultimately, there is no other way to identify and remedy the root of an issue than to lift the outer shell. When the inner workings are exposed—and more importantly, understood—solutions are made clear.
When taking care of a house, you can equip yourself with the right tools to diagnose any issue at hand and help prevent any issues in the future. Perhaps you want to attach a TV to the wall but you don’t know where the studs are. Avert a crisis by using a stud finder to locate the best anchor points.
Likewise, for graphics development, it is vital that you feel empowered to handle any bug fix or optimization need that could arise. Just like any other project, having the right tools enables this.
What are developer tools?
Good developer tools are like an x-ray machine that allows you to peek into the internals of the GPU. There is always some layer of abstraction between the physical computer and the application that you are building, but you can’t optimize and debug what you can’t see. Developer tools grant visibility to hardware-level processes and expose the computing that drives graphics on the screen.
By revealing activity metrics like GPU throughput and identifying slowdowns like frame stutters, developer tools help ensure your final product is performant, optimized, and well-made. Simultaneously, tools offer speed-ups to development time by eliminating time sinks caused by uninformed bug fixing.
Something has clearly failed when the output on the screen does not align with your intentions. When you’re coding, an error is returned when a line doesn’t work. However, flags aren’t automatically raised for code that could be written a little more performantly or with a few more optimizations.
The same can be said for graphics development. When frame rates suddenly drag or scene loading lingers too long, it is futile to guess-and-check answers without going under the hood to profile issues at the hardware origin. By providing low-level insights to inform debugging, developer tools help eliminate the need to brute-force solutions.
Tools can also help handle a more dramatic case: when there is no output on the screen. A GPU crash can halt graphics processes in an abrupt, confounding way. In the era of massively programmable GPUs, you can write custom shading methods, and memory access is built to be immediate and direct. These features enable stylistic variety with speedy processing, but also new opportunities for errors to trigger a crash. Having access to hardware state at the moment of failure is critical in remedying a GPU exception.
What is Nsight?
NVIDIA Nsight Developer Tools are the suite of tools that provide the most direct and comprehensive access to NVIDIA GPUs and the low-level code that interfaces with them. Nsight provides critical information for performance tuning and optimizations that you would normally not have access to.
NVIDIA graphics cards are complex and can do amazing things when fully utilized. This point grows in scale with each new GPU generation, markedly so for the NVIDIA Ada Lovelace architecture. The Nsight suite of tools helps ensure your application is capturing the full potential of the GPU processing power.
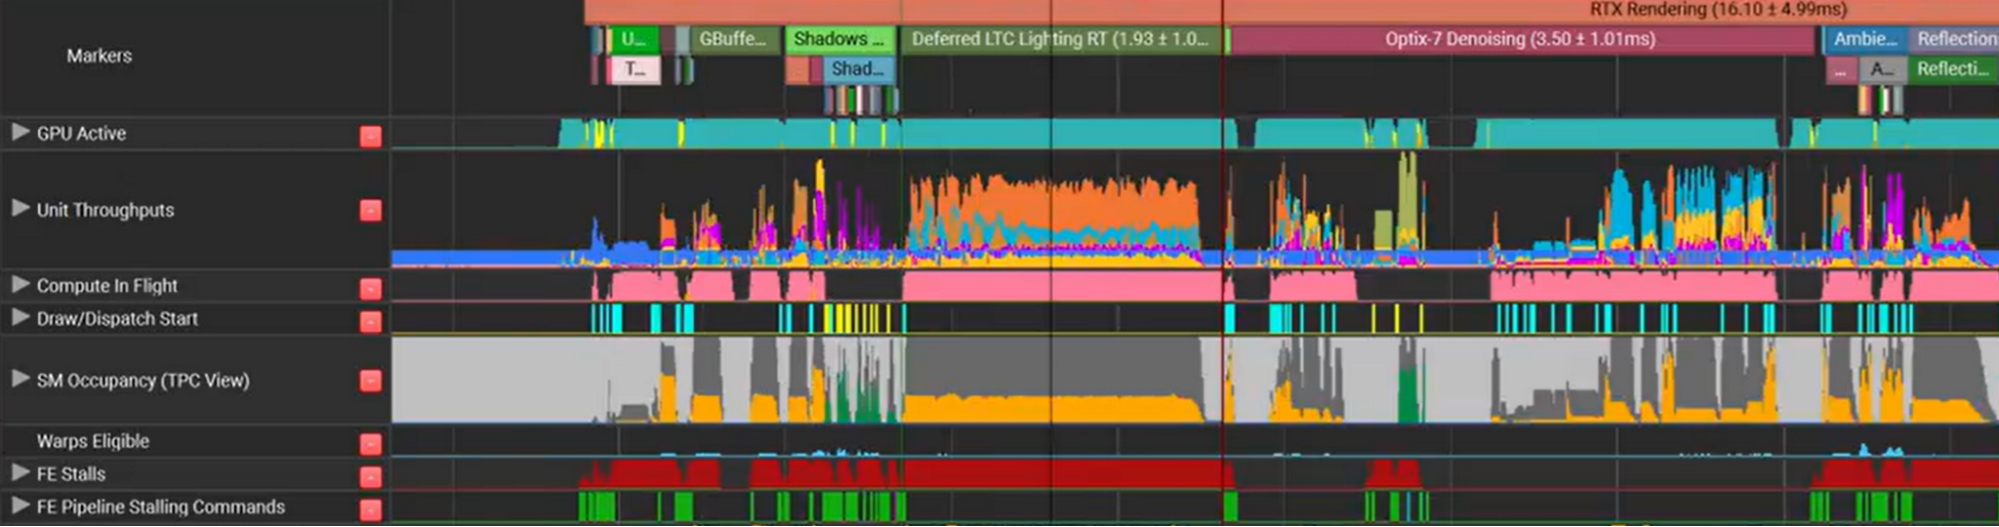
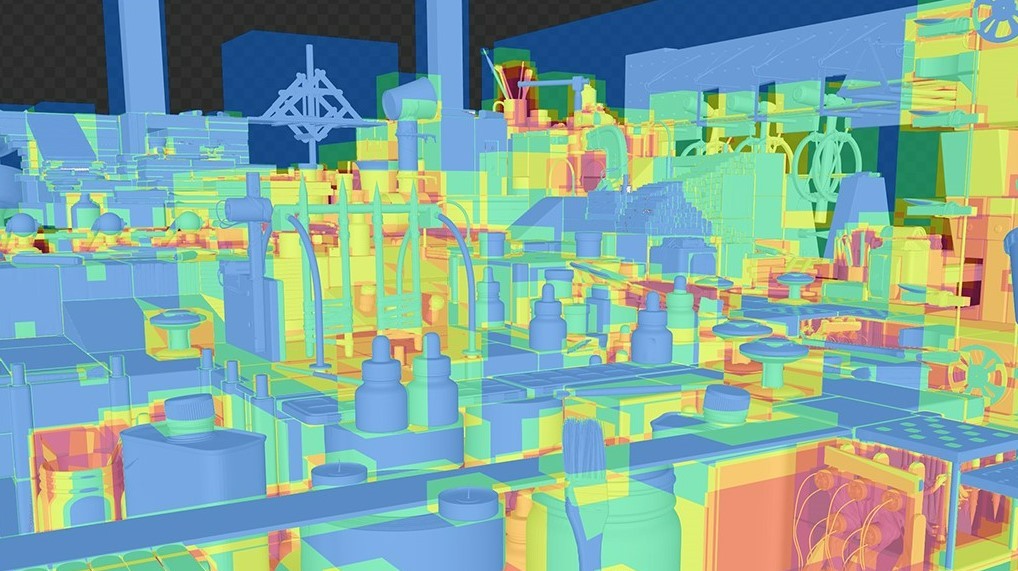
This is particularly true when developing NVIDIA RTX–enabled apps and games. Nsight Graphics offers in-depth graphics debugging for both ray-traced and rasterized applications. It exposes inefficiencies in the rendering pipeline and makes optimizations easy to find through clear visuals, like the GPU trace and frame analysis.
If you are looking to access GPU performance metrics live and in-application, you can use the Nsight Perf SDK, which features a real-time HUD solution that monitors GPU activity.
For a system-wide approach to performance tuning, Nsight Systems profiles GPU throughput in parallel with CPU performance and other metrics including network and memory operations. By providing a top-down capture of these workloads, performance limiters can be identified and correlated with other hardware events to guide tuning activities at the source.
To handle an unexpected GPU crash, which can be one of the most frustrating hindrances to any developer, the Nsight Aftermath SDK generates detailed pipeline dumps that identify source code where an error occurred.
The are many more Nsight Developer Tools to explore that could be relevant to your development field. Nsight also includes a collection of CUDA compute tools, including Nsight Compute for CUDA kernel profiling. For more information about the breadth of tools available, see NVIDIA Developer Tools Overview.
Get started with Nsight Developer Tools
Nsight tools has extended support to the NVIDIA Ada Lovelace architecture. To learn about how Nsight tools uplift game development on the newest generation GPU, see the following videos.
Learn Fundamentals for Ray Tracing using NVIDIA Nsight Graphics and NVIDIA Nsight Systems and get started with the technology today:
Explore more Nsight Developer Tools.
