Shaders are specialized programs that run on the GPU that manipulate rays, pixels, vertices, and textures to achieve unique visual effects. With shaders, you can add creative expression and realism to the rendered image. They’re essential in ray tracing for simulating realistic lighting, shadows, and reflections.
We love shaders, but they can be hard to debug. Shader calculations are complex, and run across multiple threads, which can lead to synchronization issues and inconsistent bugs that are difficult to reproduce. Developers typically must manually trace shader logic, determine which resources are being accessed, and deduce where errors occur. This process is inefficient, and often involves incrementally commenting out parts of the shader to test and locate problems: a strategy prone to errors.
Rendering techniques like denoising present additional challenges due to their use of recurrent buffers. Errors in these buffers can propagate across frames, making it difficult to identify the root cause. Again, traditional debugging tools typically don’t provide the necessary insights, forcing you to fall back on manual debugging techniques to trace multiple passes and find the source of the problem.
New Shader Debugger in NVIDIA Nsight Graphics
NVIDIA has heard loud and clear that the graphics community needs powerful, intuitive shader debugging tools to address these needs. Today, NVIDIA is releasing the new Shader Debugger in NVIDIA Nsight Graphics. Available in Beta for Vulkan applications, the Shader Debugger enables you to debug in real time complex shaders that are hundreds or thousands of lines long.
The Shader Debugger represents a significant leap forward in GPU debugging technology, offering a hardware-accelerated solution for diagnosing and resolving shader issues. Designed to support ray tracing, raster, and compute shaders (with mesh shader support coming soon), the tool enables you to quickly debug issues that could otherwise take much longer to resolve. With the Shader Debugger, you can quickly pinpoint and solve the root of issues such as incorrect normal calculations, ambient occlusion errors, and texture mapping issues.
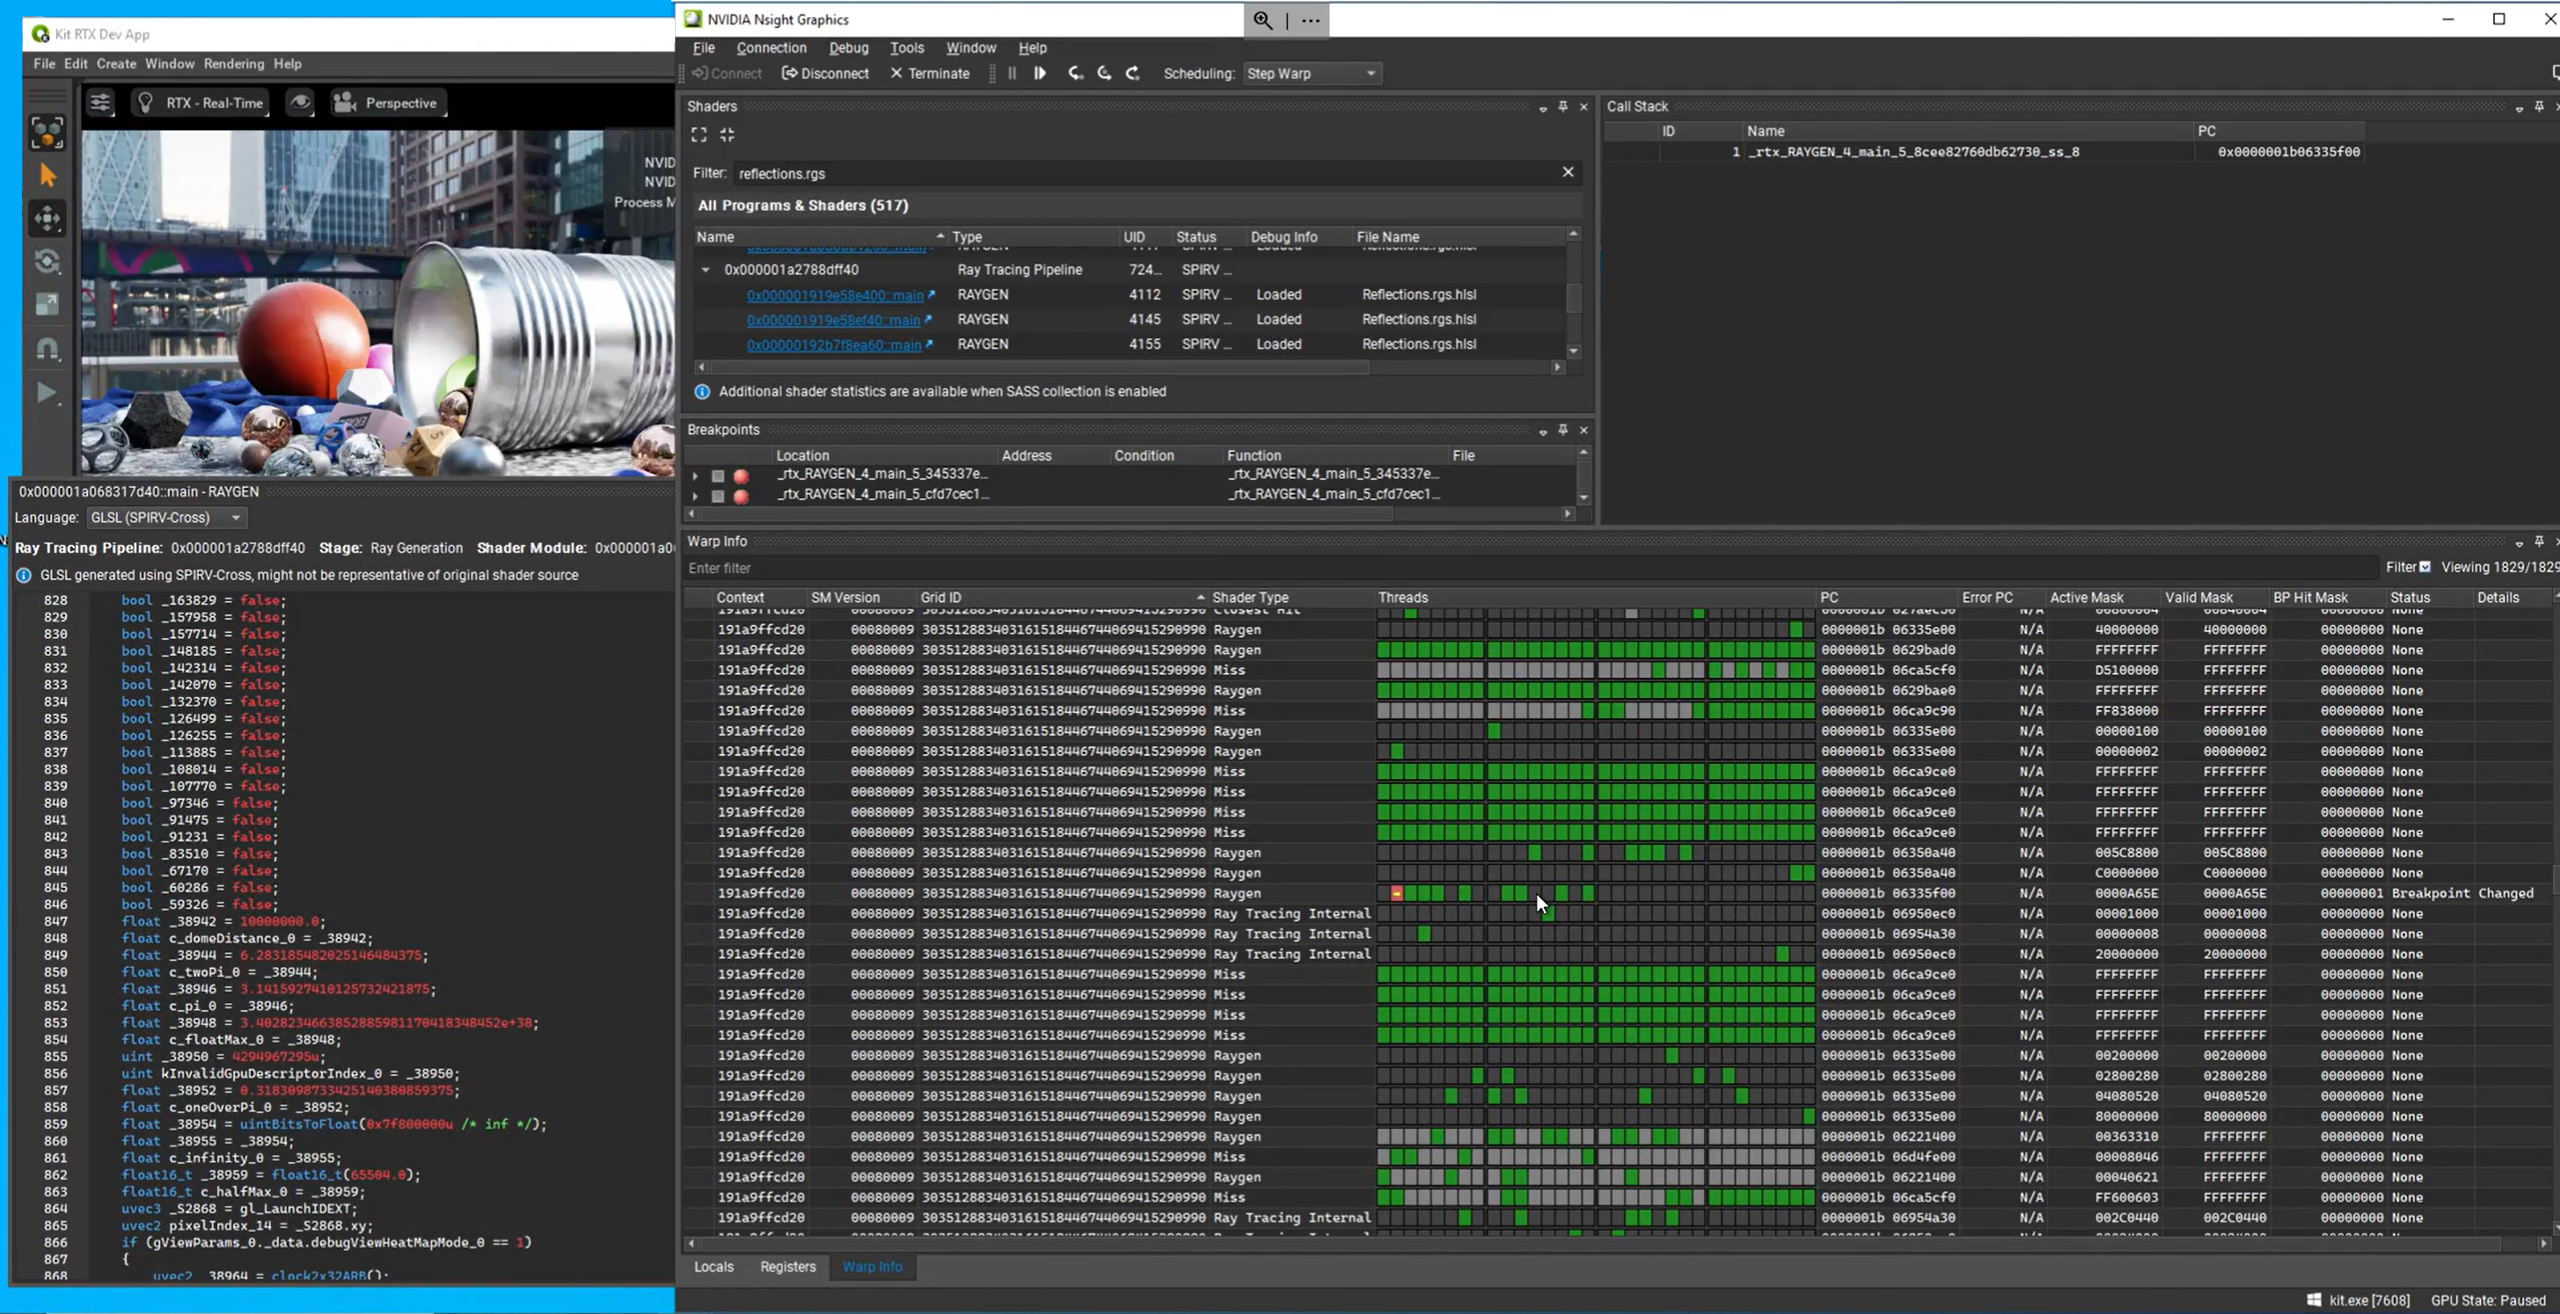
Figure 1 shows an example of debugging ray generation shaders in an NVIDIA Omniverse sample. The Warp View is being inspected. Each row is a warp, green cells represent threads within the warp, and the red cell indicates a thread that has stopped at the current breakpoint.

Debugging shaders with Nsight Graphics uses familiar debugging workflows. Key features include:
- Real-Time Debugging: You can inspect and modify shader code while the application is running, making it easier to identify and fix issues on the fly.
- Set Breakpoints: Pause the execution of a shader with a source level breakpoint and inspect variables, similar to traditional CPU debugging. This allows for step-by-step execution and analysis of shader code.
- Conditional Breakpoints: Add a condition to a breakpoint to isolate specific scenarios or values, streamlining the debugging process by focusing on relevant areas of the workload.
- Locals and Watch Windows: Examine variable values at breakpoints using the Locals or Watch windows, making it easier to identify discrepancies and where values diverge from expectation.
- Warp Info and Focus Picker: The Warp View provides an overview of thread execution states, while the Focus Picker offers a graphical perspective of shader activity. These tools enable developers to visualize and understand GPU behavior in context.
Getting started with the Shader Debugger
You’ll find the Shader Debugger as a new selectable activity when you connect Nsight Graphics to your target application. Choose the application executable you want to profile. If you’re using a host machine to debug a target through the network, ensure you’re connected to the target system.
Graphics workloads run at full speed until a breakpoint is set and the shader is JIT recompiled for debugging, so there’s no performance impact when navigating to the location of interest to debug, and minimal overhead when debugging.
Shader Debugger features
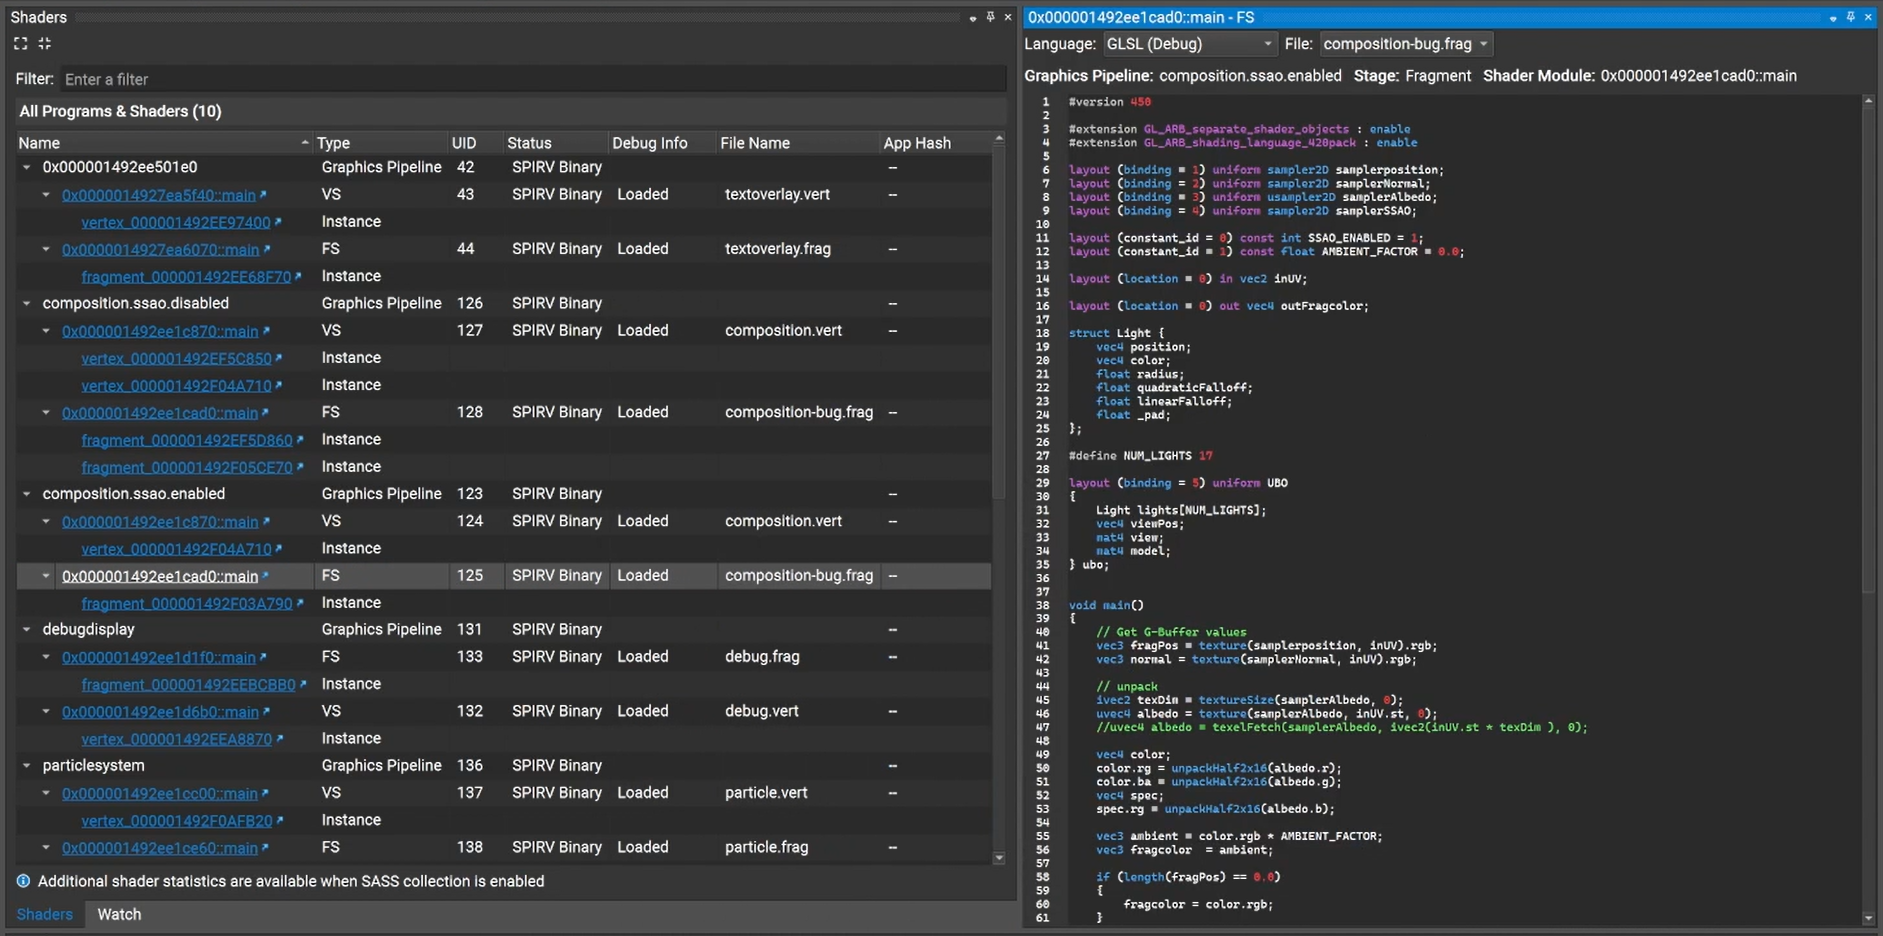
Launching the Shader Debugger will first present all of the graphics pipeline, and the shaders contained within it. In Figure 2, programs and shaders are shown in the list on the left. A shader that has Screen Space Ambient Occlusion (SSAO) is opened by left clicking on it, revealing the corresponding source code on the right.

By setting a breakpoint, you can pause the execution of shader code at specific points, similar to traditional debugging tools. When a breakpoint is reached, the application pauses, and you can inspect the state of the shader, including local variables. By inspecting variables at a specific point in the shader’s execution, you can diagnose issues.
You can also step through shader code line by line, watching as variables are populated and the shader’s logic is executed. This is a powerful tool for understanding how a shader is behaving to identify issues. Variables that are part of the current scope are shown in the Locals Window.
Warp View
The Warp View gives you an overview of what is resident on the GPU at a shader unit level. It shows which warps are at the current breakpoint and which threads within a warp have stopped at that breakpoint. This helps you understand how the shader is being executed on the GPU.
In the table shown in Figure 3, each row represents a warp, and each block is a thread within that warp. Red blocks indicate threads that have stopped at your set breakpoint, while green blocks are threads not at the current breakpoint. You can select individual threads to examine corresponding local variables.

Focus Picker
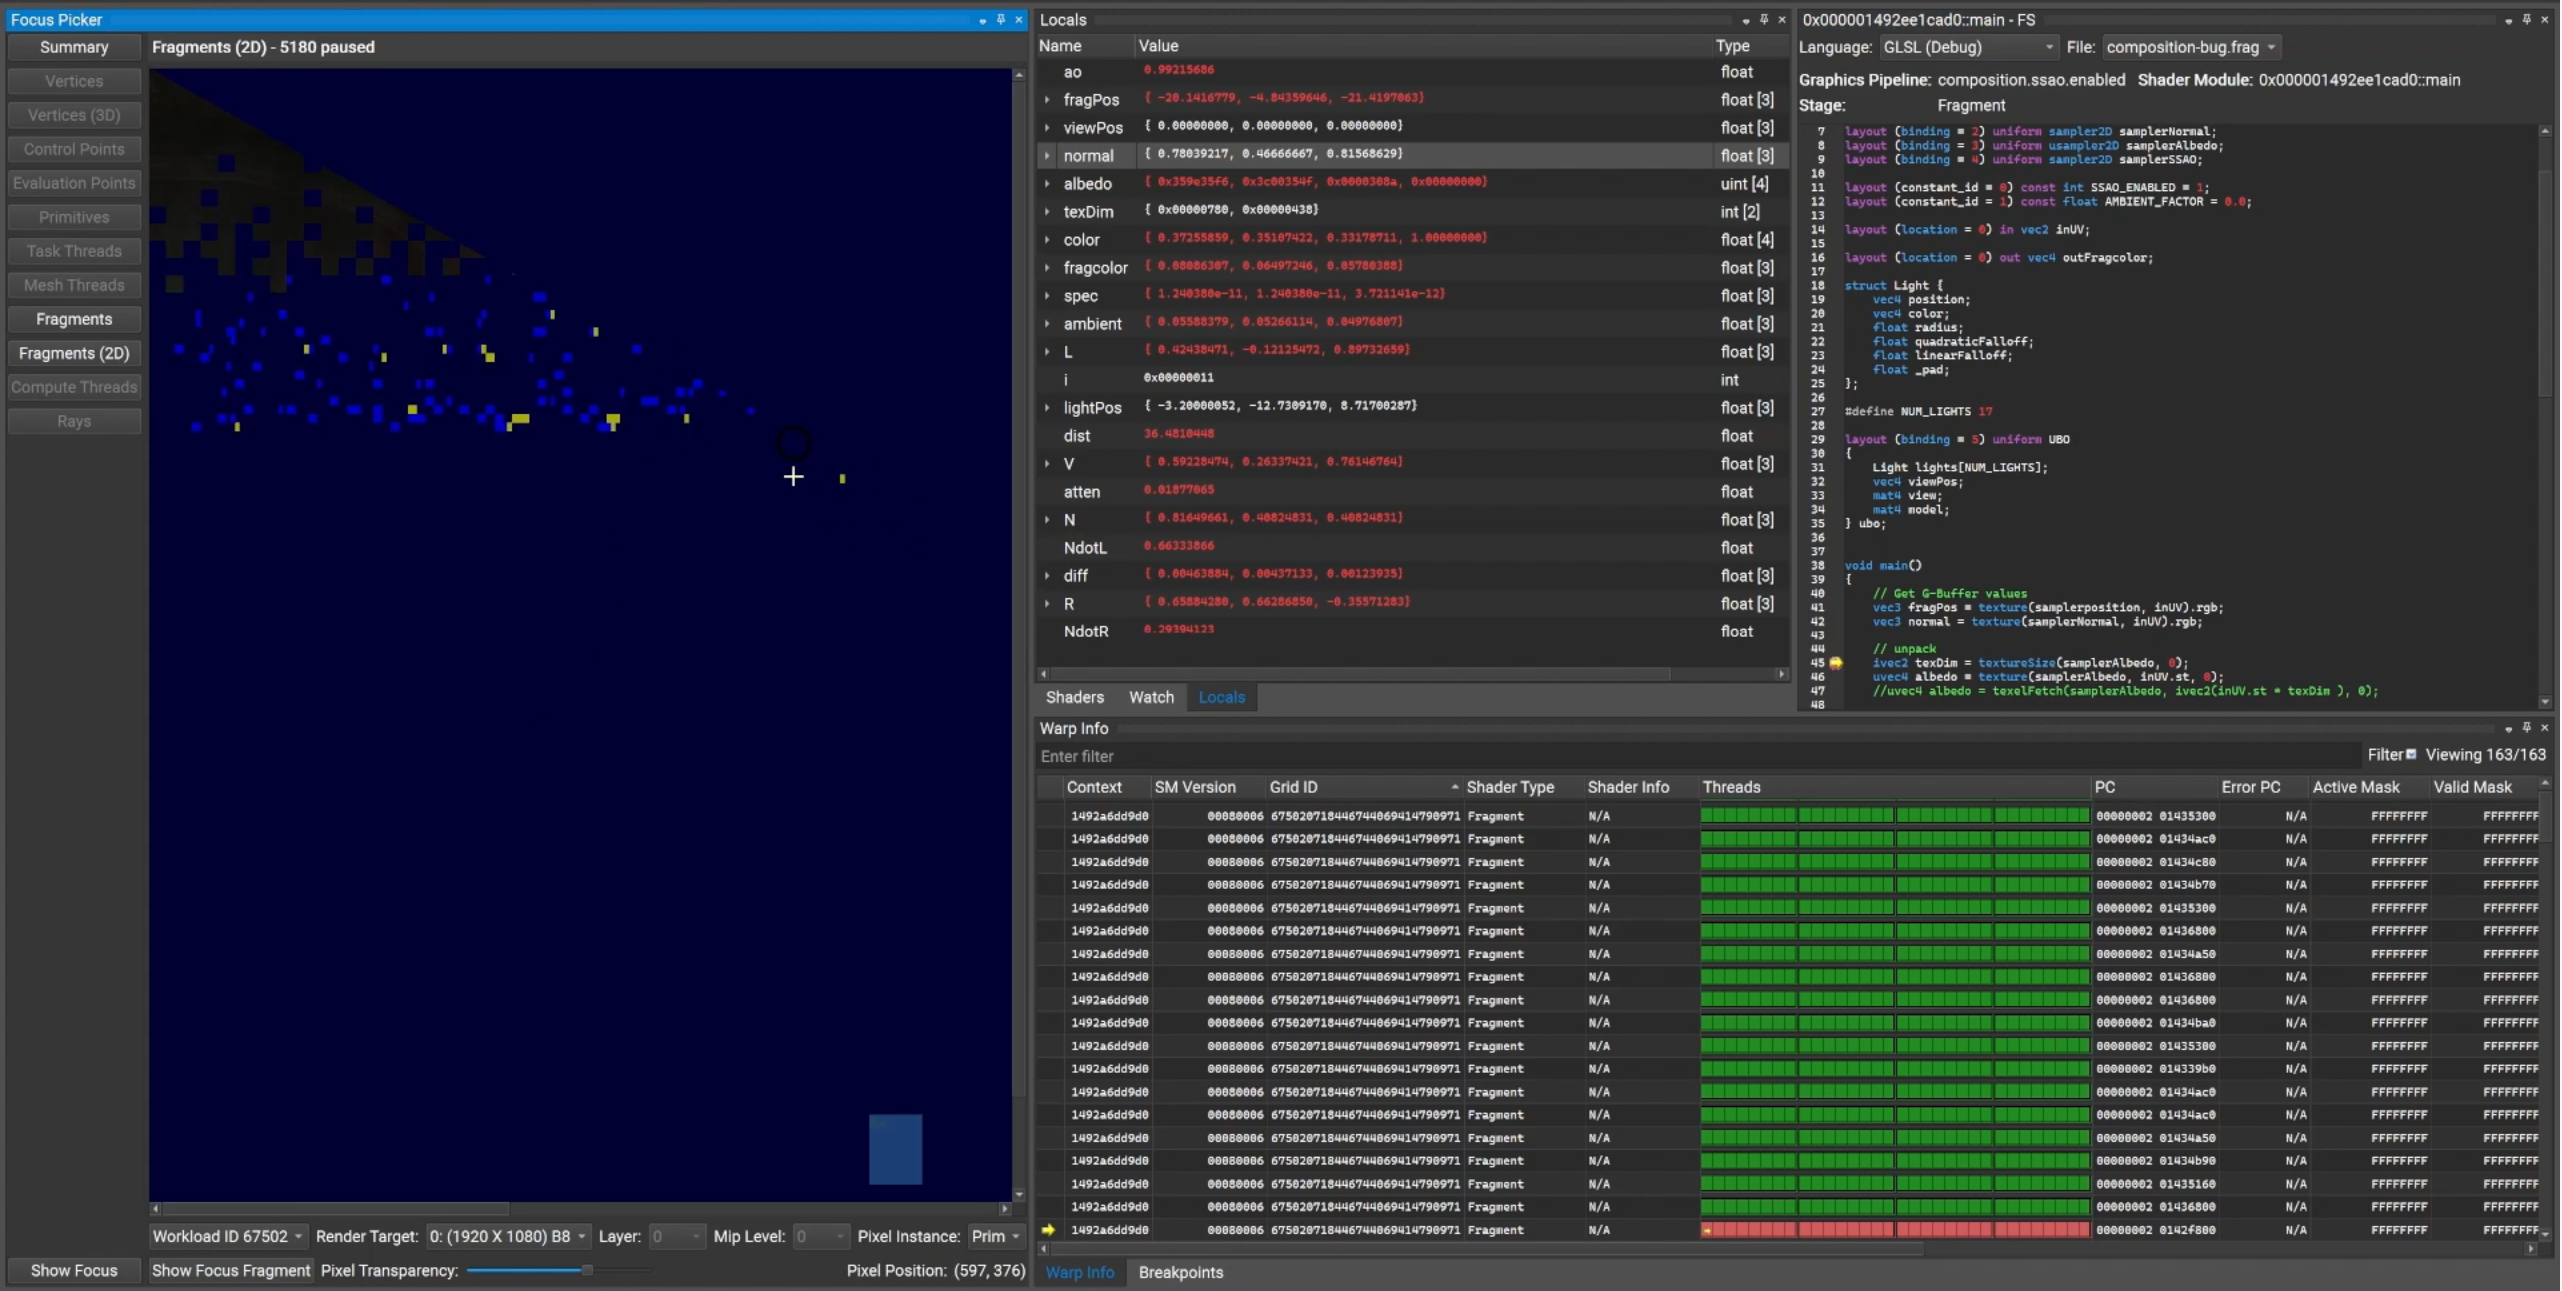
The Focus Picker helps you visualize how the shader code and low-level GPU execution you are debugging affect the rendering results. It provides a visual display of the fragments that are currently in flight, allowing you to inspect them superimposed on your current render target. The Focus Picker shows fragments that have currently landed in light blue and fragments in flight in yellow.
In Figure 4, the Focus Picker (left) shows the render target as each individual pixel gets built. You can step through the scene being rendered and inspect the corresponding variables, warps, threads, and source code of individual fragments. Stepping through your source code reveals the progress of fragments being generated. Click on any individual fragment to begin inspecting and debugging it.

Shader Debugger hardware requirements
The Shader Debugger requires either a dual-GPU local system or a network setup, where one system hosts Nsight Graphics and the other runs the target application. For running the target application, the Shader Debugger works with NVIDIA Ampere GPUs and newer. For running Nsight Graphics, any other GPU, discrete or integrated, can be used. Nsight Graphics also supports remote debugging.
Unlike CUDA workloads, which support instruction-level preemption to interrupt code execution for debugging, graphics workloads only support primitive-level preemption, which enables the GPU to be preempted at the triangle level, not per ray, vertex, or fragment. Instruction-level precision is needed for debugging tasks, so Nsight Graphics uses a dual-GPU setup for precise shader debugging.
More on Nsight Graphics 2024.2
There are even more new features in Nsight Graphics 2024.2 to boost your graphics debugging and profiling workflows. Check out the Developer Tools at SIGGRAPH 2024 spotlight video for the latest on Nsight Tools innovations:
Conclusion
The Nsight Graphics Shader Debugger is an essential tool for graphics developers aiming to debug their applications and achieve high-quality visual results. Its robust feature set and hardware-accelerated performance ensure that debugging complex shaders is more accessible and efficient than ever before.
The Shader Debugger is available now in Beta for Vulkan applications. Download Nsight Graphics 2024.2 to get started. Tell us about your experience with the Beta using the Feedback Button on the top right of the Nsight Graphics window.
Browse more Nsight Developer Tools and tutorials for Nsight Tools. Ask questions, provide feedback, and engage with the graphics developer community on the Nsight Graphics Developer forums.
