
On April 21, 2021, the EU Commission of the European Union issued a proposal for a regulation to harmonize the rules governing the design and marketing of AI systems called the Artificial Intelligence Act (AIA).
AI systems are considered to be risky by regulatory bodies. High-risk AI systems are subject to specific design and implementation obligations to improve transparency. Credit scoring models are an example of a high-risk use case.
Prior to the Artificial Intelligence Act, principles on transparency had already emerged in several European guidelines on AI. For example, in the Ethics Guidelines for Trustworthy Artificial Intelligence, data, system designs, and the business model should be transparent. Connected to transparency, both the technical processes of an AI system and related human decisions must be explainable.
The obligation to transparency and explainability of AI had also been addressed in the European Union Horizon2020 research and innovation project FIN-TECH.
The project developed new approaches and use cases to manage risk and to scale digital finance and AI in the European financial services landscape. More than 20 universities were involved as well as the European supervisory and financial service community, attending workshops, training, and use case presentations as well as delivering feedback and evaluations of the use cases.[1] For more information, see the NVIDIA/fsi-samples GitHub repo.

Figure 1. Logos of the EU Horizon2020 project FIN-TECH (left) and the European Commission (right).
The project has received funding from the European Union’s Horizon 2020 research and innovation program under grant agreement no. 825215 (topic ICT-35-2018, Type of action: CSA).The content reflects only the author’s view and the Commission is not responsible for any use that may be made of the information it contains.
The best rated AI use case in the project was an Explainable AI (XAI) approach to credit risk management that was designed to overcome the explainability gap of AI models. The project’s evaluation system had identified this case based on the structured feedback of supervisory authorities, central banks, financial service companies and fintechs across Europe.
The use case was published in Springer as Explainable Machine Learning in Credit Risk Management and uses Shapley values and SHAP (SHapley Additive exPlanations) to identify the most important variables for decision making in an already trained AI/ML model. It had been inspired by a model published by the Bank of England: Machine learning explainability in finance: an application to default risk analysis.
The underlying methodology analyzes explanatory data either locally or globally and in groups or clusters, where every cluster consists of portfolio constituents with similar explanatory data. In this way, it is possible to get an in-depth understanding of the inner workings of a trained model, to both potentially debug and control it. The methodology also enables investigating the network and complex systems effects in the explanatory data.
It is a straightforward technique to use, and the workflow and combination of algorithms could be applied to a number of artificial intelligence (AI) and machine learning (ML) applications. Before describing the benefits and utilization scenarios of the concept, we discuss the computational challenges of the approach and the demand for accelerating such models with technologies used in high-performance computing (HPC).
Accelerating modeling, explainability, and visualization
The original dataset used in the FIN-TECH was rather small compared to the real-life data. Because it was necessary to test the model on a larger data set to understand the implications in production environments at scale at financial institutions, a team at NVIDIA implemented the entire workflow in RAPIDS to process large amounts of data quickly. This improved performance allows for quicker iteration, saving your data science teams time and allowing for better results faster.
RAPIDS is a suite of open-source Python libraries that can speed up end-to-end data science workflows using GPU acceleration. In this use case, it accelerates the entire workflow:
- Data loading and preprocessing
- Training
- Explaining (SHAP values)
- Clustering the SHAP values
- Dimensionality reduction
- Visualization and filtering
The team processed a Fannie Mae data set similar to the one in this related post, Explaining and Accelerating Machine Learning for Loan Delinquencies, with millions of data points.
The SHAP values are clustered into groups, but can also be analyzed by means of network graph analysis. The RAPIDS GPU-accelerated libraries cuML (Machine Learning Algorithms) and cuGraph (Graph Analytics) are ideal for this use case. This also applies to the dimensionality reduction to later plot the SHAP point clouds in 2D or 3D. Also, the following filtering and visualization steps can be built with GPU-accelerated Plotly and other tools.
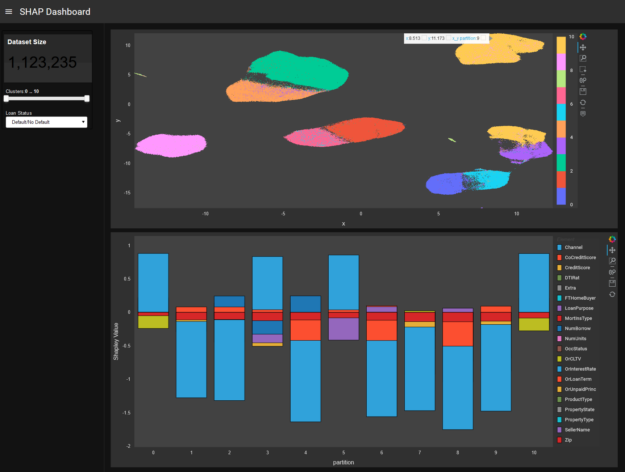
Figure 2 shows that dashboard users can interact with the SHAP values for the model and further analyze either the full picture on model level or drill down into specific ‘regions’ of the model. For explainability, each cluster of points in the top plot represent a group of similar loans which are numbered 0 through 10. Each cluster is characterized in the bottom plot with the cluster number along the x-axis. For a given cluster, the height of a rectangle corresponds to the Shapley value and the color to the credit customer mortgage loan features from the dataset. From a positive or negative Shapley value, you can tell how a cluster’s feature makes a loan less (negative direction) or more (positive direction) likely to default.
For example, you can display the SHAP clusters of the entire model and further analyze a specific cluster and data points, looking at the feature contributions and interactions on a more granular level. Also, the color codes can be switched from the SHAP view to highlighting the true and predicted class labels, plus displaying the features.
Furthermore, the GPU explainers provided in the recent SHAP and Captum packages accelerate post-prediction explanation for any cuML or scikit-learn model. For tree-based models like XGBoost, SHAP Explainer can calculate Shapley values on input features. Deep learning models can make use of SHAP GradientExplainer or Captum GradientShap methods for calculating Shapley values by calculating gradients with respect to input features and the features with added Gaussian random noise. Both SHAP and Captum use GPUs to accelerate Shapley value calculations.
A deeper dive into the model
The machine learning-based and visual procedure presented in this post processes the outcomes of another arbitrary AI/ML model. It provides more insight, control and transparency to an already trained, potentially opaque machine-learning model.
It uses a model-agnostic method aiming at identifying the decision-making criteria of an AI system in the form of variable importance (individual input variable contributions) with applications in credit risk assessment and management, as well as in other financial areas like investment portfolio construction.
The key concept is the Shapley value decomposition of a model, a pay-off allocation concept from cooperative game theory. It is so far the only XAI (explainable AI) approach rooted in an economic foundation. It offers a breakdown of variable contributions to the forecast probability, 0 to 1. That means that every data point (for example, a credit or loan customer in a portfolio) is not only represented by input features (the input of the machine learning model), but also by those input feature contributions to the binary prediction of the trained machine learning model, 0 or 1.
The Shapley explanation values can be used for visual mapping based on dimensionality reduction techniques (like PCA, MDS, t-SNE), or for representation learning like clustering and graph analytics (like community detection and network centrality measurements. Those data-driven, learned representations reveal segmentations of data points (customers) where each of those clusters contains similar decision-making criteria, while data points in other clusters exhibit different decision-making criteria.
Hierarchical clustering and especially graph theory and network analytics are well-suited to study complex systems such as the Shapley explanation values of a credit portfolio. Those systems are characterized by emergent, self-organizing properties. The approach treats the variable contribution outcome of a (possibly opaque) AI/ML model as a complex system and further analyses its properties by graph theory and cluster analysis. In this way, you get a better and deeper understanding of what exactly an AI/ML model has learned as the different explanation data points are arranged in groups (clusters) or as a network with specific link structure.
The following phenomena inside the cluster and network structure can be analyzed and understood trends, anomalies, hot spots, emergent effects and tipping points. As the methodology is model-agnostic, it can be applied to any AI/ML model. This also enables a comparison of several models trained on the same data.
In this post, we describe some use case scenarios for the proposed approach based on SHAP Clustering and interactive explainability dashboards:
- Groups or clusters of data points express similar decision making of the AI/ML model.
- Data points at the intersect between clusters point to fuzzy decision making, which can be further investigated.
- A cluster with almost equal amounts of predictions for default and non-default could point to bugs or problems in the machine learning model.
- Customer segmentation: the data points could not only be clustered by their input variables (representing clusters of similarity of the customers) but also by their variable contributions in the decision making.
The target of the proposed explainability model are functions for risk management, assessment and scoring of credit portfolios in traditional banks as well as in ‘fintech’ platforms for P2P lending/crowdfunding.
Guidelines and regulations require model explanations
The Ethics Guidelines drafted by the AI HLEG put forward a human-centric approach on AI and list several key requirements that AI systems should meet to be considered trustworthy.
The proposed SHAP Clustering helps to reduce the explanatory gap of AI. Supervisors adjust their approaches and skills to support the introduction of AI/ML in banking. Banks must be clear about where humans fit in the oversight of the model and give supervisors sound explanations of what their AI/ML systems actually do, as well as to what end.
The decisions must be informed, and there must be a human-in-the-loop oversight. The SHAP Clustering approach enables you to understand why the decision was made. The ‘why’ is not causal but expressed as numeric contributions of input variables. You can look at a specific data point or cluster and see the input variables, the variable’s contributions to the prediction, as well as the prediction itself.
A plausible explanation can arise to reconcile the machine-based decision with a human narrative ‘that makes sense’. The model can be better controlled as it delivers feedback on how it comes to all decisions both on global level (global variable importance) and as local levels (data points).
The clustering step even delivers the variable contributions for the members of that specific cluster, so for a group of customers. You could identify properties of this group of customers based on the input variables to understand how the decision-making works for this group of customers. All these analytic capabilities and tools plus the interactive visual exploration enable you to much better understand the outcome of an entirely black box model. Better understanding leads to more effective control.
To ensure traceability, incorporate a mechanism of documentation to the best possible standard. This includes, among other things, the documentation of data sets used for training and validation of models, the process and outputs of any data labelling, and an unambiguous record of the decisions made by the AI system.
The SHAP Clustering approach enables you to trace back and document the variable contributions to decision making. The clustering of SHAP information is one of the new pieces of information added by the approach so this can be used to enrich the traceability and documentation. Also, you can document the steps to improve the model based on the new information.
For more information about the approach and its use cases, see Financial Risk Management and Explainable, Trustworthy, Responsible AI.
Conclusion
SHAP Clustering delivers an explanation of local, global, and group-level decision making of a machine learning model. The extension presented here allows even further analysis of explanations. This allows practitioners to build a narrative and explanation for machine learning-based decisions to meet business, regulatory, and customer needs.
Perhaps the most important aspect of explainability is the audience. There are many types of people and roles in the audience of a model explanation: model builder, model checker, compliance and governance officer, risk manager, product owner, senior manager, supervisors, customers, and regulators. The raw and clustered SHAP information can be understood by the data science teams, and most other people in a bank or fintech company would understand it with training. The same applies to the supervisors.
For customers and clients, it may be sufficient to mention which variables are most important. The client should probably be informed about the reason for a decision or rejection. You could also mention what a client could do to improve certain variables to get a positive decision. Both of these can also be derived from the SHAP data. The SHAP information delivers a common, consistent, and accurate view and language to describe an AI model.
Further reading
- What is Explainable AI?
- Wells Fargo XAI Blog
- Deep Learning vs Machine Learning Challenger Models for Default Risk with Explainability
- GTC recording: GPU-Accelerated, Explainable Machine Learning for Diversified Portfolio Construction
- GTC recording: AI Trustworthiness Demystified with Finance Sector Examples
- GTC recording: End-to-End Explainable, Accelerated Machine Learning
- GPUTreeSHAP
- XGBoost SHAP
- Medium post on SHAP with XGBoost
- Fast parallel tree interpretability (paper behind GPUTreeSHAP)
- Accelerating Automated and Explainable Machine Learning with RAPIDS and NVIDIA GPUs
- Model Interpretability using RAPIDS Implementation of SHAP on Microsoft Azure
- Research Topic: Explainable, Trustworthy, and Responsible AI for the Financial Service Industry
- Munich Re Markets blog on XAI
- Matrix Evolutions: Synthetic Correlations and Explainable Machine Learning for Constructing Robust Investment Portfolios
- Interpretable Machine Learning for Diversified Portfolio Construction
[1] The project has received funding from the European Union’s Horizon 2020 research and innovation program under grant agreement no. 825215 (topic ICT-35-2018, Type of action: CSA).The content reflects only the author’s view and the Commission is not responsible for any use that may be made of the information it contains.
