
Munich Re is one of the world’s leading providers of reinsurance, primary insurance, and insurance-related risk solutions. Munich Re Markets is helping the global Life and Pension industry to keep their investment management promises, which have become increasingly difficult in a persistent low yield and volatile environment.
The Life and Pension industry offers private households tools to achieve individuals’ financial goals. The goals can be decomposed into somehow opposing sub-goals: increasing and preserving wealth. Dynamic risk adjustment and risk diversification are the key concepts to achieve these goals. The key controllable factor for investors is the diversification of their portfolios.
Munich Re Markets has developed an approach using interpretable machine learning – sometimes also called ‘Explainable AI’ (XAI) – to analyze the robustness of diversification resulting from various portfolio allocation methods. The code can be downloaded here.
So far, machine learning concepts show rather mixed results when used for asset price prediction. The tendency of overfitting models is high here. However, applying machine learning as an analytical and quality assurance tool seems to be a more fruitful approach.
The team’s approach provides deeper insights into where the differences between allocation methods come from and helps them to quickly identify situations where certain methods perform better than others. Interpretable machine learning enables them to get a better understanding of the complex market interactions and their impact.
With this knowledge, the team can construct robust investment strategies for the challenging goal of saving for old age. Investment products benefit from this robust, fast, and intelligent valuation approach, which we outline below. The work has recently been published in the Journal of Financial Data Science as “Interpretable Machine Learning for Diversified Portfolio Construction”. Here is the PDF download and the booklet.
The team usually builds customized product concepts together with primary insurance companies. This usually includes the design of an appropriate financial index or an investment fund. An essential component of portfolio construction is the allocation method. There is an almost infinite number of ways for distributing one’s capital to the considered assets, but which allocation is now the best solution for a given investment universe?
For decades, there has been significant research on portfolio allocation. However, it is quite surprising that there exists no clear guidance on when to use which allocation method although the allocation method can have a large impact on performance. The team has changed this with their AI-based approach.
The use case is based on a typical multi-asset portfolio consisting of 17 future markets over 20 years for different allocation methods. The calculated index is then scaled to target volatility of 5%. The presented use case focuses on two allocation methods: Equal Risk Contribution (ERC) and Hierarchical Risk Parity (HRP).
The weights for ERC are defined such that all assets contribute the same risk to the portfolio. The concept is reflecting the correlation between all assets, but it is also at risk of shifts in this correlation structure. The reason for this vulnerability is the use of quadratic optimization, which is sensitive to noise.
HRP is a very modern allocation concept based on the research of Marcos Lopez de Prado published in the Journal of Portfolio Management. It tends to be more robust towards changes in the correlation structure, due to its construction.
In the first step of our workflow, Munich Re Markets generates sample market data to measure the outperformance of HRP compared to ERC. A block bootstrap methodology is used to preserve the correlation structures and generate 100,000 scenarios. The next step is to reveal the connection between the properties of those scenarios and the outperformance by using machine learning. In other words, the program is supposed to learn in which scenarios we see an outperformance of HRP compared to ERC and what the specific properties of those scenarios are. This is very important as the program reveals in which market regimes/states it would be advantageous to select HRP as the allocation method. This is because HRP often is the better choice–but not always. The interpretable machine learning helps to characterize those scenarios and to identify where HRP dominates and why. This is the first time a machine systematically helps to uncover this kind of information.
The properties of the scenarios are characterized by several dozen statistical features. They are the statistical fingerprints of the scenarios. An XGBoost model is successfully trained on the data using a hyperparameter optimization method. Then the local and global feature importance metrics, as well as feature interactions, are extracted by a post-hoc modeling approach using the SHAP method, solving the cooperative game theory approach by high-performance computing.
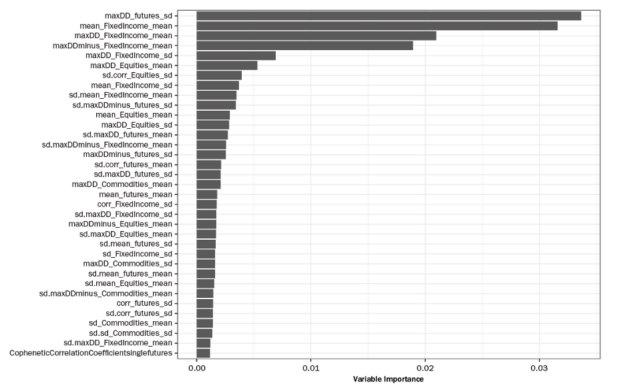
The following figure shows the global feature importance extracted from the trained model. The top the 2 features are:
- maxDD_futures_sd (the standard deviation of the maximum Drawdown across all Futures).
- mean_FixedIncome_mean (the mean of the asset level mean returns across the Fixed Income Futures).
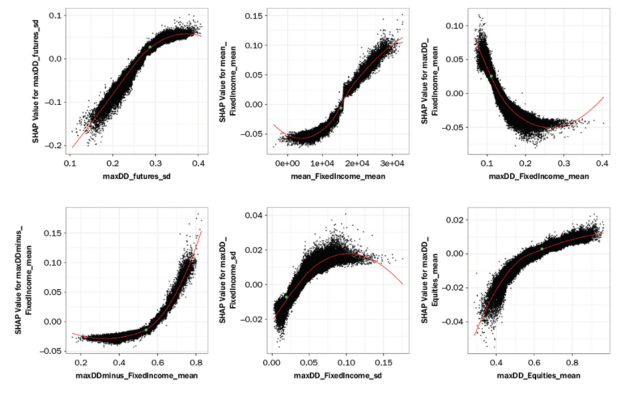
And the following figure shows some SHAP values as a function of feature values for the most important variables. It can be seen there are complex relationships that only an ML/AI model is able to represent – in contrast to a simple regression model.
The approach helps to test hypotheses and to better understand what the actual relevant characteristics of a portfolio are, and what factors drive the performance quality of the portfolio, enabling a more robust and smarter asset allocation. However, up to this point, the computation time for 100,000 scenarios is about 3 days on regular computing infrastructure. This long computation time inhibits the method from being used in a day-to-day business environment.
Working with NVIDIA, the Munich Re Markets started to rebuild their models using GPU acceleration. This resulted in a timely boost of more than 800x, coming down from >4,000 minutes to less than 5 minutes, which qualifies to use the approach in the daily investment analysis toolkit of the Munich Re Markets team.
The following infrastructure and software were used to accelerate the end-to-end workflow on the GPU:
- Four V100 32GB GPUs in a DGX station.
- Numba, Cupy, and RAPIDS.
- The workflow computation can be scaled up linearly in a Dask GPU cluster environment.
This research provides clients with a more robust, faster, and smarter asset allocation that offers a comparatively sustainable growth perspective, especially with a long-term investment horizon.
The results can be applied in a broad context of portfolio management, and the logic can be extended to many other research questions. It is about understanding complex relationships that usually remain hidden and which are difficult to access with standard statistical models. The interpretable machine learning model provides help.
The entire approach has been presented by the Munich Re Markets team at GTC21. The video can be seen here. The teams have further extended the approaches in several directions as we describe in the following.
Matrix evolutions – The AI-based wind tunnel for financial market scenarios
In the previously described workflow, we used a simple block-bootstrap method to generate the market scenarios with correlated assets. The method is effective, but it is not possible to generate really new or adverse scenarios that have not yet been observed before. An AI approach is needed for that.
The team designed a new approach here using evolutionary algorithms to generate correlated market scenarios. Recently published in the Journal of Financial Data Science, it is a novel and highly flexible concept to simulate correlation matrixes of financial markets. Here is the PDF download and here is the booklet.
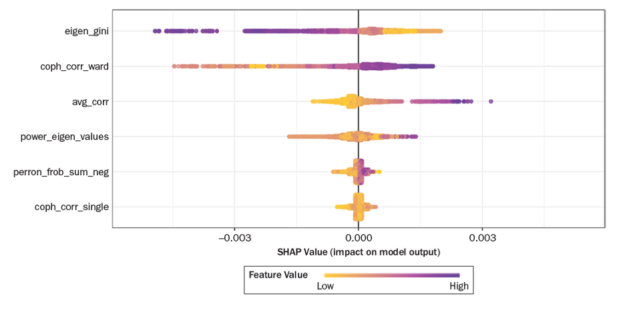
In this publication the team combines the previously described workflow for Explainable AI with the generation of synthetic matrixes. The following figure shows the SHAP values for each feature of the synthetic data set. The features are typical stylized facts of empirical asset return correlation matrixes, average correlation shifted to the positive, power law in Eigen values, hierarchical structure.
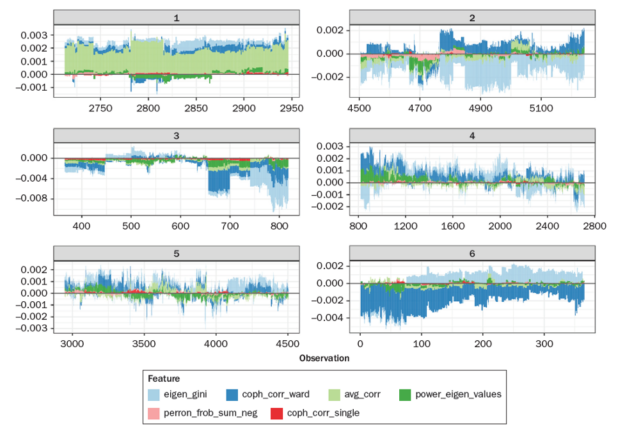
The following figure shows the force plot of the feature contributions (SHAP values) after splitting the entire data set into 6 groups by means of SHAP similarity clustering. Each group contains those data points that exhibit very similar SHAP distributions. In this way the user can better understand what the ML model has learned and if it is plausible.
The synthetic data approach is useful for backtesting and developing correlation-dependent investment strategies as well as financial products. With the help of Matrix Evolutions, it is possible to synthetically generate scenarios that seem real, but have not yet been observed before with the option to define the boundaries of the scenarios and thus also creating extreme stress-test-like outcomes. The approach is also embarrassingly parallel and thus suited for an end-to-end GPU-accelerated backtesting.
The explainability of the model can be further enhanced by the synthetic data. That way the assessment of how robust an investment strategy is can be based on an even stronger fundament. Being consistent with the Monte Carlo backtesting paradigm, testing against synthetic datasets should be the preferred approach for developing tactical investment algorithms. Having an answer to specific market states and data generating processes based on an explanatory model is key.
Another extension is directed at different variants of the classical HRP approach and introduces an adaptive procedure to account for structural breaks with different matrix representations. The new taxonomy of HRP variants is called Adaptive Seriational Risk Parity (ASRP), and will soon be published in the Journal of Financial Data Science, too. A preprint can be found here. A related preprint analyzes the questions if ASRP can tame crypto portfolios.
The Matrix Evolutions and XAI approaches allow deeper analysis of the scenarios in which those ASRP variants outperform the classical HRP or other risk-based approaches to portfolio construction. Combining all the papers, the team has created a new framework for generating more robust and transparent investment approaches. GPU-accelerated Python and the RAPIDS suite enable an enterprise-level application of the entire workflow.
The application is currently enhanced by further processing the SHAP explanation values as clusters and networks to learn more about the groups and graph structures in the domain of feature importance. This analysis goes beyond the usual local or global analysis of feature importance. The clusters represent similar model decisions and link them to data scenarios. A range of advanced analytical procedures is enabled in order to better comprehend and validate the AI/ML model.
The idea of clustering SHAP values is based on the most successful AI use case in the EU Horizon project FIN-TECH, published as Explainable Machine Learning in Credit Risk Management. It has been extended to a large and more realistic data set as described in this NVIDIA Blog (to come). It is also linked to this NVIDIA blog: Explaining and Accelerating Machine Learning for Loan Delinquencies.
How to get engaged
The code can be downloaded here. Feel free to contact our project leader for more information and to engage in further collaborative developments of the use case. There is a GAIA-X project in the Finance & Insurance Data Space called Financial AI Cluster (FAIC), dedicated to implementing Trustworthy, Explainable AI in many areas in finance, like investment management. Some parts of the presented approaches are being further developed here and made accessible to a wider audience. Please contact us to join this project.
Also, we started a special research topic on ‘Applications of Generative Adversarial Models in Financial Markets’ in this open-access journal: https://www.frontiersin.org/research-topics/22323/applications-of-generative-adversarial-models-in-financial-markets
