
Recently, a user came to us in the forums. They sent a screenshot of a profiling result using NVIDIA Nsight Systems on a PyTorch program. A single launch of an element-wise operation gave way to questions about the overheads and latencies in CUDA code, and how they are visualized with the Nsight Systems GUI. This seemed like a question for which a lot of people could use an answer.
Some definitions
First, here are some definitions of latency and overhead regarding CUDA. It’s a complicated topic.
Latency
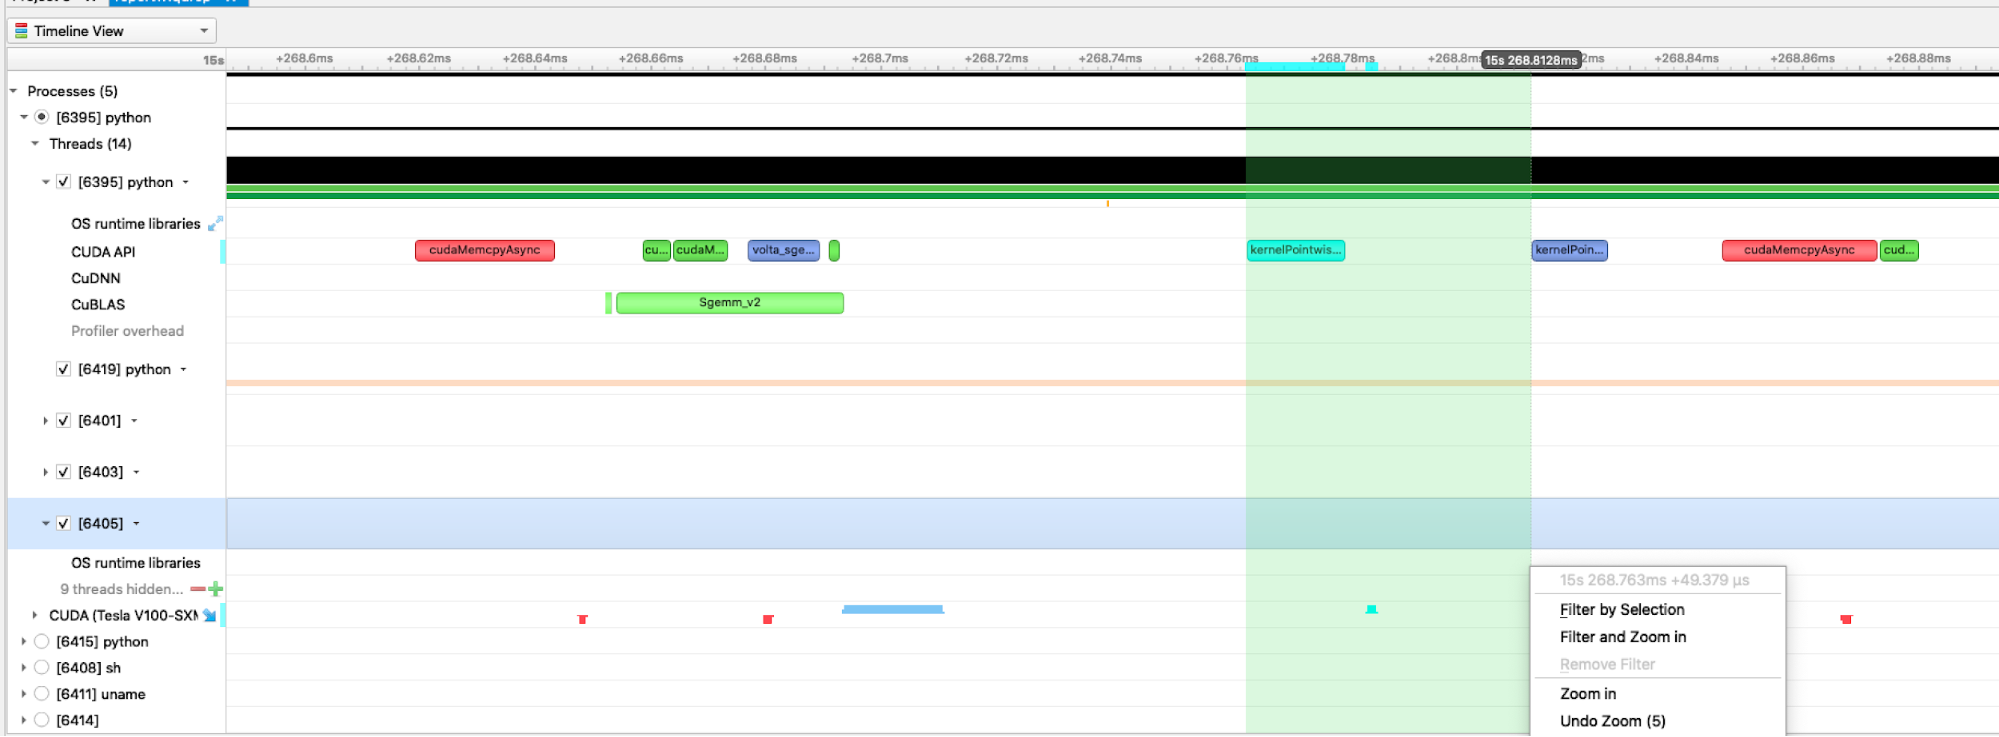
There are two common definitions of latency. Launch latency, sometimes called induction time, is the time between requesting an asynchronous task and beginning to execute it. For example, CUDA kernel launch latency could be defined as the time range from the beginning of the launch API call to the beginning of the kernel execution. There are about 20 µs of launch latency in Figure 1 between the beginning of the launch call (in the CUDA API row) and the beginning of the kernel execution (in the CUDA Tesla V100-SXM row). This definition includes the time of the launch API call.
Task latency, or total time, is the time between adding a task to the queue and the task finishing. In this post, we mostly talk about launch latency.
Latency is not always bad in asynchronous systems. Imagine that you make 10 short API calls to launch a dependent sequence of 10 large kernels. You’d expect minimal latency from the first API call to the first kernel execution. But the 10th kernel in the sequence might have a large launch latency by this definition, because the CPU enqueued the 10 launch commands and returned quickly, while the GPU has to complete the first nine kernels before it can start the 10th. The long gap between the 10th API call and the 10th launch would be a high latency, but an intentional one.
The point of using asynchronous launches from the CPU is to allow the CPU to send commands to the GPU and then perform other tasks while the GPU executes the commands.
Overhead
We define overhead as the time it takes to perform some operation that you’d ideally want to take zero time, and this ends up limiting the rate at which you can do that operation. It is time spent (latency) with no useful kernel work done. For example, consider the overhead of the CPU code for launching a CUDA kernel. If the launch API call takes 10 µs on your system, you can only launch at most 100,000 kernels per second.
Here are definitions for a couple of kinds of overhead: CPU wrapper, memory, and GPU launch overhead.
CPU wrapper overhead
This is the overhead of the wrappers around a CUDA kernel on the host CPU side. In the Nsight Systems GUI, you would see this as the full duration of the kernel launch API call (the blue ranges on the CUDA API row in Figure 1). This includes any mutex-lock contention that occurs in the driver if doing multi-threaded launching. You can see if you are hitting mutex contention within the driver by collecting OS Runtime data, which shows any pthread_mutex_lock calls lasting above a user-settable threshold.
Nsight Systems adds a bit of overhead to capture trace data. Events may appear longer in the timeline than they would take when the app runs without the tool. If the events being traced by Nsight Systems are relatively short in duration (a few microseconds or less) and occur frequently in the workload, Nsight System’s overhead seems higher due to the fixed cost of tracing an event.
Memory overhead
This is the overhead of moving data back and forth from the CPU to the GPU, or from one GPU to another. For example, this would be the time it takes to read the input tensors and writing output to DRAM. It is shown as the time range from the API call to enqueue the commands to copy the input data to the GPU’s memory until the copy is finished.
The memory overhead can be hidden with kernel launches, because the GPU can simultaneously be executing a kernel while uploading the input data for the next kernel and downloading the output from the previous kernel.
GPU launch overhead
This is the time it takes for the GPU to retrieve the command and begin executing it. Examples include:
- The GPU may have a different context active and require a context switch to get back to working on your application, for example, if it is rendering the PC’s desktop. You can see if you are hitting context switch delays by collecting
GPU Context Switchdata. The context switch timeline row is green when your context is active and other colors when it’s not. - The GPU may be blocked if it previously had a command to wait for outstanding work to complete.
- CUDA provides streams that allow the user to asynchronously launch a sequence of kernels and
memcpysthat must be executed in order. The GPU automatically waits for the prior item in a stream to complete before starting the next one. - The GPU may need to finish higher-priority kernels before it can start a lower-priority kernel.
Understanding overhead and latency in the timeline
Now that we have defined the terminology, here’s a deeper look at some Nsight Systems timelines. We discuss how to interpret what is shown.
Lifecycle of a kernel
Using the Nsight Systems GUI, you can trace the events that happen during the lifetime of a kernel.
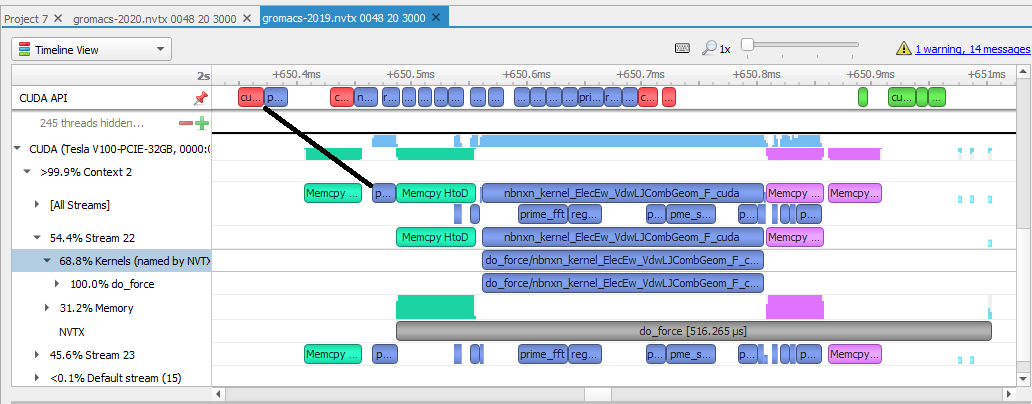
- CPU events: Look at the earlier example from an analysis of GROMACS 2019 (Figure 2). The line labeled CUDA API contains the CUDA calls on the CPU relevant to a kernel execution. Events in red are memory transfer calls from the CPU. Those in blue are calls to launch CUDA kernels, those in green are CUDA synchronization calls.
- GPU events: The lines below the CUDA label on the left side represent events happening on this GPU. Events in green represent memory copied down from the host to the device. Events in blue are actual kernel work. Events in pink are memory transfers back up from the device to the host. The grey bar is the NVTX annotation range that the user created in their code, projected onto the time spent running on the GPU.
- Launch latency: This is the time between the start of the call for work and when it starts executing. In this view, it’s the time between the start of the CPU first blue box and the end of the GPU first blue box, as shown by the black line in the example. The total latency is between the call for work and when all the work is done and returned after the
memcpyto the host is complete. The overhead is seen in the gaps in the timeline.
CPU gaps
You can find an example of a gap on the CPU timeline when profiling the vectorAdd CUDA Toolkit example.
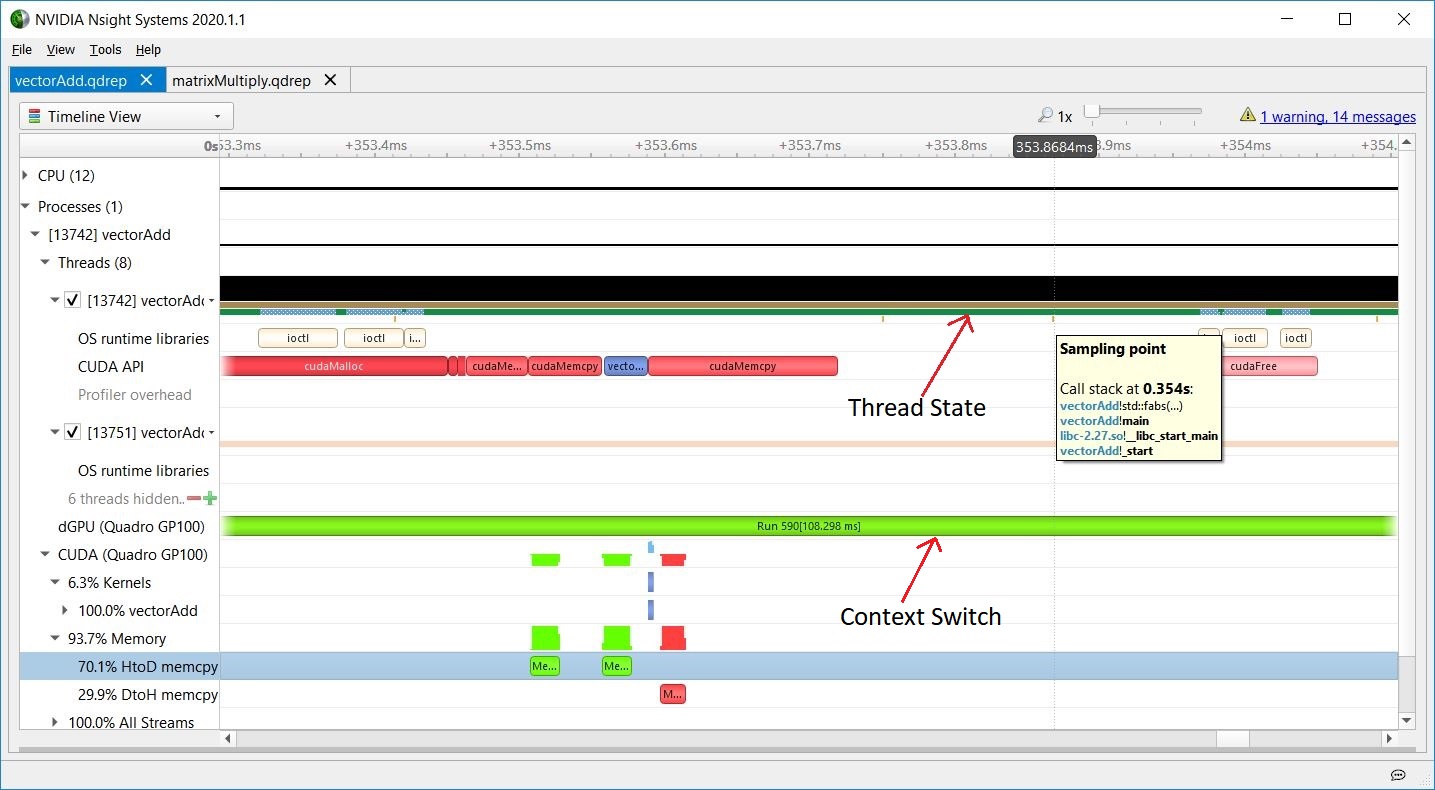
Just above the CUDA API timeline, the thread’s state indicates that it is busy, so the CPU is executing some other operations. In Nsight Systems, CPU sampling, OS Runtime, API tracing, or adding NVTX instrumentation and tracing NVTX can help you figure out what the CPU is doing between CUDA API calls. To learn more about NVIDIA Tools Extension (NVTX) API, see CUDA Pro Tip: Generate Custom Application Profile Timelines with NVTX.
On the GPU timeline, the GPU might be executing another context (it might have context-switched), or it might be idle while it waits for more work to be scheduled.
Sampling data was also collected, as you can see by the orange/yellow marks below the thread state timeline. Each mark represents the point when a CPU IP/backtrace sample was collected. When this screenshot was captured, the mouse (not shown) was hovering on the sampling mark just above the left side of the tooltip. The tooltip shows the CPU IP/backtrace for that thread at that moment. Looking at the vectorAdd source code, you can easily see the application was checking the results of the GPU’s calculation.
GPU context switching
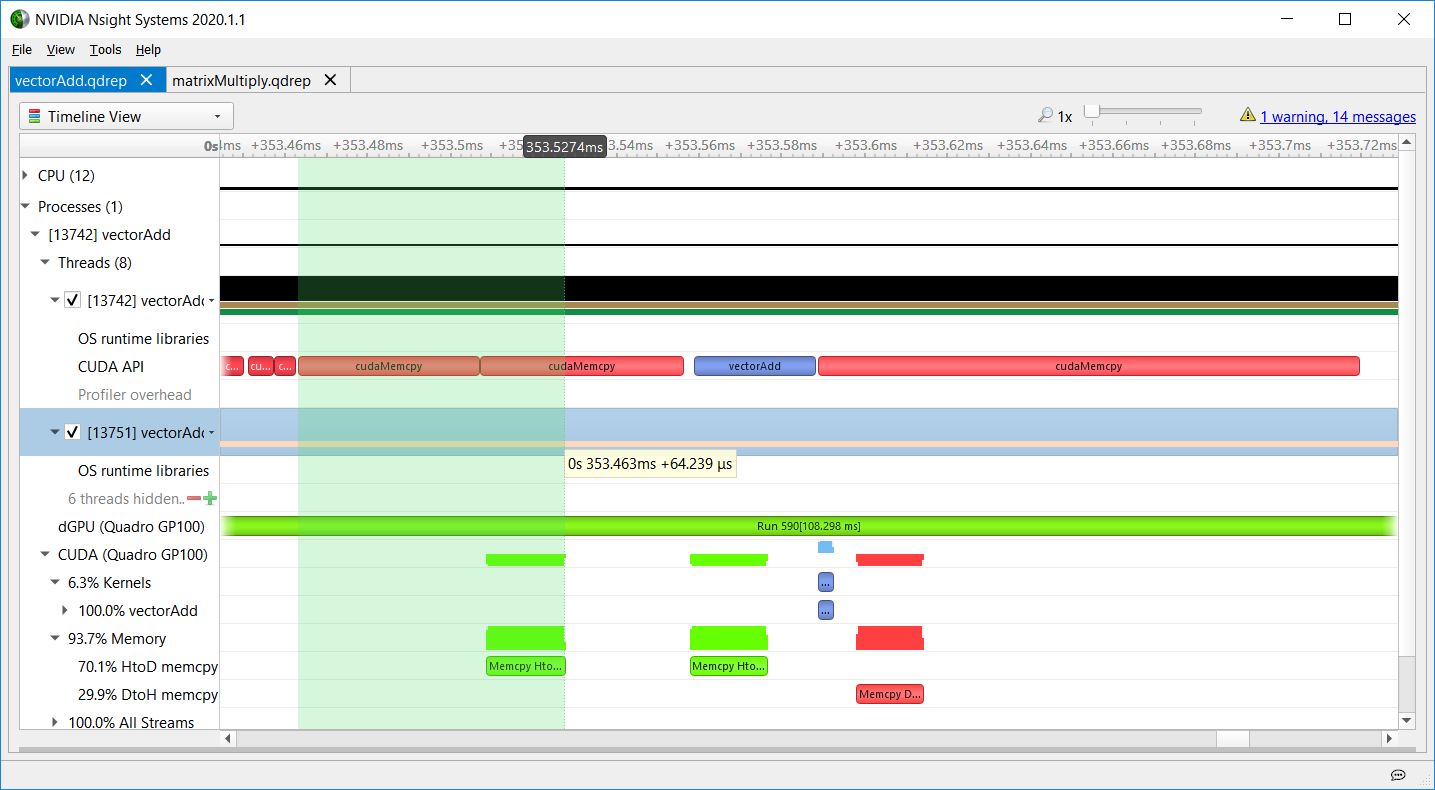
The following figures are screenshots of the Nsight Systems timeline showing the important part of the vectorAdd CUDA Toolkit sample. The dGPU (Quadro GP100) row shows GPU context switching. During this time, the consistently green Run range indicates that the GPU did not switch away from vectorAdd’s context.
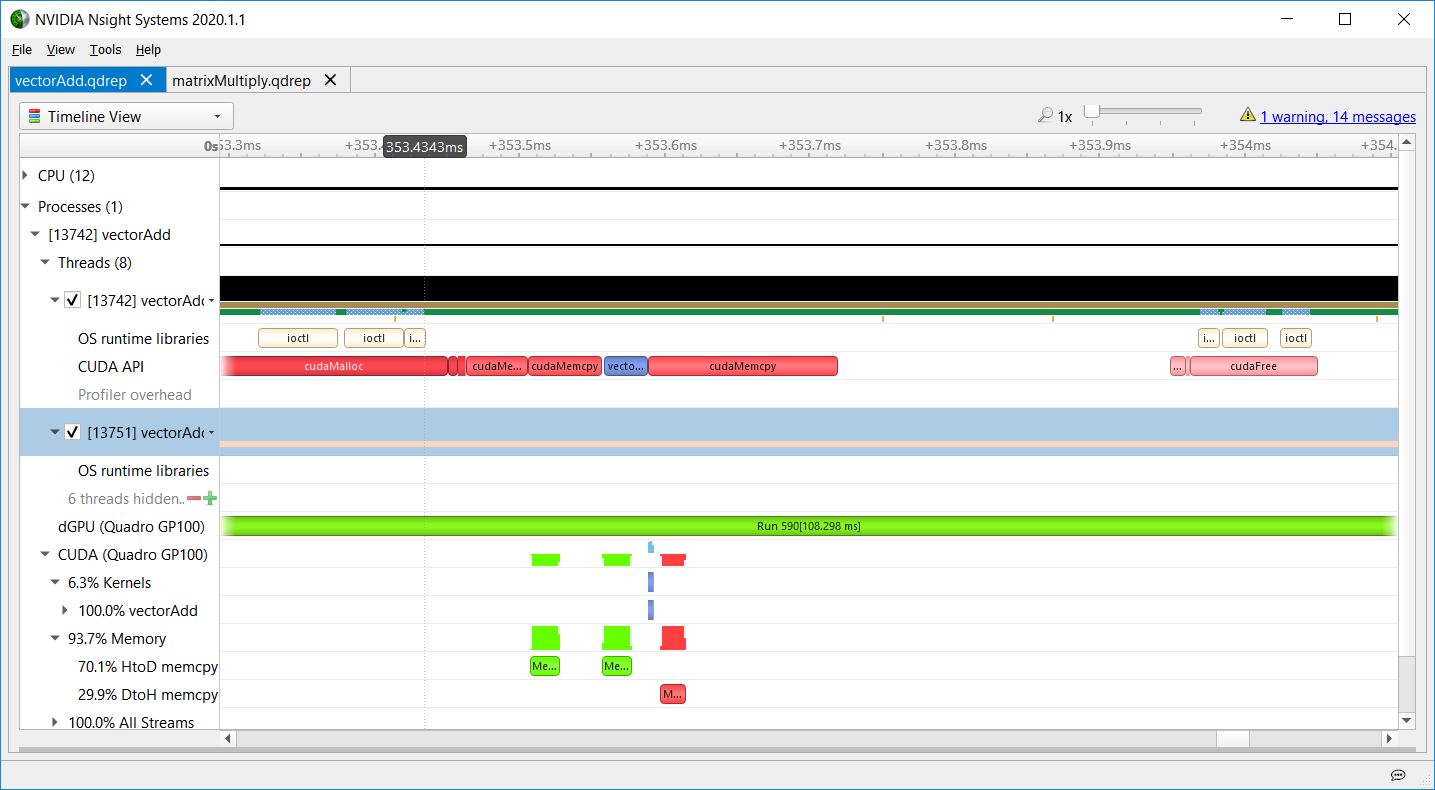
Host to device memory overhead
Figure 5 shows HtoD memory overhead in vectorAdd. Even though the cudaMemcpy API was used, this was an asynchronous HtoD copy from pageable memory because the CPU function returns before the GPU work completes. Using asynchronous copy operations and overlapping kernel launches with copies allows you to hide the latency of the copies. Latency hiding is an important technique in GPU programming. For more information about CUDA memcpy behavior, see API synchronization behavior.
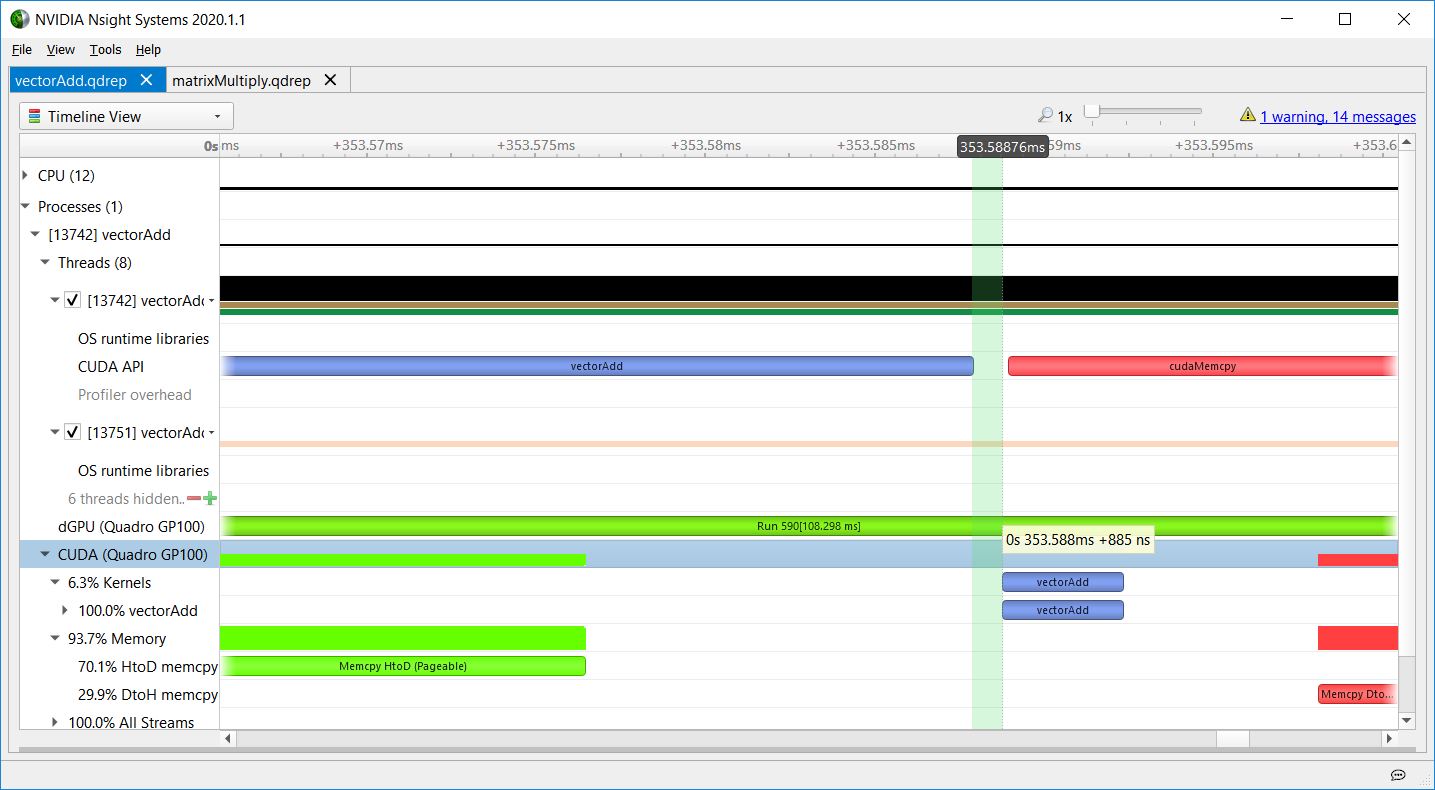
Nsight Systems overhead
Figure 6 shows the gap between the kernel launch API and the execution of the kernel on the GPU to highlight Nsight Systems overhead, typically less than a microsecond, as seen in this screenshot. It also shows that, in this case, the GPU takes about a microsecond to begin executing the kernel after the launch API call has finished.
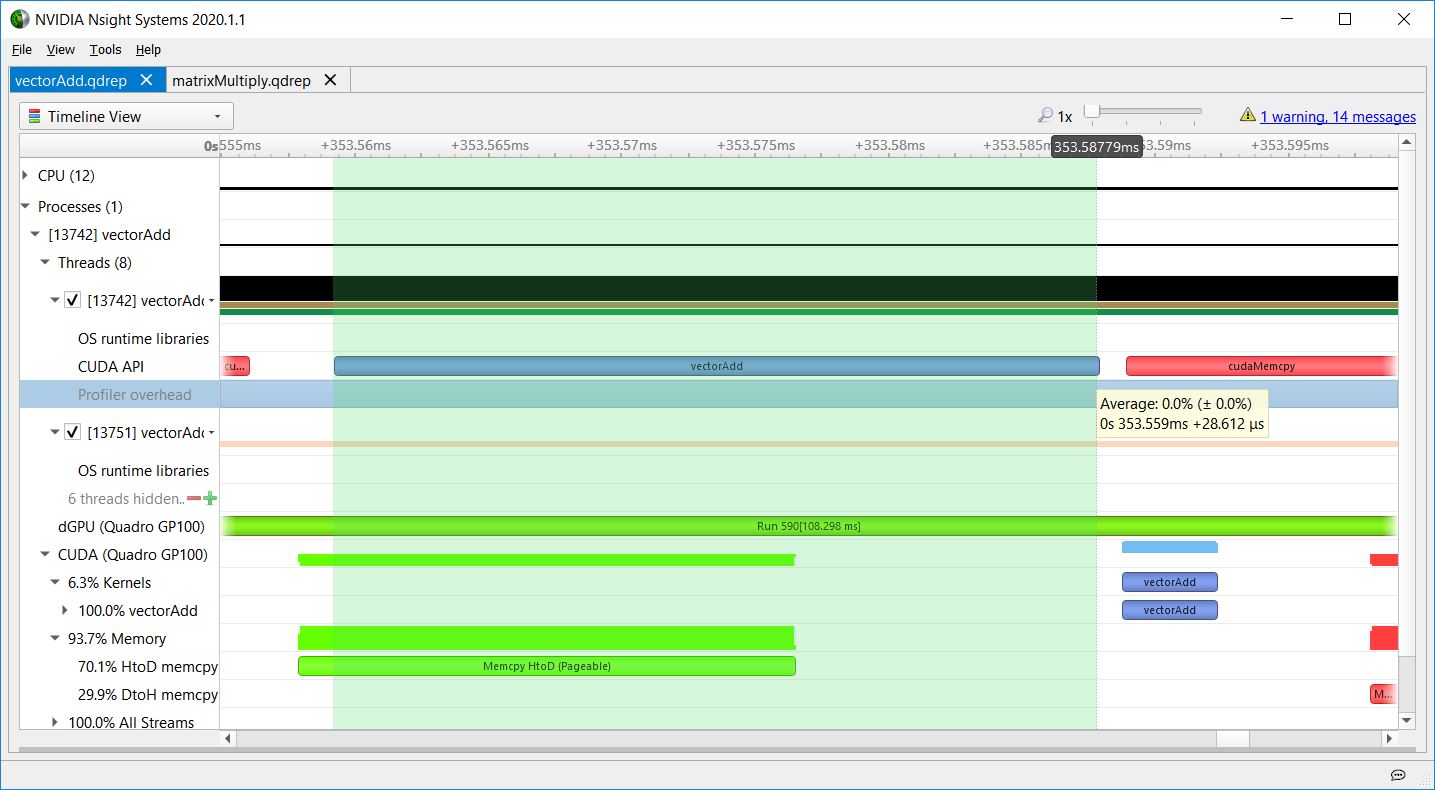
CPU overhead
Figure 7 shows the CPU overhead, for the full duration of the launch API call.
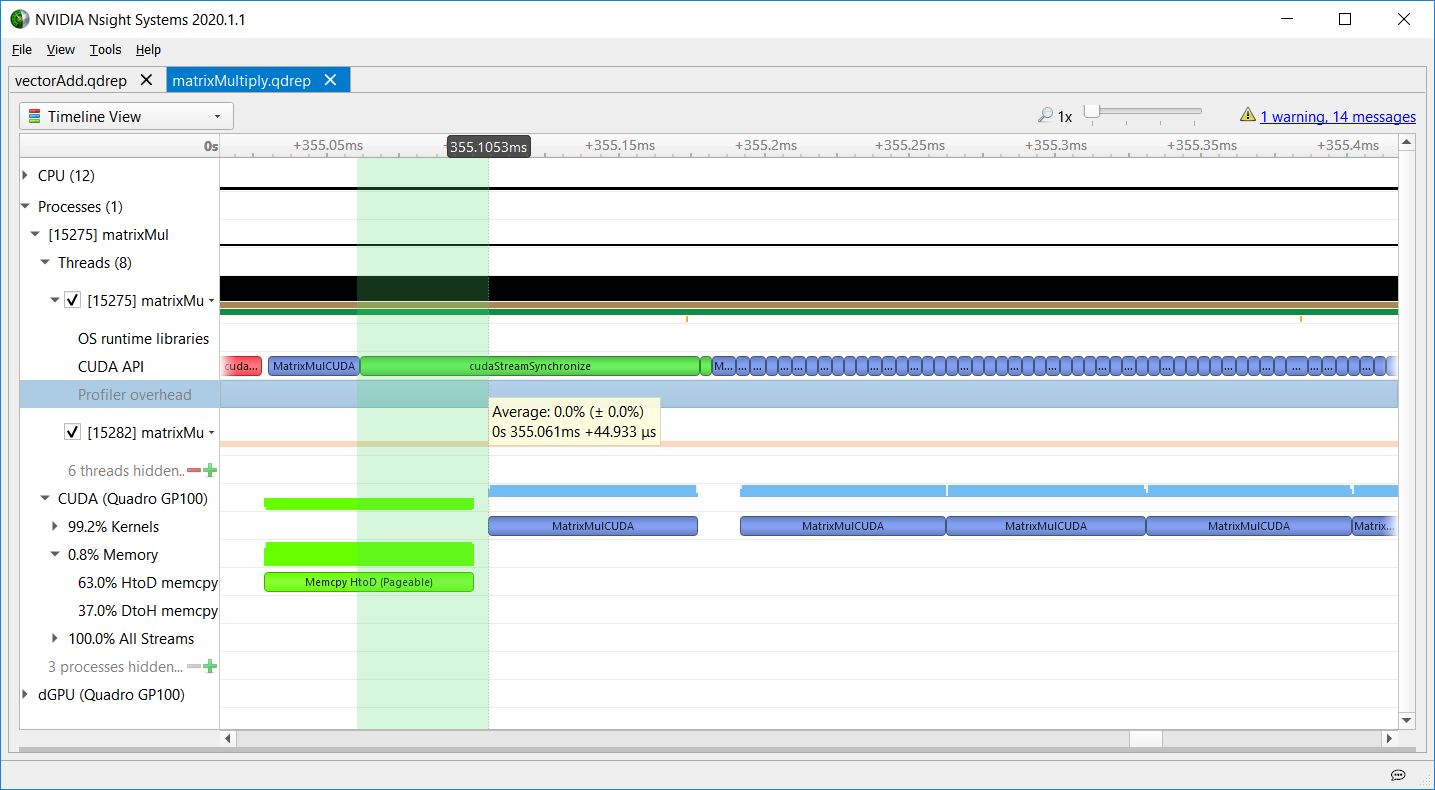
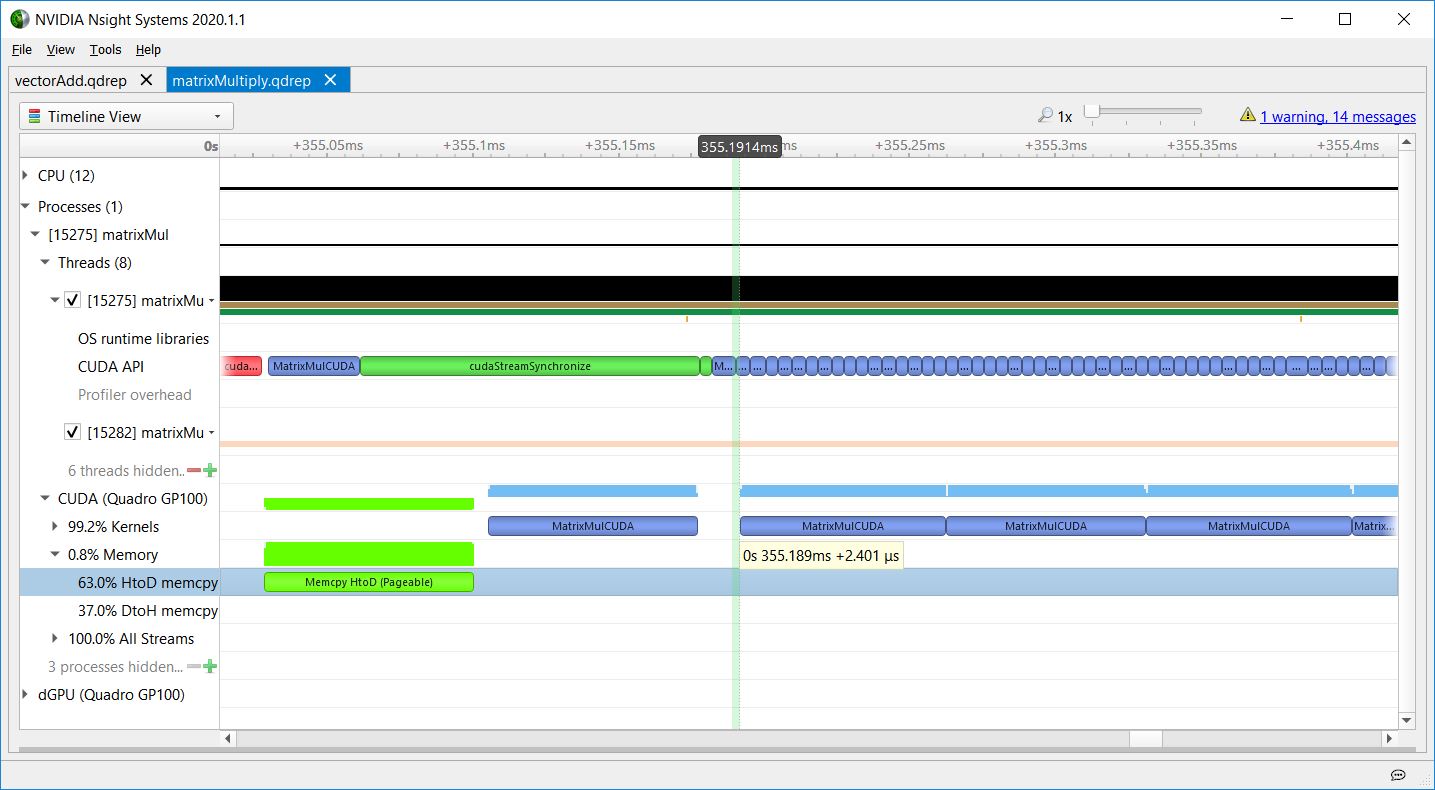
Stream synchronization
Figure 8 shows the matrixMul CUDA toolkit sample, where the CPU enqueues a memcpy (in red) and kernel (in blue) into a stream, and then calls cudaStreamSynchronize (in green) to block until the enqueued work in that stream completes. The kernel launch latency here is due to the GPU having to execute the stream tasks in order, so the kernel execution doesn’t begin until the preceding memcpy finishes. The long call to cudaStreamSynchronize shows the CPU waiting for the GPU work to complete. The CPU could have done other work before calling cudaStreamSynchronize, enabling the CPU and GPU to execute in parallel.
Launch latency
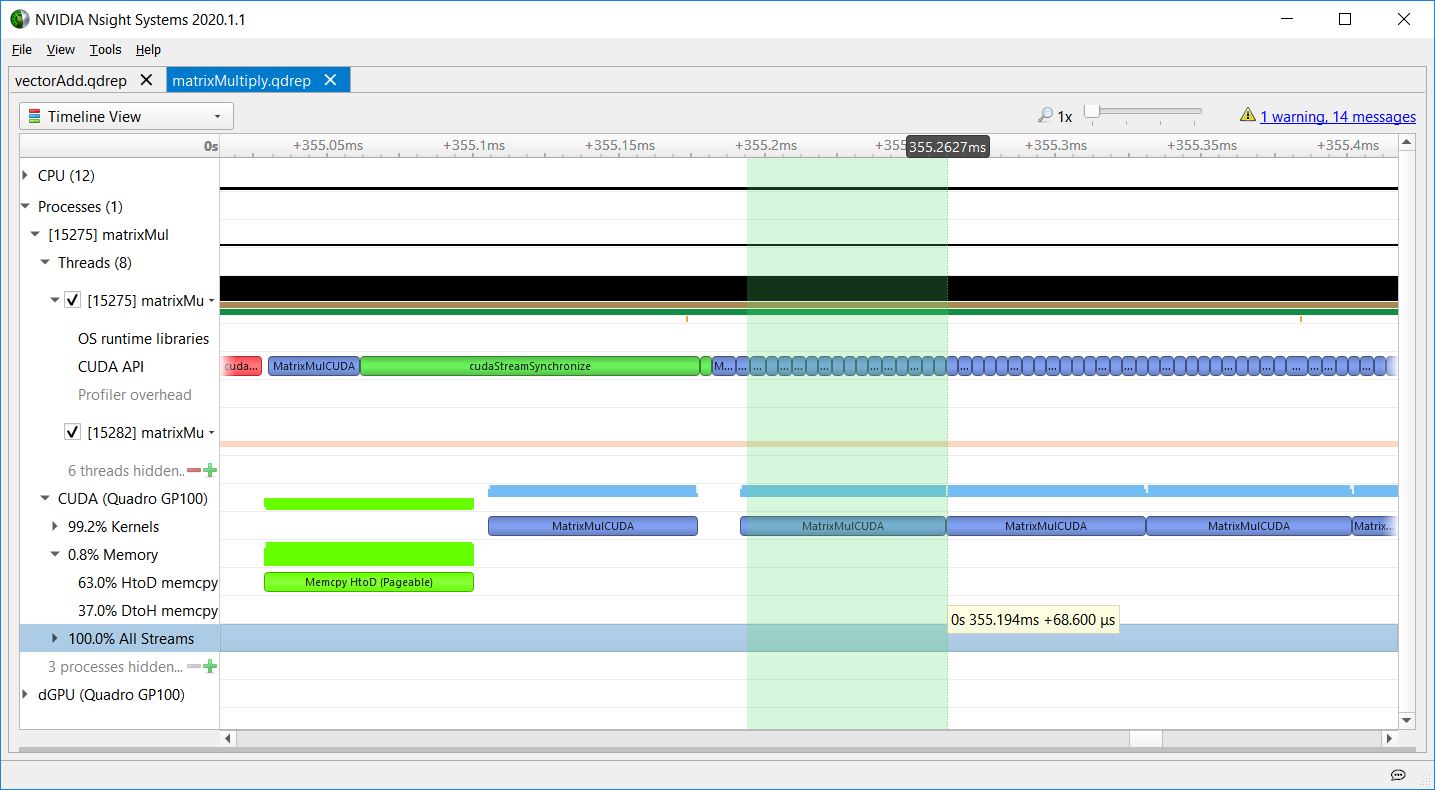
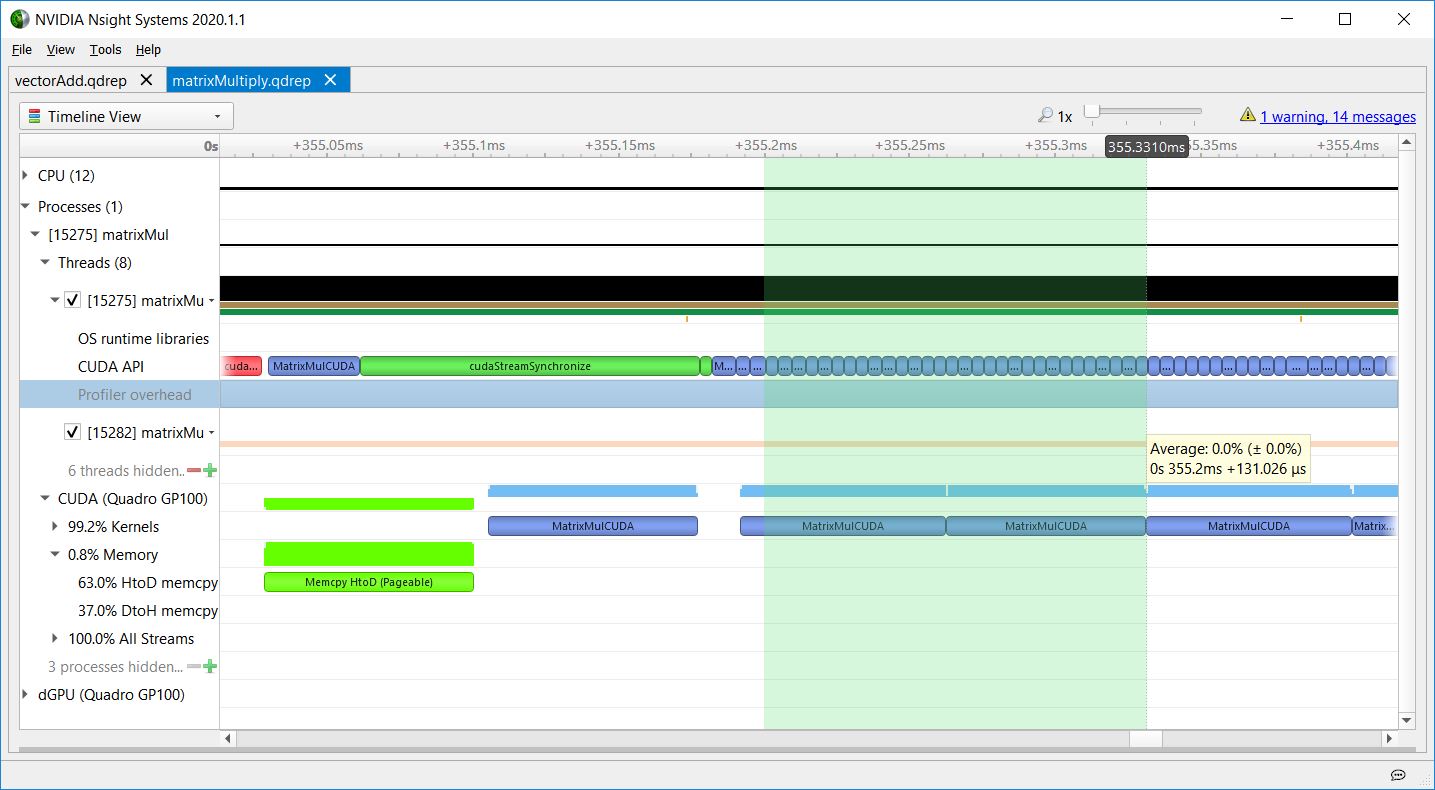
Regarding the kernel launch latency, matrixMul also shows the CPU launching a sequence of kernels asynchronously without waiting for them, and the GPU executing them in order. Figures 9-11 show how the kernel launch latency increases for each launch, because the CPU API calls are short, and the GPU kernel executions are longer.
This increasing kernel launch latency does not indicate inefficiency. It shows the CPU getting ahead of the GPU, so that the CPU is free to do other tasks while the GPU executes work in the queue. These figures show that matrixMul is doing a good job of keeping work queued up for the GPU, as there are no gaps in GPU work for that part of the timeline.
The first challenge of GPU programming is avoiding CPU bottlenecks and keeping the GPU busy—you want the GPU to be the bottleneck. When you have optimized the CPU part of your program to where Nsight Systems shows that the GPU is the bottleneck, it’s time to use NVIDIA Nsight Compute to profile individual kernels and investigate how to make them more efficient. Or, you could use faster or more GPUs to make the GPU part of the program execute faster.
Want to know what proportion of the total duration of the kernel was due to what work? Nsight Systems is just the tool for seeing when events start and end on a timeline. All the work done by the kernel—that is, arithmetic and memory access instructions—occur within the blue bar. To understand what is happening inside the kernel, use NVIDIA Nsight Compute. That tool isolates individual kernels and does deep-dive analysis on them. It takes longer to run, but you get more detailed information.
Call to action
Get NVIDIA Nsight Systems and NVIDIA Nsight Compute from the NVIDIA CUDA ToolKit public download. You can also obtain the most recent, updated Nsight tools with enhancements and fixes beyond the version shipping in the NVIDIA CUDA Toolkit at the Nsight Systems, Nsight Compute, or Nsight Graphics pages.
Want more information?
This post is part of a series that describes the new Nsight family of tools, shows the functionality, and explains how to move your development to the new tools. Check the NVIDIA Technical Blog for additional posts covering related topics.
Previous entries:
- Migrating to NVIDIA Nsight Tools from NVVP and Nvprof
- Transitioning to Nsight Systems from NVIDIA Visual Profiler / nvprof
- Using Nsight Compute to Inspect your Kernels
- Using NVIDIA Nsight Systems in Containers and the Cloud
- Using NVIDIA Nsight Compute in Containers
- Unleashing the Power of NVIDIA Ampere Architecture with NVIDIA Nsight Developer Tools
To see the tools in action, check out the following links featuring videos from recent GTCs:
NVIDIA Nsight Systems
- Blue Waters Webinar Series – Nov. 2018 – Introduction to NVIDIA Nsight Systems
- Optimizing HPC Simulation and Visualization Codes Using the NVIDIA Nsight Systems
- Using Nsight Tools to Optimize the NAMD Molecular Dynamic Simulation Program
- Optimizing Facebook AI Workloads for NVIDIA GPUs
- Boost DNN Training Performance using NVIDIA Tools
- GTC 2020: Rebalancing the Load: Profile-Guided Optimization of the NAMD Molecular Dynamics Program for Modern GPUs using Nsight Systems
- GTC 2020: Scaling the Transformer Model Implementation in PyTorch Across Multiple Nodes
NVIDIA Nsight Compute
- OptiX profiling with Nsight Compute
- CUDA Kernel Profiling Using NVIDIA Nsight Compute
- Using Nsight Compute or Nvprof to Show Mixed Precision Use in Deep Learning Models
- GTC 2020: Optimizing CUDA Kernels in HPC Simulation and Visualization Codes Using NVIDIA Nsight Compute
NVIDIA Nsight Graphics
We’ve also covered NVIDIA Nsight tools in older posts, including Nsight Systems Exposes New GPU Optimization Opportunities and https://devtalk.nvidia.com/.
Have a question?
Post it to the NVIDIA forums using either NVIDIA Nsight Systems or NVIDIA Nsight Compute. Drop a message at nsight-systems-feedback@nvidia.com or nsight-compute-feedback@nvidia.com. Or just choose Feedback in the application to let us know what you are seeing and what you think.
