
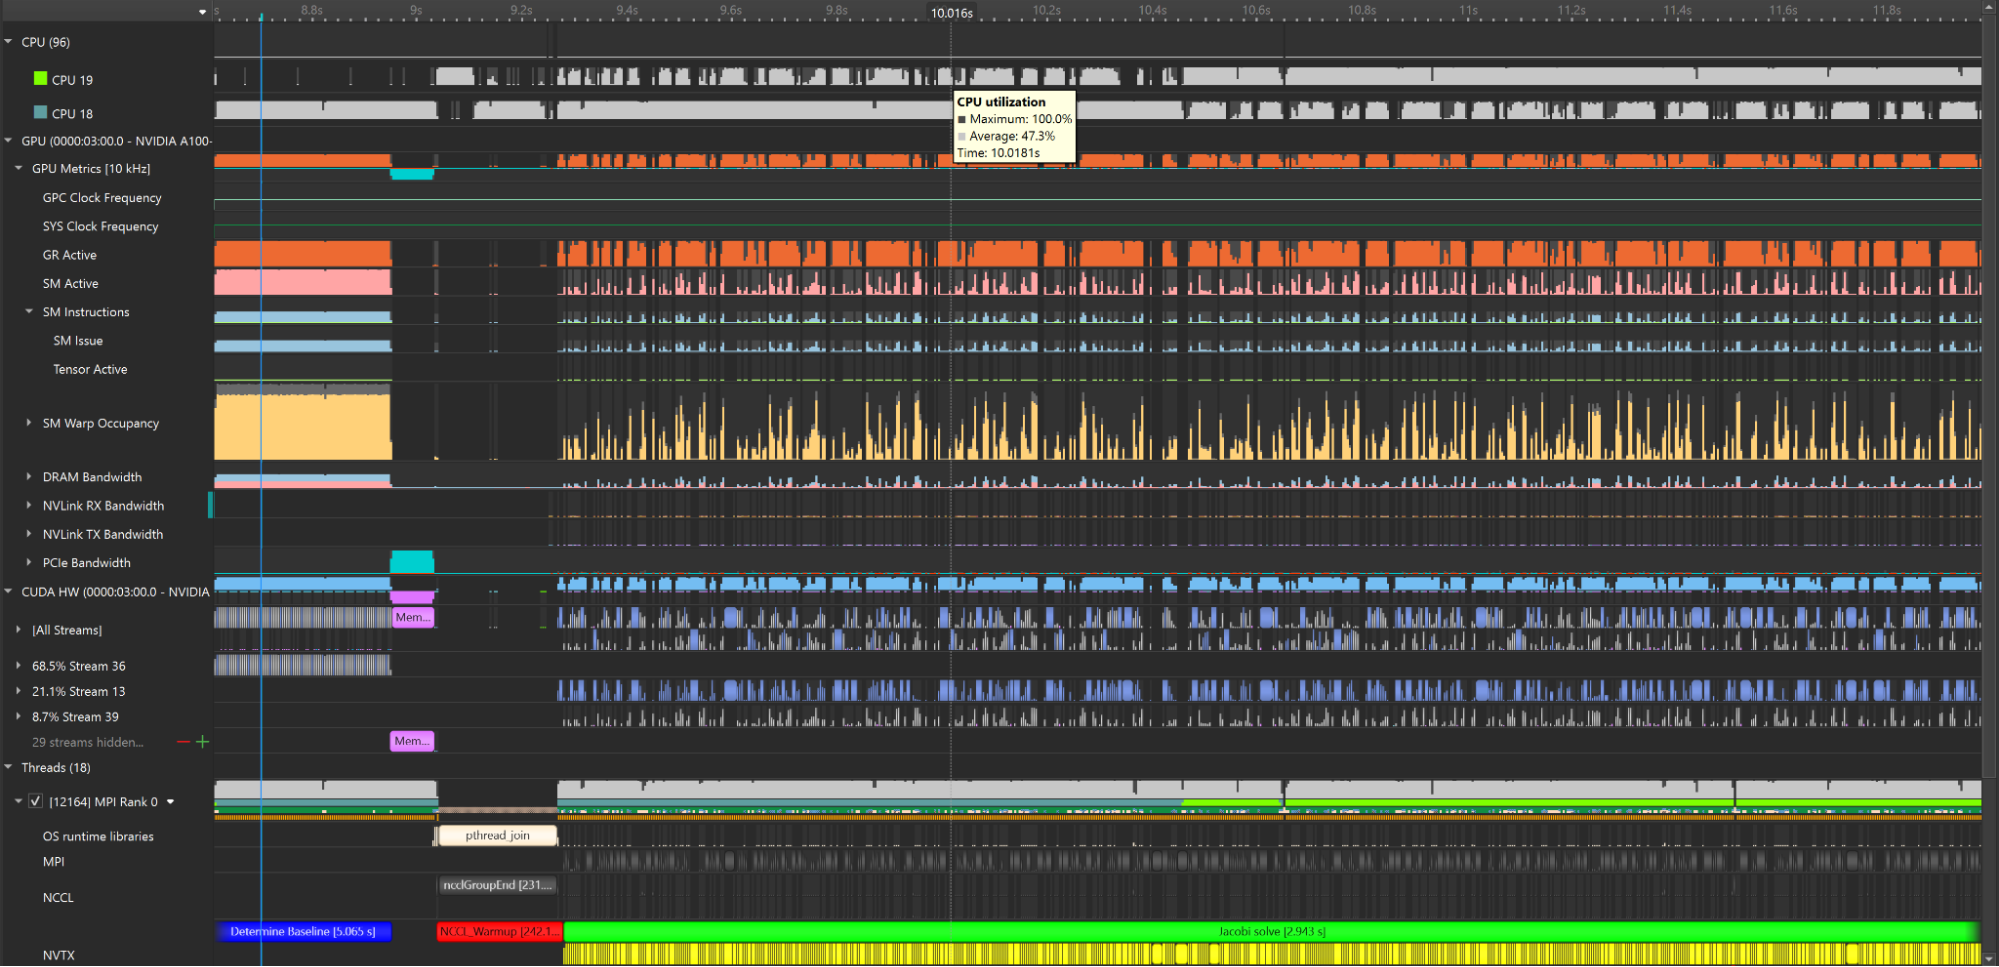
As the GPU launches threads, dispatches kernels, and loads from memory, the CPU feeds it data asynchronously, accesses network communications, manages system resources, and more. This is just a snippet of hardware activity needed to run an application—an orchestra of different components operating in perfect parallelism. As a developer, you are the conductor of an orchestra of hardware, aiming to harmonize for peak performance.
NVIDIA Nsight Systems is a system-wide profiling tool that helps tune your hardware orchestra. It enables application developers to investigate correlations, dependencies, bottlenecks, and resource allocation to ensure that hardware components are working in harmony. It visualizes throughput and performance metrics on a unified timeline, automatically detects performance limiters, and recommends how to resolve them.
For rooting out inefficiencies on a single machine, the Nsight Systems trace is an effective approach. But how does this workflow scale? Multinode environments are crucial to modern computing workloads. Multinode profiling is an analysis technique for these environments that identifies bottlenecks and other performance issues that may affect nodes and how they are coordinated.
Multinode profiling is particularly important to the context of high-performance computing (HPC) and data center workflows, where distributed systems with large numbers of nodes are used to solve complex scientific, engineering, and AI problems. By using multinode profiling techniques, HPC developers can optimize the performance of their systems and achieve faster, more efficient computation.
On a scale of 500 nodes and 5,000 GPUs, performance profiling seems daunting. Added complexity from network fabrics and storage devices only furthers this challenge.
Now available in public preview in Nsight Systems 2023.2, multinode analysis enhances optimization tools for large-scale computing. Built on foundational GPU, CPU, DPU, and network profiling features, Nsight Systems now offers a data analysis framework that parallel-processes performance data for multinode systems up to cluster size.
Python sampling
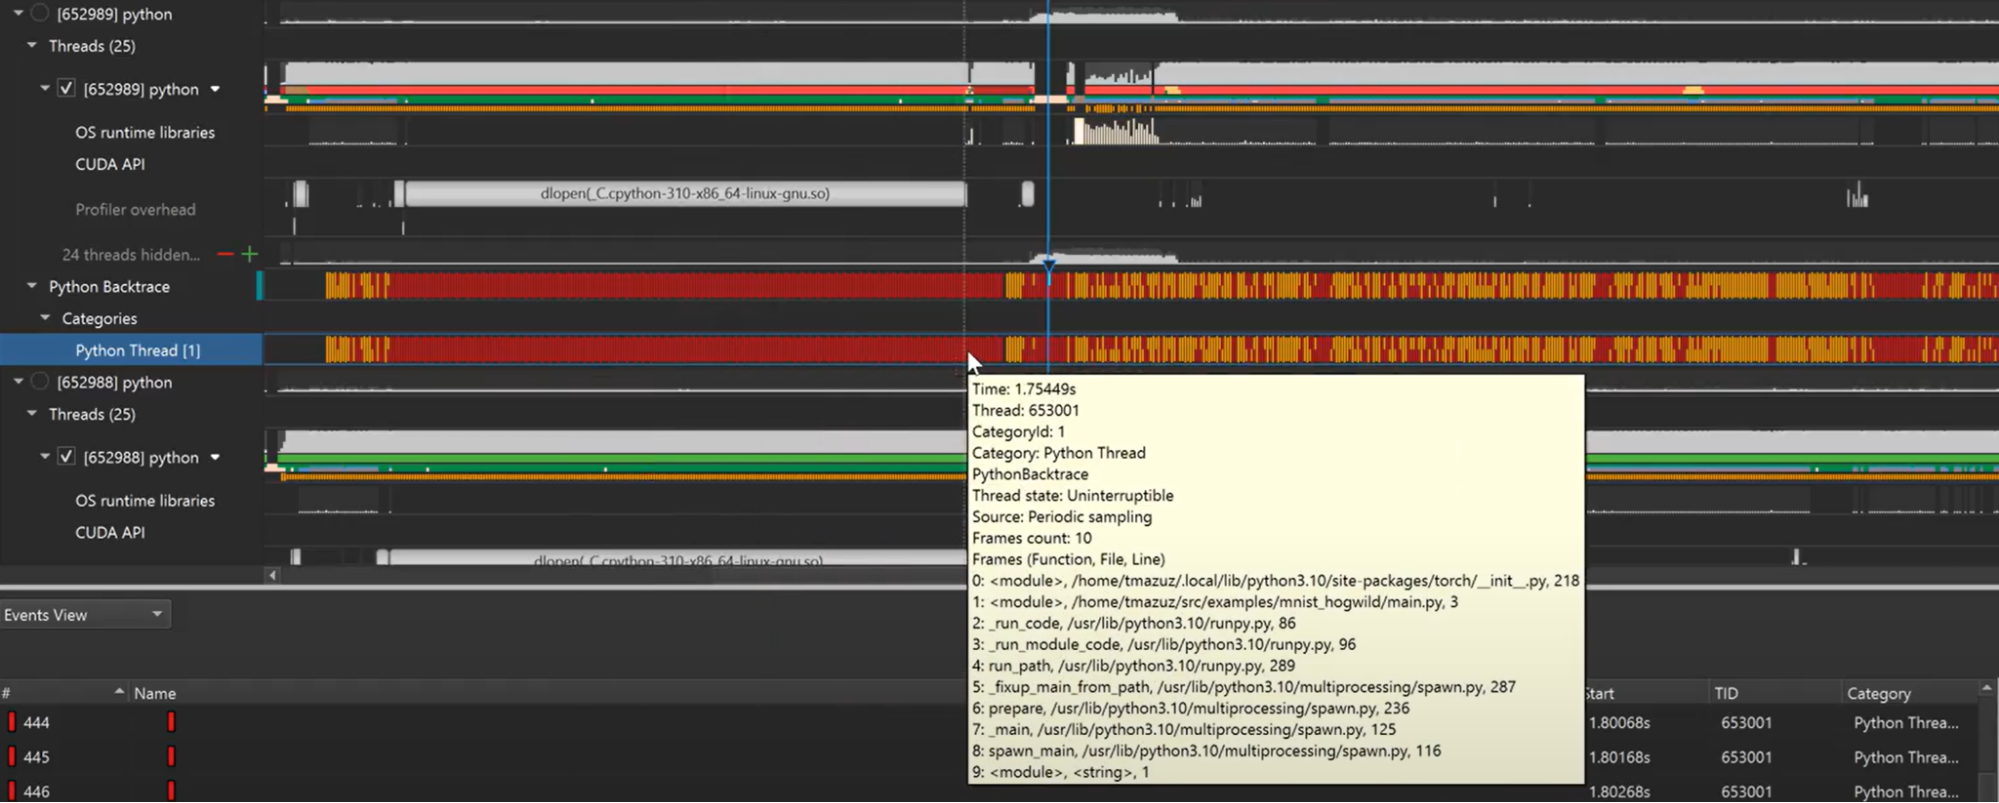
Python has surged in popularity for multinode systems. Built-in libraries for processing large datasets alongside use cases in AI and deep learning make the language a preferred choice. But optimizing GPU-accelerated Python code can be arduous. Its interpreted nature and high-level abstractions exchange ease-of-use for performance compared to low-level languages, compounded by tedious and error-prone manual sampling. This is made more difficult when trying to understand the relationship between the CPU and GPU work so that you can focus your optimizations towards maximizing your GPU usage.
To expedite Python profiling, a crucial facet of multinode performance, Nsight Systems now offers automatic Python call stack sampling. The frequency of samples can be tuned between 1 Hz and 2 KHz, and it supports all architectures. It can additionally sample call stacks on CUDA API call events.
Network metrics of internode communication
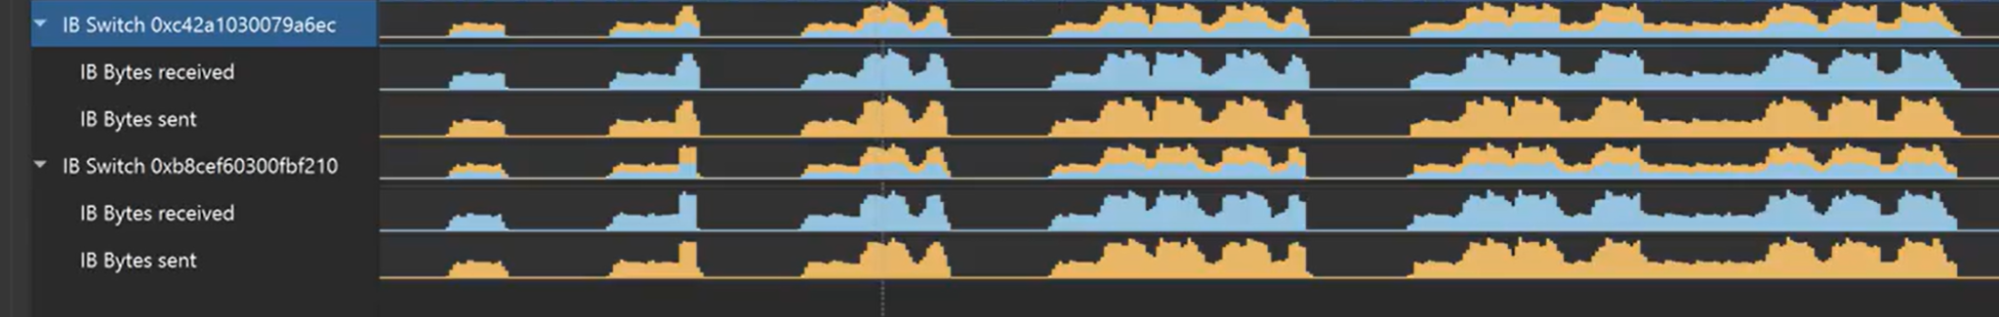
As the primary way that data moves between hardware units in a server, understanding internode communication from the network will help diagnose bottlenecks. Nsight Systems can now sample metrics from NVIDIA Quantum-2 InfiniBand switches, which provide high-bandwidth, low-latency communication.
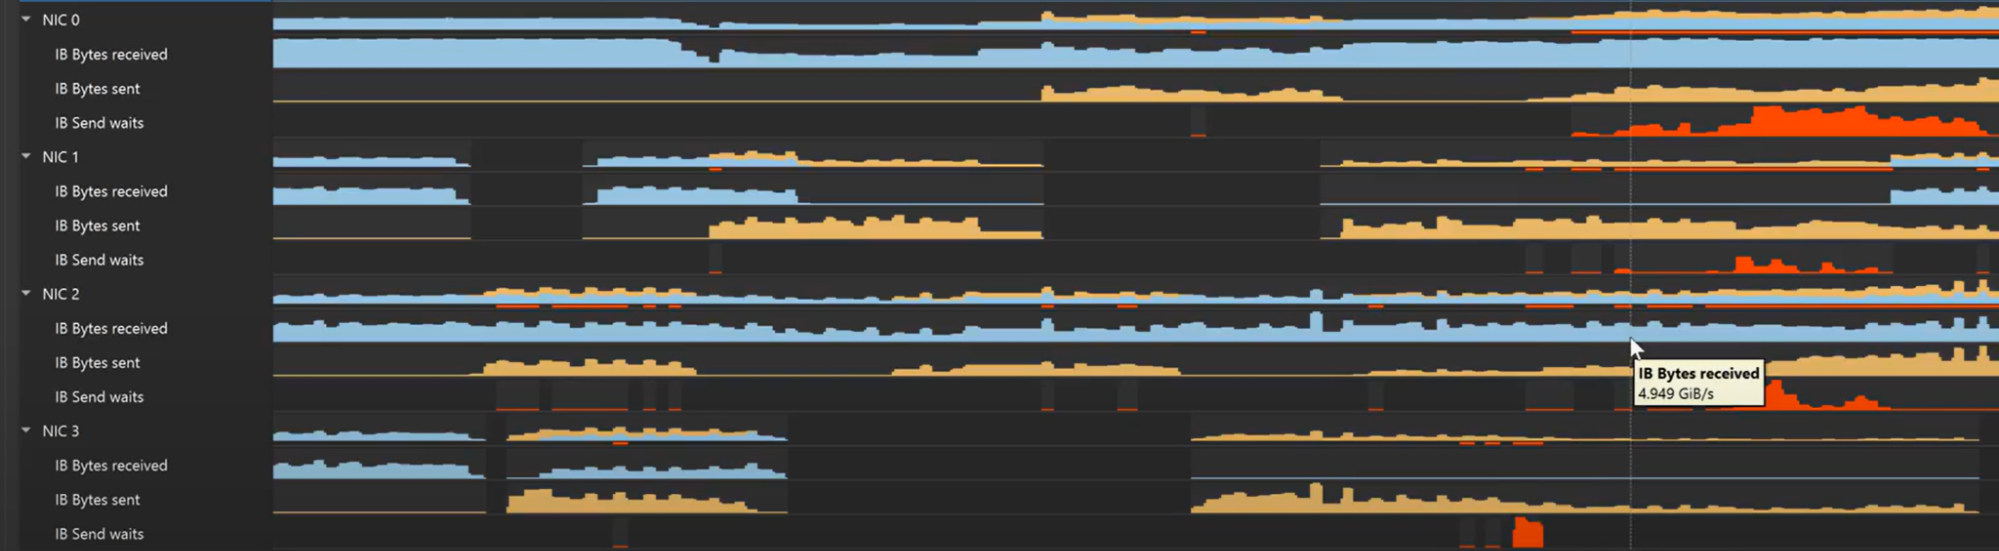
NVIDIA ConnectX smart network interface cards (SmartNICs) provide advanced hardware offloads and accelerations for network operations. Nsight Systems monitors NIC throughput, charting the volume of bytes sent and received. Extended NIC wait times are a strong indication that the internode network needs optimization.
Multinode analysis
Network and Python metric collection support new multinode profiling workflows that expose the entire hardware stack for optimization. Data center-scale profiling will usually start with a single-node proxy run to ensure that applications are functioning as expected. Issues on a single node will still surface at a multinode level, but are easier to resolve when the environment is less complicated. At this phase, Nsight Systems will analyze GPU, CPU, DPU, and Python metrics on the unified timeline and identify improvements.
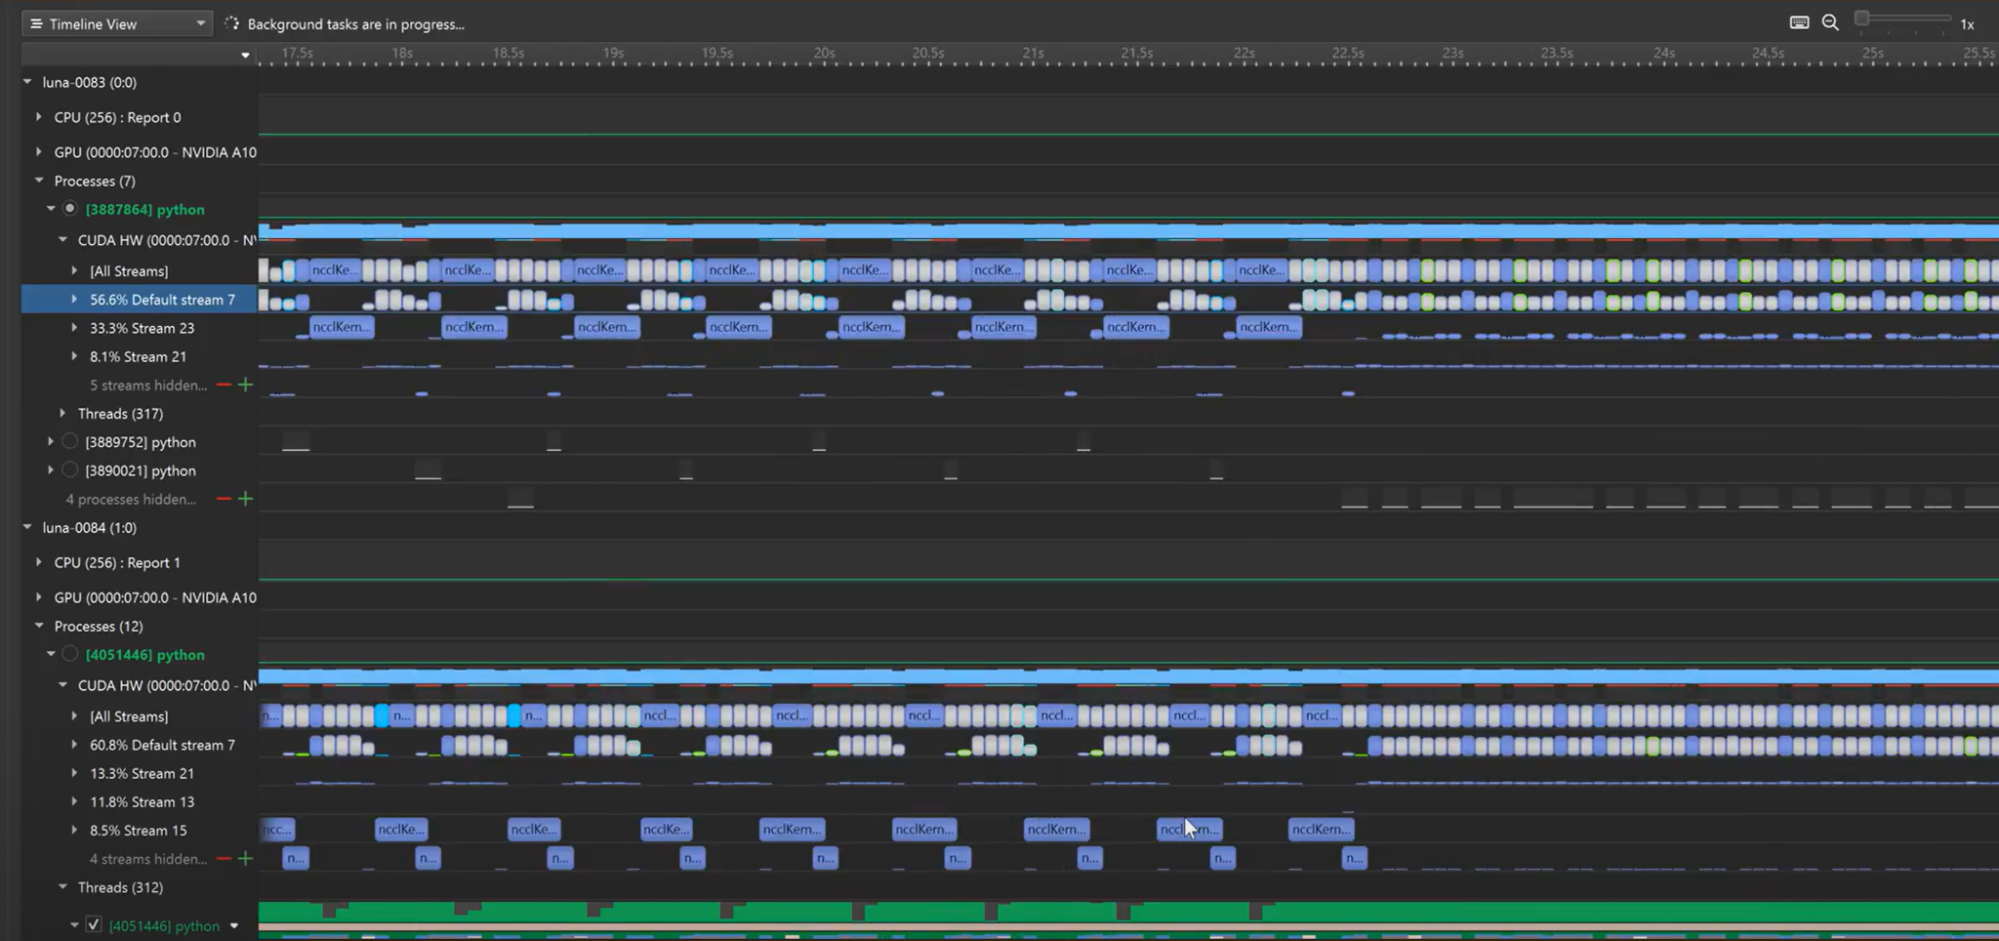
When performance is satisfactory on a single node, extending to a few-node proxy run will examine how network metrics and message passing interfaces (MPIs) impact the application. With the Nsight Systems multi-report view, you can view separate node traces on a unified timeline to visualize their relationships.
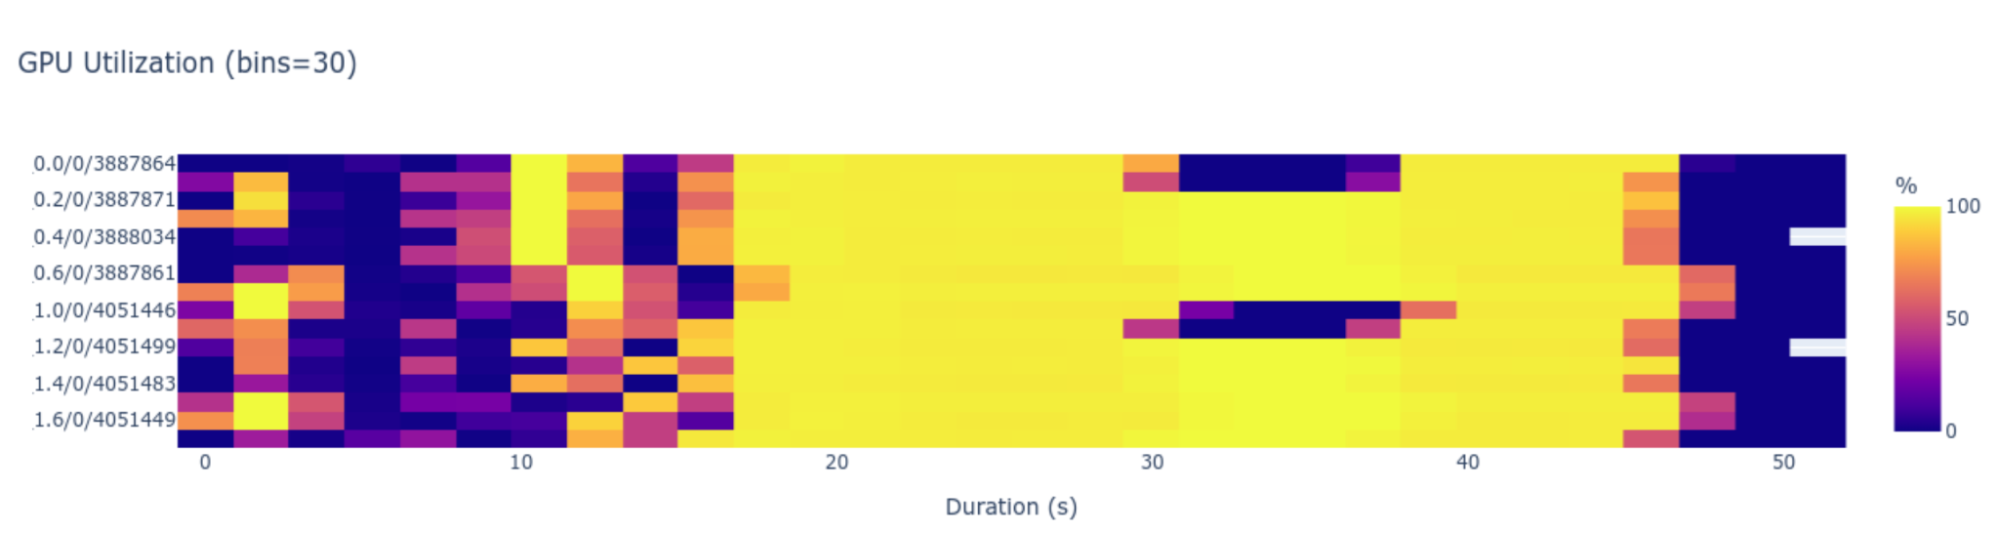
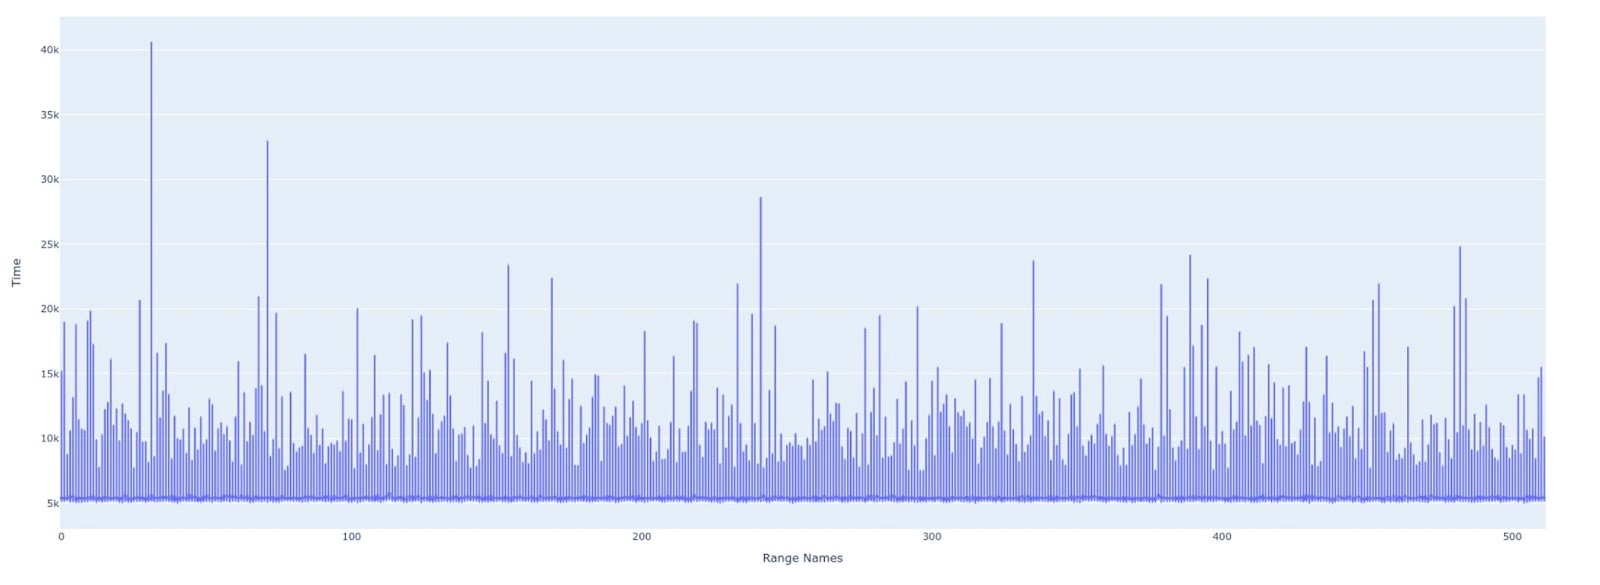
Then, when the former steps are complete, comprehensive multinode profiling begins. Collecting metrics from cluster or multinode systems yields an incredible volume of data, which can be used to monitor various statistics, including cluster-level utilization, rank progress, networking-to-rank computation, and more. Nsight Systems will automatically detect local performance throttles, but also correlate them, delivering cluster-wide conclusions, not rank-by-rank issues.
These results are derived using analysis scripts, or “recipes,” that can be customized to answer specific questions. Nsight Systems 2023.2 includes several preloaded recipes, such as ones for analyzing CUDA GPU kernel utilization and GPU metrics. When optimization needs are surfaced by running recipes, resolving them becomes straightforward by tracing how performance issues rippled through nodes, back to their source.
The final output is presented through an embedded Jupyter notebook, integrated in Nsight Systems as a tab. The Jupyter notebook enables convenient visualization with tables and graphics, alongside collaboration with team members.
Get started with Nsight Systems
Nsight Systems 2023.2 multinode profiling, Python profiling, and network profiling are now available. Download NVIDIA Nsight Systems to get started.
Learn more about the multinode profiling workflow with the NVIDIA GTC 2023 session, Optimizing at Scale: Investigating and Resolving Hidden Bottlenecks for Multinode Workloads. You can also watch the video, Optimize Multinode System Workloads With NVIDIA Nsight Systems.
To find out how CUDA Developer Tools scale, check out From the Macro to the Micro: CUDA Developer Tools Find and Fix Problems at Any Scale.
Explore more NVIDIA GTC 2023 sessions on NVIDIA Nsight Developer Tools.
