Debugging is difficult. Debugging across multiple languages is especially challenging, and debugging across devices often requires a team with varying skill sets and expertise to reveal the underlying problem.
Yet projects often require using multiple languages, to ensure high performance where necessary, a user-friendly experience, and compatibility where possible. Unfortunately, there is no single programming language that offers all of the above, demanding that developers become versatile.
This post shows how a RAPIDS team approached debugging multiple programming languages, including the use of GDB to identify and resolve deadlocks. The team is dedicated to designing software to accelerate and scale data science solutions.
The bug featured in this post was part of the RAPIDS project that was identified and resolved in the summer of 2019. It involves a complex stack with multiple programming languages, primarily C, C++, and Python, as well as CUDA for GPU acceleration.
Documenting this historical bug and its resolution serves a few goals, including:
- Demonstrating Python and C debugging with GDB
- Presenting ideas on how to diagnose deadlocks
- Developing a better understanding of mixing Python and CUDA
The content presented in this post should help you understand how such bugs manifest and how to address similar issues in your own work.
Bug description
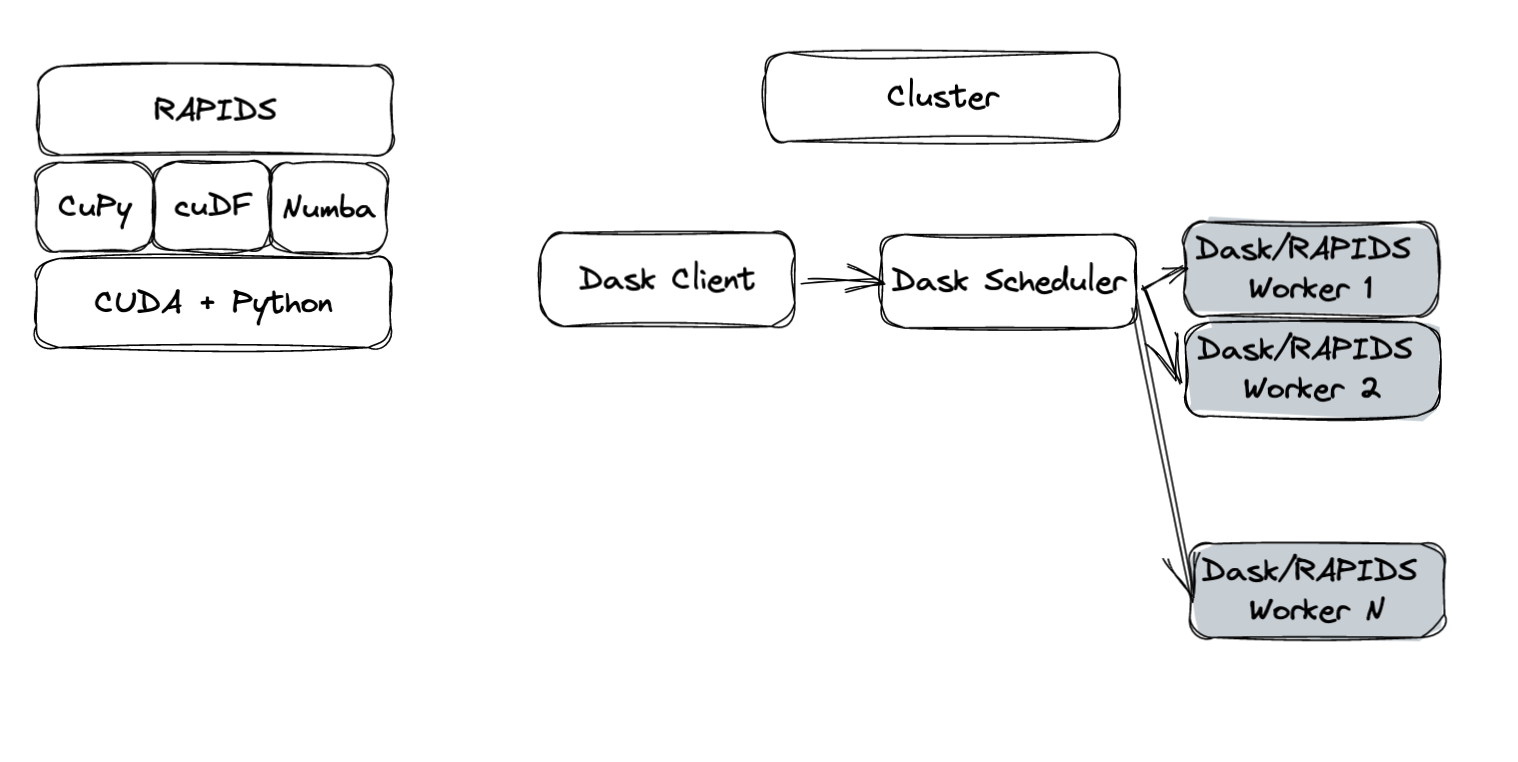
To be efficient and performant, RAPIDS depends on a variety of libraries for a multitude of different operations. To name a few, RAPIDS uses CuPy and cuDF to compute arrays and DataFrames on the GPU, respectively. Numba is a just-in-time compiler that can be used for accelerating user-defined Python operations on the GPU.
In addition, Dask is used to scale compute to multiple GPUs and multiple nodes. The last piece of the puzzle in the bug at hand is UCX, a communication framework used to leverage a variety of interconnects, such as InfiniBand and NVLink.
Figure 1 shows an overview of this stack. Although unknown at the time, a deadlock was occurring somewhere in this stack, preventing the workflow from completing.
This deadlock was first observed in August 2019, which was shortly after UCX was introduced in the stack. It turns out that the deadlock previously manifested itself without UCX (using the Dask default TCP communicator), except more infrequently.
A lot of time was spent exploring the space when the deadlock occurred. Though unknown at the time, the bug could have been in a particular operation, such as group by aggregation, merge/joins, repartitioning, or in a particular version of any of the libraries, including cuDF, CuPy, Dask, UCX, and more. There were many facets to explore as a result.
Prepare for debugging
The next sections walk you through how to prepare for debugging.
Set up a minimal reproducer
Finding a minimal reproducer is key to debugging anything. This problem was initially identified in a workflow running eight GPUs. Over time, we reduced this down to two GPUs. Having a minimal reproducer is critical to easily share a bug with others and get the time and attention from a broader team.
Set up your environment
Before diving into the problem, set up your environment. The bug can be minimally reproduced with the 0.10 version of RAPIDS (released in October 2019). It is possible to set up the environment with either Conda or Docker (see the respective sections later in this post).
This entire process assumes the use of Linux. Because UCX is not supported on Windows or MacOS, it is not reproducible on those operating systems.
Conda
First, install Miniconda. After the initial setup, we strongly recommend that you install mamba by running the following script:
conda install mamba -n base -c conda-forge
Then run the following script to create and activate a conda environment with RAPIDS 0.10:
mamba create -n rapids-0.10 -c rapidsai -c nvidia -c conda-forge rapids=0.10 glog=0.4 cupy=6.7 numba=0.45.1 ucx-py=0.11 ucx=1.7 ucx-proc=*=gpu libnuma dask=2.30 dask-core=2.30 distributed=2.30 gdb
conda activate rapids-0.10
We recommend Mamba for speeding up environment resolution. Skipping that step and replacing mamba with conda should work as well, but may be considerably slower.
Docker
Alternatively, you can reproduce the bug with Docker. After you have NVIDIA Container Toolkit set up, follow these instructions.
docker run -it --rm --cap-add sys_admin --cap-add sys_ptrace --ipc shareable --net host --gpus all rapidsai/rapidsai:0.10-cuda10.0-runtime-ubuntu18.04 /bin/bash
In the container, install mamba to speed up the environment resolution.
conda create -n mamba -c conda-forge mamba -y
Then, install UCX/UCX-Py, and libnuma, which is a UCX dependency. Also, upgrade Dask to a version that has integrated UCX support. For debugging later, also install GDB.
/opt/conda/envs/mamba/bin/mamba install -y -c rapidsai -c nvidia -c conda-forge dask=2.30 dask-core=2.30 distributed=2.30 fsspec=2022.11.0 libnuma ucx-py=0.11 ucx=1.7 ucx-proc=*=gpu gdb -p /opt/conda/envs/rapids
Debugging
This section details how this particular problem was encountered and ultimately fixed, with a detailed step-by-step overview. You can also reproduce and practice a few of the described concepts.
Running (or hanging)
The debugging issue in question is definitely not limited to a single compute problem, but it is easier to use the same workflow that we used in 2019. That script can be downloaded to a local environment by running the following script:
wget
https://gist.githubusercontent.com/pentschev/9ce97f8efe370552c7dd5e84b64d3c92/raw/424c9cf95f31c18d32a9481f78dd241e08a071a9/cudf-deadlock.py
To reproduce, execute the following:
OPENBLAS_NUM_THREADS=1 UCX_RNDV_SCHEME=put_zcopy UCX_MEMTYPE_CACHE=n UCX_TLS=sockcm,tcp,cuda_copy,cuda_ipc python cudf-deadlock.py
In just a few iterations (perhaps as few as one or two), you should see the preceding program hang. Now the real work begins.
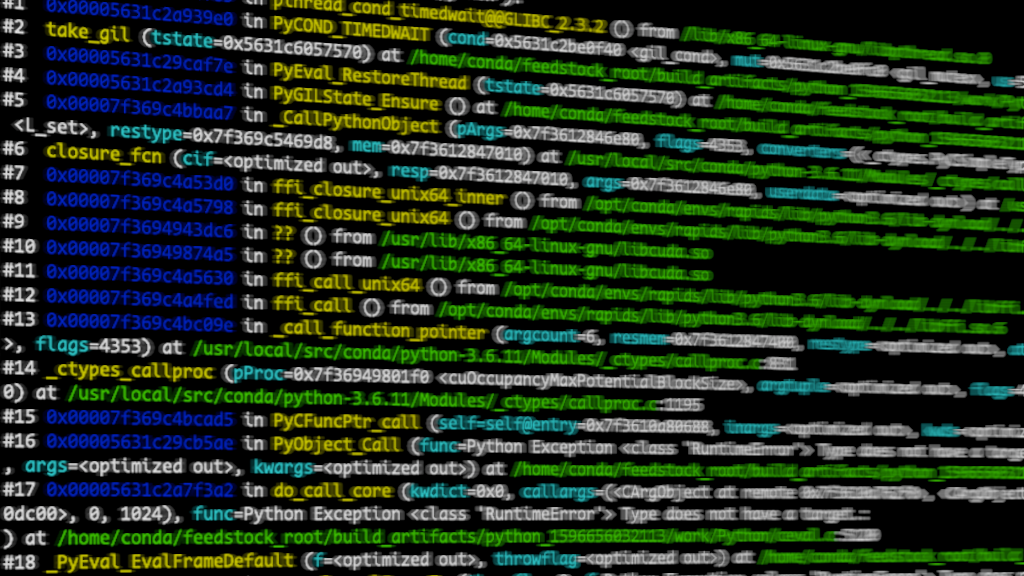
The deadlock
A nice attribute about deadlocks is that the processes and threads (if you know how to investigate them) can show what they are currently trying to do. You can infer what is causing the deadlock.
The critical tool is GDB. However, much time was spent initially with PDB for investigating what Python was doing at each step. GDB can attach to live processes, so you must first find out what the processes and their associated IDs are:
(rapids) root@dgx13:/rapids/notebooks# ps ax | grep python
   19 pts/0    S      0:01 /opt/conda/envs/rapids/bin/python /opt/conda/envs/rapids/bin/jupyter-lab --allow-root --ip=0.0.0.0 --no-browser --NotebookApp.token=
  865 pts/0    Sl+    0:03 python cudf-deadlock.py
  871 pts/0    S+     0:00 /opt/conda/envs/rapids/bin/python -c from multiprocessing.semaphore_tracker import main;main(69)
  873 pts/0    Sl+    0:08 /opt/conda/envs/rapids/bin/python -c from multiprocessing.spawn import spawn_main; spawn_main(tracker_fd=70, pipe_handle=76) --multiprocessing-fork
  885 pts/0    Sl+    0:07 /opt/conda/envs/rapids/bin/python -c from multiprocessing.spawn import spawn_main; spawn_main(tracker_fd=70, pipe_handle=85) --multiprocessing-fork
Four Python processes are relevant to this problem:
- Dask Client (
865) - Dask Scheduler (
871) - Two Dask workers (
873and885)
Interestingly enough, significant progress has been made in debugging Python since this bug was initially investigated. In 2019, RAPIDS was on Python 3.6, which already had tools to debug lower stacks but only when Python was built in debug mode. That required potentially rebuilding the entire software stack, which is prohibitive in complex cases like this.
Since Python 3.8, the debug builds use the same ABI as release builds, greatly simplifying debugging the C and Python stacks combined. We don’t cover that in this post.
GDB exploration
Use gdb to attach to the last running process (one of the Dask workers):
(rapids) root@dgx13:/rapids/notebooks# gdb -p 885
Attaching to process 885
[New LWP 889]
[New LWP 890]
[New LWP 891]
[New LWP 892]
[New LWP 893]
[New LWP 894]
[New LWP 898]
[New LWP 899]
[New LWP 902]
[Thread debugging using libthread_db enabled]
Using host libthread_db library "/lib/x86_64-linux-gnu/libthread_db.so.1".
0x00007f5494d48938 in pthread_rwlock_wrlock () from /lib/x86_64-linux-gnu/libpthread.so.0
(gdb)
Each Dask worker has several threads (communication, compute, admin, and so on). Use the gdb command info threads to inspect what each thread is doing.
(gdb) info threads
  Id   Target Id                                        Frame
* 1    Thread 0x7f5495177740 (LWP 885) "python"         0x00007f5494d48938 in pthread_rwlock_wrlock () from /lib/x86_64-linux-gnu/libpthread.so.0
  2    Thread 0x7f5425b98700 (LWP 889) "python"         0x00007f5494d4d384 in read () from /lib/x86_64-linux-gnu/libpthread.so.0
  3    Thread 0x7f5425357700 (LWP 890) "python"         0x00007f5494d49f85 in pthread_cond_timedwait@@GLIBC_2.3.2 () from /lib/x86_64-linux-gnu/libpthread.so.0
  4    Thread 0x7f5424b16700 (LWP 891) "python"         0x00007f5494d49f85 in pthread_cond_timedwait@@GLIBC_2.3.2 () from /lib/x86_64-linux-gnu/libpthread.so.0
  5    Thread 0x7f5411fff700 (LWP 892) "cuda-EvtHandlr" 0x00007f5494a5fbf9 in poll () from /lib/x86_64-linux-gnu/libc.so.6
  6    Thread 0x7f54117fe700 (LWP 893) "python"         0x00007f5494a6cbb7 in epoll_wait () from /lib/x86_64-linux-gnu/libc.so.6
  7    Thread 0x7f5410d3c700 (LWP 894) "python"         0x00007f5494d4c6d6 in do_futex_wait.constprop () from /lib/x86_64-linux-gnu/libpthread.so.0
  8    Thread 0x7f53f6048700 (LWP 898) "python"         0x00007f5494d49f85 in pthread_cond_timedwait@@GLIBC_2.3.2 () from /lib/x86_64-linux-gnu/libpthread.so.0
  9    Thread 0x7f53f5847700 (LWP 899) "cuda-EvtHandlr" 0x00007f5494a5fbf9 in poll () from /lib/x86_64-linux-gnu/libc.so.6
  10   Thread 0x7f53a39d9700 (LWP 902) "python"         0x00007f5494d4c6d6 in do_futex_wait.constprop () from /lib/x86_64-linux-gnu/libpthread.so.0
This Dask worker has 10 threads and half seem to be waiting on a mutex/futex. The other half cuda-EvtHandlr is polling. Observe what the current thread (denoted by the * at left), Thread 1, is doing by looking at the backtrace:
(gdb) bt
#0  0x00007f5494d48938 in pthread_rwlock_wrlock () from /lib/x86_64-linux-gnu/libpthread.so.0
#1  0x00007f548bc770a8 in ?? () from /usr/lib/x86_64-linux-gnu/libcuda.so
#2  0x00007f548ba3d87c in ?? () from /usr/lib/x86_64-linux-gnu/libcuda.so
#3  0x00007f548bac6dfa in ?? () from /usr/lib/x86_64-linux-gnu/libcuda.so
#4  0x00007f54240ba372 in uct_cuda_ipc_iface_event_fd_arm (tl_iface=0x562398656990, events=<optimized out>) at cuda_ipc/cuda_ipc_iface.c:271
#5  0x00007f54241d4fc2 in ucp_worker_arm (worker=0x5623987839e0) at core/ucp_worker.c:1990
#6  0x00007f5424259b76 in __pyx_pw_3ucp_5_libs_4core_18ApplicationContext_23_blocking_progress_mode_1_fd_reader_callback ()
   from /opt/conda/envs/rapids/lib/python3.6/site-packages/ucp/_libs/core.cpython-36m-x86_64-linux-gnu.so
#7  0x000056239601d5ae in PyObject_Call (func=<cython_function_or_method at remote 0x7f54242bb608>, args=<optimized out>, kwargs=<optimized out>)
    at /home/conda/feedstock_root/build_artifacts/python_1596656032113/work/Objects/abstract.c:2261
#8  0x00005623960d13a2 in do_call_core (kwdict=0x0, callargs=(), func=<cython_function_or_method at remote 0x7f54242bb608>)
    at /home/conda/feedstock_root/build_artifacts/python_1596656032113/work/Python/ceval.c:5120
#9  _PyEval_EvalFrameDefault (f=<optimized out>, throwflag=<optimized out>) at /home/conda/feedstock_root/build_artifacts/python_1596656032113/work/Python/ceval.c:3404
#10 0x00005623960924b5 in PyEval_EvalFrameEx (throwflag=0, f=Python Exception <class 'RuntimeError'> Type does not have a target.:
) at /home/conda/feedstock_root/build_artifacts/python_1596656032113/work/Python/ceval.c:754
#11 _PyFunction_FastCall (globals=<optimized out>, nargs=<optimized out>, args=<optimized out>, co=<optimized out>)
    at /home/conda/feedstock_root/build_artifacts/python_1596656032113/work/Python/ceval.c:4933
#12 fast_function (func=<optimized out>, stack=<optimized out>, nargs=<optimized out>, kwnames=<optimized out>)
    at /home/conda/feedstock_root/build_artifacts/python_1596656032113/work/Python/ceval.c:4968
#13 0x00005623960a13af in call_function (pp_stack=0x7ffdfa2311e8, oparg=<optimized out>, kwnames=0x0)
    at /home/conda/feedstock_root/build_artifacts/python_1596656032113/work/Python/ceval.c:4872
#14 0x00005623960cfcaa in _PyEval_EvalFrameDefault (f=<optimized out>, throwflag=<optimized out>)
    at /home/conda/feedstock_root/build_artifacts/python_1596656032113/work/Python/ceval.c:3335
#15 0x00005623960924b5 in PyEval_EvalFrameEx (throwflag=0, Python Exception <class 'RuntimeError'> Type does not have a target.:
f=) at /home/conda/feedstock_root/build_artifacts/python_1596656032113/work/Python/ceval.c:754
#16 _PyFunction_FastCall (globals=<optimized out>, nargs=<optimized out>, args=<optimized out>, co=<optimized out>)
    at /home/conda/feedstock_root/build_artifacts/python_1596656032113/work/Python/ceval.c:4933
#17 fast_function (func=<optimized out>, stack=<optimized out>, nargs=<optimized out>, kwnames=<optimized out>)
    at /home/conda/feedstock_root/build_artifacts/python_1596656032113/work/Python/ceval.c:4968
#18 0x00005623960a13af in call_function (pp_stack=0x7ffdfa2313f8, oparg=<optimized out>, kwnames=0x0)
    at /home/conda/feedstock_root/build_artifacts/python_1596656032113/work/Python/ceval.c:4872
#19 0x00005623960cfcaa in _PyEval_EvalFrameDefault (f=<optimized out>, throwflag=<optimized out>)
    at /home/conda/feedstock_root/build_artifacts/python_1596656032113/work/Python/ceval.c:3335
#20 0x00005623960924b5 in PyEval_EvalFrameEx (throwflag=0, Python Exception <class 'RuntimeError'> Type does not have a target.:
f=) at /home/conda/feedstock_root/build_artifacts/python_1596656032113/work/Python/ceval.c:754
Looking at the first 20 frames of the stack (the later frames are all irrelevant Python internal calls omitted for brevity), you can see a handful of internal Python calls: _PyEval_EvalFrameDefault, _PyFunction_FastCall, and _PyEval_EvalCodeWithName. There are also some calls to libcuda.so.
This observation hints that maybe there is a deadlock. It could be Python, CUDA, or possibly both. The Linux Wikibook on Deadlocks contains methodologies for debugging deadlocks to help you move forward.
However, instead of pthread_mutex_lock as described in the WikiBook, here it is pthread_rwlock_wrlock.
(gdb) bt
#0  0x00007f8e94762938 in pthread_rwlock_wrlock () from /lib/x86_64-linux-gnu/libpthread.so.0
#1  0x00007f8e8b6910a8 in ?? () from /usr/lib/x86_64-linux-gnu/libcuda.so
#2  0x00007f8e8b45787c in ?? () from /usr/lib/x86_64-linux-gnu/libcuda.so
…
According to the documentation for pthread_rwlock_wrlock, it takes a single argument, rwlock, that is a read/write lock. Now, look at what the code is doing and list the source:
(gdb) list
6       /home/conda/feedstock_root/build_artifacts/python_1596656032113/work/Programs/python.c: No such file or directory.
There are no debugging symbols. Returning to the Linux Wikibook, you can look at the registers. You can do that in GDB as well:
(gdb) info reg
rax            0xfffffffffffffe00  -512
rbx            0x5623984aa750      94710878873424
rcx            0x7f5494d48938      140001250937144
rdx            0x3                 3
rsi            0x189               393
rdi            0x5623984aa75c      94710878873436
rbp            0x0                 0x0
rsp            0x7ffdfa230be0      0x7ffdfa230be0
r8             0x0                 0
r9             0xffffffff          4294967295
r10            0x0                 0
r11            0x246               582
r12            0x5623984aa75c      94710878873436
r13            0xca                202
r14            0xffffffff          4294967295
r15            0x5623984aa754      94710878873428
rip            0x7f5494d48938      0x7f5494d48938 <pthread_rwlock_wrlock+328>
eflags         0x246               [ PF ZF IF ]
cs             0x33                51
ss             0x2b                43
ds             0x0                 0
es             0x0                 0
fs             0x0                 0
gs             0x0                 0
The problem is not knowing their meaning. Fortunately, documentation exists—for instance, the Guide to x86-64 from Stanford CS107, which explains that the first six arguments are in registers %rdi, %rsi, %rdx, %rcx, %r8, and %r9.
As seen previously, pthread_rwlock_wrlock takes only one argument, so that must be in %rdi. The rest are probably then used as general-purpose registers by pthread_rwlock_wrlock.
Now, you need to read the %rdi register. You already know it has a type pthread_rwlock_t, so dereferencing must be possible:
(gdb) p *(pthread_rwlock_t*)$rdi
$2 = {__data = {__lock = 3, __nr_readers = 0, __readers_wakeup = 0, __writer_wakeup = 898, __nr_readers_queued = 0, __nr_writers_queued = 0, __writer = 0,
    __shared = 0, __pad1 = 0, __pad2 = 0, __flags = 0}, __size = "\003", '\000' <repeats 11 times>, "\202\003", '\000' <repeats 41 times>, __align = 3}
What is shown is the internal state of the pthread_rwlock_t object that libcuda.so passed to pthread_rwlock_wrlock—the lock itself. Unfortunately, the names are not of much relevance. You can infer that __lock likely means the number of concurrent attempts to acquire the lock, but that is the extent of the inference.
The only other attribute that has a non-zero value is __write_wakeup. The Linux Wikibook lists an interesting value called __owner, which points to the process identifier (PID) that currently has ownership of the lock. Given that pthread_rwlock_t is a read/write lock, presuming that __writer_wakeup points to the process that owns the lock may be a good next step.
One fact about Linux is that each thread in a program runs as if it were a process. Each thread should have a PID (or LWP in GDB).
Look again at all threads in the process for one thread that has the same PID as __writer_wakeup. Fortunately, one thread does have that ID:
(gdb) info threads
  Id   Target Id                                        Frame
  8    Thread 0x7f53f6048700 (LWP 898) "python"         0x00007f5494d49f85 in pthread_cond_timedwait@@GLIBC_2.3.2 () from /lib/x86_64-linux-gnu/libpthread.so.0
So far, it seems probable that Thread 8 has the lock that Thread 1 is attempting to acquire. The stack of Thread 8 may provide a clue about what is going on. Run that next:
(gdb) thread apply 8 bt
Thread 8 (Thread 0x7f53f6048700 (LWP 898) "python"):
#0  0x00007f5494d49f85 in pthread_cond_timedwait@@GLIBC_2.3.2 () from /lib/x86_64-linux-gnu/libpthread.so.0
#1  0x00005623960e59e0 in PyCOND_TIMEDWAIT (cond=0x562396232f40 <gil_cond>, mut=0x562396232fc0 <gil_mutex>, us=5000) at /home/conda/feedstock_root/build_artifacts/python_1596656032113/work/Python/condvar.h:103
#2  take_gil (tstate=0x5623987ff240) at /home/conda/feedstock_root/build_artifacts/python_1596656032113/work/Python/ceval_gil.h:224
#3  0x000056239601cf7e in PyEval_RestoreThread (tstate=0x5623987ff240) at /home/conda/feedstock_root/build_artifacts/python_1596656032113/work/Python/ceval.c:369
#4  0x00005623960e5cd4 in PyGILState_Ensure () at /home/conda/feedstock_root/build_artifacts/python_1596656032113/work/Python/pystate.c:895
#5  0x00007f5493610aa7 in _CallPythonObject (pArgs=0x7f53f6042e80, flags=4353, converters=(<_ctypes.PyCSimpleType at remote 0x562396b4d588>,), callable=<function at remote 0x7f53ec6e6950>, setfunc=0x7f549360ba80 <L_set>, restype=0x7f549369b9d8, mem=0x7f53f6043010) at /usr/local/src/conda/python-3.6.11/Modules/_ctypes/callbacks.c:141
#6  closure_fcn (cif=<optimized out>, resp=0x7f53f6043010, args=0x7f53f6042e80, userdata=<optimized out>) at /usr/local/src/conda/python-3.6.11/Modules/_ctypes/callbacks.c:296
#7  0x00007f54935fa3d0 in ffi_closure_unix64_inner () from /opt/conda/envs/rapids/lib/python3.6/lib-dynload/../../libffi.so.6
#8  0x00007f54935fa798 in ffi_closure_unix64 () from /opt/conda/envs/rapids/lib/python3.6/lib-dynload/../../libffi.so.6
#9  0x00007f548ba99dc6 in ?? () from /usr/lib/x86_64-linux-gnu/libcuda.so
#10 0x00007f548badd4a5 in ?? () from /usr/lib/x86_64-linux-gnu/libcuda.so
#11 0x00007f54935fa630 in ffi_call_unix64 () from /opt/conda/envs/rapids/lib/python3.6/lib-dynload/../../libffi.so.6
#12 0x00007f54935f9fed in ffi_call () from /opt/conda/envs/rapids/lib/python3.6/lib-dynload/../../libffi.so.6
#13 0x00007f549361109e in _call_function_pointer (argcount=6, resmem=0x7f53f6043400, restype=<optimized out>, atypes=0x7f53f6043380, avalues=0x7f53f60433c0, pProc=0x7f548bad61f0 <cuOccupancyMaxPotentialBlockSize>, flags=4353) at /usr/local/src/conda/python-3.6.11/Modules/_ctypes/callproc.c:831
#14 _ctypes_callproc (pProc=0x7f548bad61f0 <cuOccupancyMaxPotentialBlockSize>, argtuple=<optimized out>, flags=4353, argtypes=<optimized out>, restype=<_ctypes.PyCSimpleType at remote 0x562396b4d588>, checker=0x0) at /usr/local/src/conda/python-3.6.11/Modules/_ctypes/callproc.c:1195
#15 0x00007f5493611ad5 in PyCFuncPtr_call (self=self@entry=0x7f53ed534750, inargs=<optimized out>, kwds=<optimized out>) at /usr/local/src/conda/python-3.6.11/Modules/_ctypes/_ctypes.c:3970
#16 0x000056239601d5ae in PyObject_Call (func=Python Exception <class 'RuntimeError'> Type does not have a target.:
, args=<optimized out>, kwargs=<optimized out>) at /home/conda/feedstock_root/build_artifacts/python_1596656032113/work/Objects/abstract.c:2261
#17 0x00005623960d13a2 in do_call_core (kwdict=0x0, callargs=(<CArgObject at remote 0x7f53ed516530>, <CArgObject at remote 0x7f53ed516630>, <c_void_p at remote 0x7f53ed4cad08>, <CFunctionType at remote 0x7f5410f4ef20>, 0, 1024), func=Python Exception <class 'RuntimeError'> Type does not have a target.:
) at /home/conda/feedstock_root/build_artifacts/python_1596656032113/work/Python/ceval.c:5120
#18 _PyEval_EvalFrameDefault (f=<optimized out>, throwflag=<optimized out>) at /home/conda/feedstock_root/build_artifacts/python_1596656032113/work/Python/ceval.c:3404
#19 0x0000562396017ea8 in PyEval_EvalFrameEx (throwflag=0, f=Python Exception <class 'RuntimeError'> Type does not have a target.:
) at /home/conda/feedstock_root/build_artifacts/python_1596656032113/work/Python/ceval.c:754
#20 _PyEval_EvalCodeWithName (_co=<optimized out>, globals=<optimized out>, locals=<optimized out>, args=<optimized out>, argcount=<optimized out>, kwnames=0x0, kwargs=0x7f541805a390, kwcount=<optimized out>, kwstep=1, defs=0x0, defcount=0, kwdefs=0x0, closure=(<cell at remote 0x7f5410520408>, <cell at remote 0x7f53ed637c48>, <cell at remote 0x7f53ed6377f8>), name=Python Exception <class 'RuntimeError'> Type does not have a target.:
, qualname=Python Exception <class 'RuntimeError'> Type does not have a target.:
) at /home/conda/feedstock_root/build_artifacts/python_1596656032113/work/Python/ceval.c:4166
At the top of the stack, it seems like an ordinary Python thread waiting for the GIL. It looks unsuspicious, so you might just ignore it and look for clues elsewhere. That is exactly what we did in 2019.
Take a more thorough look at the rest of the stack, especially frames 9 and 10:
#9  0x00007f548ba99dc6 in ?? () from /usr/lib/x86_64-linux-gnu/libcuda.so
#10 0x00007f548badd4a5 in ?? () from /usr/lib/x86_64-linux-gnu/libcuda.so
At this point, things may look even more confusing. Thread 1 is locking in libcuda.so internals. Without access to the CUDA source code, debugging would be difficult.
Further examining the stack of Thread 8, you can see two frames that provide hints:
#13 0x00007f549361109e in _call_function_pointer (argcount=6, resmem=0x7f53f6043400, restype=<optimized out>, atypes=0x7f53f6043380, avalues=0x7f53f60433c0, pProc=0x7f548bad61f0 <cuOccupancyMaxPotentialBlockSize>, flags=4353) at /usr/local/src/conda/python-3.6.11/Modules/_ctypes/callproc.c:831
#14 _ctypes_callproc (pProc=0x7f548bad61f0 <cuOccupancyMaxPotentialBlockSize>, argtuple=<optimized out>, flags=4353, argtypes=<optimized out>, restype=<_ctypes.PyCSimpleType at remote 0x562396b4d588>, checker=0x0) at /usr/local/src/conda/python-3.6.11/Modules/_ctypes/callproc.c:1195
To summarize up to this point, two threads are sharing a lock. Thread 8 is trying to take the GIL and also make a CUDA call to cuOccupancyMaxPotentialBlockSize.
However, libcuda.so does not know anything about Python, so why is it trying to take the GIL?
The docs for cuOccupancyMaxPotentialBlockSize show that it takes a callback. Callbacks are functions that can be registered with another function to be executed at a certain point in time, effectively executing a user-defined action at that predefined point.
This is interesting. Next, find out where that call comes from. Grepping through piles and piles of code—cuDF, Dask, RMM, CuPy, and Numba—reveals an explicit call to cuOccupancyMaxPotentialBlockSize in the 0.45 release of Numba:
    def get_max_potential_block_size(self, func, b2d_func, memsize, blocksizelimit, flags=None):
        """Suggest a launch configuration with reasonable occupancy.
        :param func: kernel for which occupancy is calculated
        :param b2d_func: function that calculates how much per-block dynamic shared memory 'func' uses based on the block size.
        :param memsize: per-block dynamic shared memory usage intended, in bytes
        :param blocksizelimit: maximum block size the kernel is designed to handle"""


        gridsize = c_int()
        blocksize = c_int()
        b2d_cb = cu_occupancy_b2d_size(b2d_func)
        if not flags:
            driver.cuOccupancyMaxPotentialBlockSize(byref(gridsize), byref(blocksize),
                                                    func.handle,
                                                    b2d_cb,
                                                    memsize, blocksizelimit)
        else:
            driver.cuOccupancyMaxPotentialBlockSizeWithFlags(byref(gridsize), byref(blocksize),
                                                             func.handle, b2d_cb,
                                                             memsize, blocksizelimit, flags)
        return (gridsize.value, blocksize.value)
This function is called in numba/cuda/compiler:
    def _compute_thread_per_block(self, kernel):
        tpb = self.thread_per_block
        # Prefer user-specified config
        if tpb != 0:
            return tpb
        # Else, ask the driver to give a good cofnig
        else:
            ctx = get_context()
            kwargs = dict(
                func=kernel._func.get(),
                b2d_func=lambda tpb: 0,
                memsize=self.sharedmem,
                blocksizelimit=1024,
            )
            try:
                # Raises from the driver if the feature is unavailable
                _, tpb = ctx.get_max_potential_block_size(**kwargs)
            except AttributeError:
                # Fallback to table-based approach.
                tpb = self._fallback_autotune_best(kernel)
                raise
            return tpb
Looking closely at the function definition for _compute_thread_per_block, you can see a callback written as a Python lambda: b2d_func=lambda tpb: 0.
Aha! In the middle of this CUDA call, the callback function must acquire the Python GIL to execute a function that simply returns 0. This is because executing any Python code requires the GIL and that can only be owned by a single thread at any given point in time.
Replacing this with a pure C function solves the problem. You can write a pure C function from Python with Numba!
@cfunc("uint64(int32)")
def _b2d_func(tpb):
    return 0

b2d_func=_b2d_func.address
This fix was submitted and eventually merged into Numba PR #4581. And this five-line code change in Numba is ultimately what resolved several people pouring over the code over many weeks of debugging.
Debugging lessons learned
Throughout the various debugging sessions, and even more after the bug was finally resolved, we reflected on the problem and came up with the following lessons:
- Do not implement deadlocks. Really, do not!
- Do not pass Python functions to C/C++ functions as callbacks unless you are absolutely certain that the GIL is not taken by another thread when the callback is executed. Even if you are absolutely sure that the GIL is not taken, double and triple-check. You do not want to take any chances here.
- Use all the tools at your disposal. Even though you primarily write Python code, you can still find a bug in a library written in another language like C or C++. GDB is powerful for debugging C and C++ as well as Python. For more information, see GDB support.
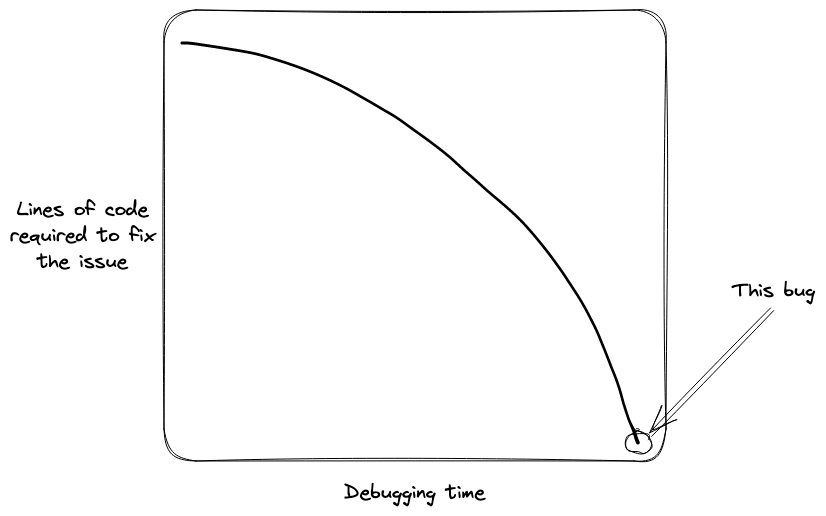
Bug complexity compared to code fix complexity
The plot in Figure 2 is a representation of a common debugging pattern: the time spent to understand and find the problem is high, while the extent of changes is low. This case is an ideal example of that pattern: debugging time tending to infinity and lines of code written or changed tending to zero.
Conclusion
Debugging can be intimidating, particularly when you do not have access to all the source code or a nice IDE. As much as GDB can look frightening, it is just as powerful. However, with the right tools, experience, and knowledge gained over time, seemingly impossible-to-understand problems can be looked at in varying degrees of detail and truly understood.
This post presented a step-by-step overview of how one bug took a multifaceted development team dozens of engineering hours to resolve. With this overview and some understanding of GDB, multithreading, and deadlocks, you can help to resolve moderately complex problems with a newly gained skill set.
Finally, never limit yourself to the tools that you already know. If you know PDB, try GDB next. If you understand enough about the OS call stack, try to explore registers and other CPU properties. Those skills can certainly help make developers of all fields and programming languages more aware of potential pitfalls and provide unique opportunities to prevent silly mistakes from becoming nightmarish monsters.
