At NVIDIA GTC 2024, the RAPIDS team demonstrated new features on NVDashboard v0.10 a dashboard that runs on JupyterLab, for monitoring GPU usage to help maximize the efficiency of GPU resources.
We are excited to follow that up by announcing that NVDashboard v0.10 is now available to use.
This update introduces a host of improvements, including data streaming through WebSockets for enhanced performance, time series chart brushing and synchronized tooltips for improved usability. These upgrades collectively transform the user experience, offering a more responsive, intuitive, and visually cohesive tool for developers and researchers working with GPU-intensive applications within JupyterLab.

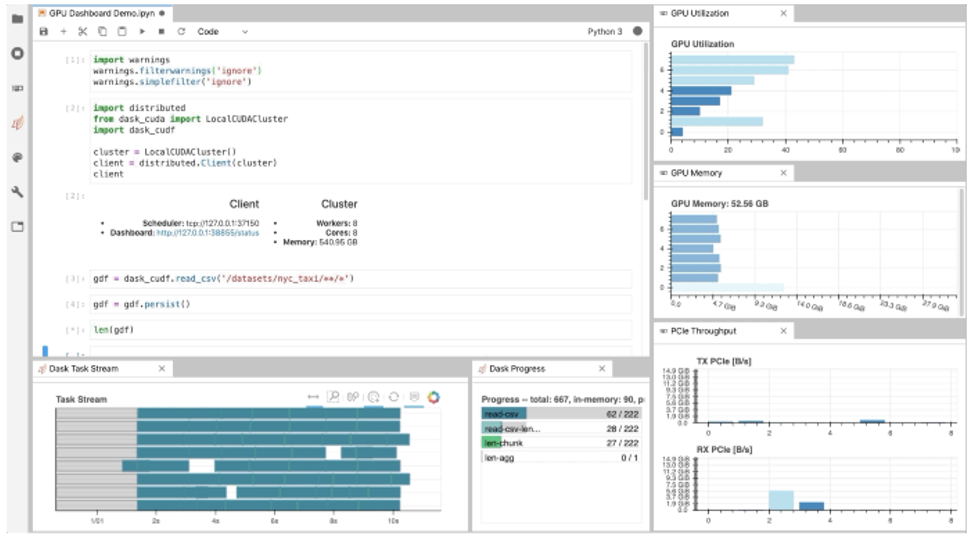
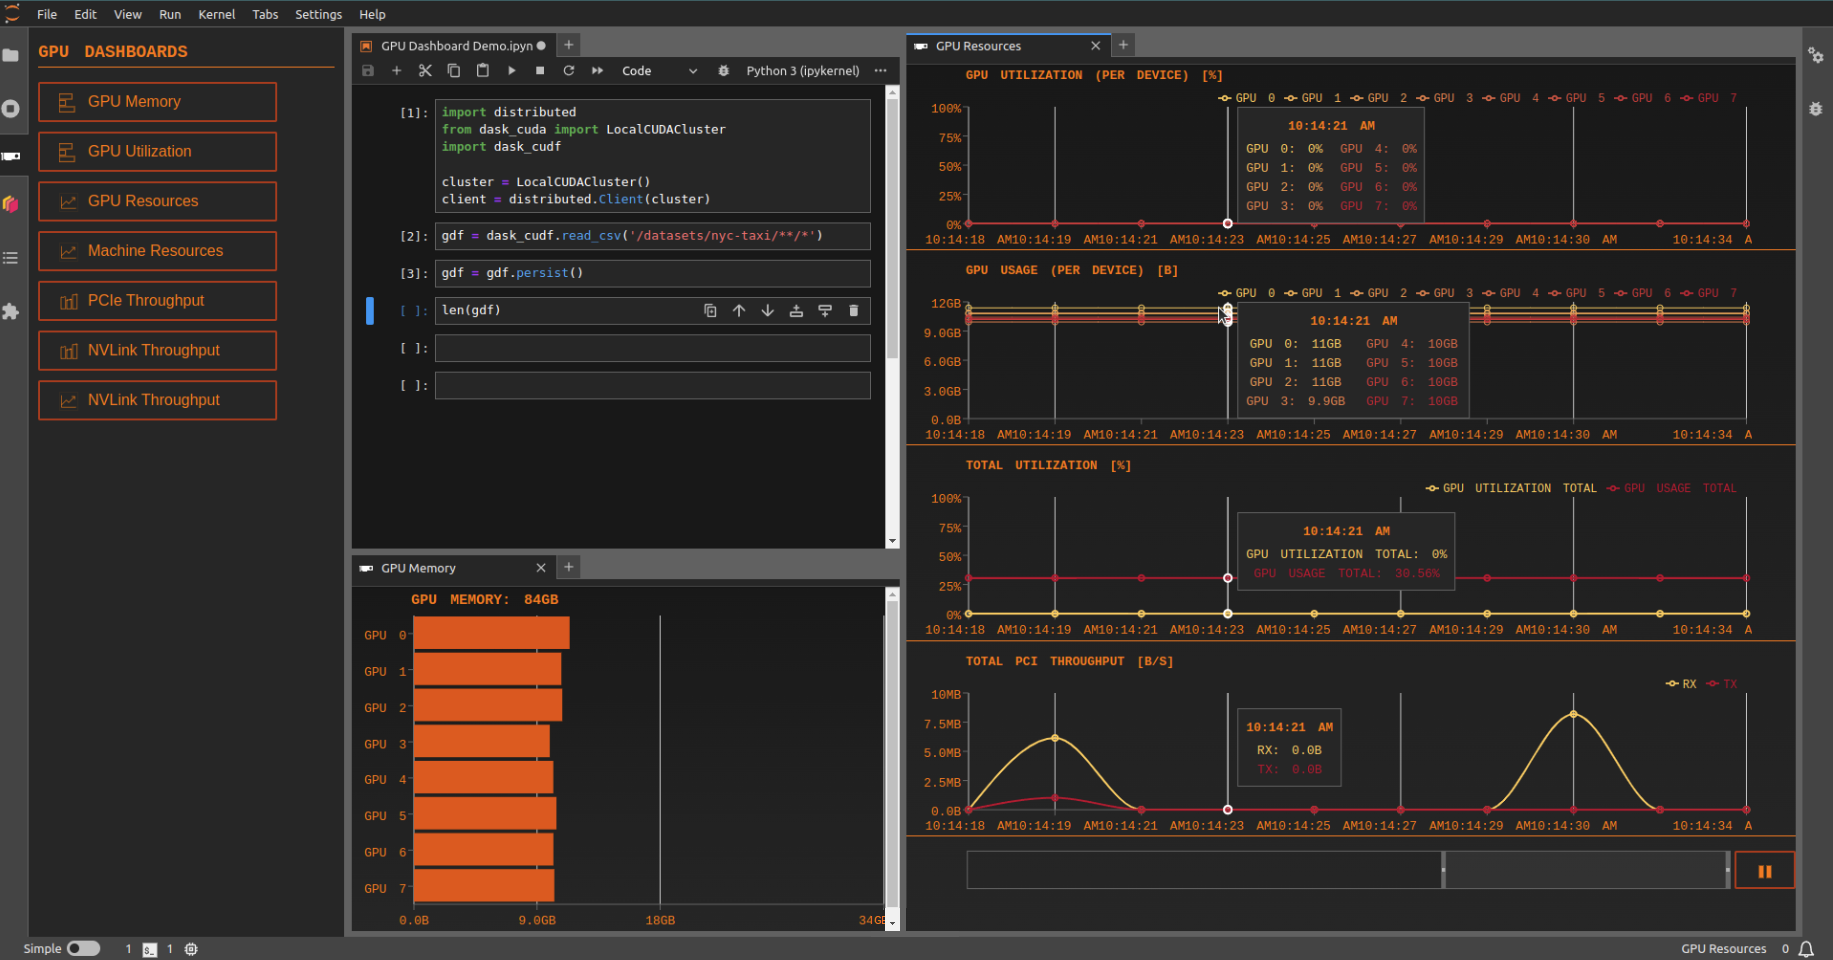
Figure 1 shows the GPU dashboards on the right, while two dask-labextension dashboards are shown on the bottom left.
NVDashboard is an essential JupyterLab extension tailored for displaying GPU usage dashboards. It supports a variety of metrics, including the following:
- GPU-compute utilization
- GPU-memory consumption
- PCIe throughput
- NVLink throughput
The extension was previously only compatible with JupyterLab versions up to 3.0. With the release of JupyterLab 4.x, we updated NVDashboard to version 0.10 to ensure compatibility with the latest version of JupyterLab.
Who should use NVDashboard
NVDashboard is an essential tool for a wide range of professionals who require real-time monitoring and analysis of GPU resources within JupyterLab environments. The recent updates make it particularly beneficial for multiple roles.
Data scientists and AI researchers
For those who are developing and training machine learning models, NVDashboard provides immediate insights into GPU utilization, memory, and compute metrics. This enables efficient resource management and helps in identifying bottlenecks during model training.
Developers and engineers
Whether you’re working on high-performance computing (HPC) tasks, 3D rendering, or complex simulations, NVDashboard offers a clear view of how your code uses GPU resources. This can lead to more informed decisions when optimizing code for better performance.
Educators and students
In academic settings where understanding hardware utilization is part of the learning process, NVDashboard serves as a practical tool for teaching concepts related to parallel computing and GPU-accelerated applications.
DevOps and system administrators
For those managing JupyterLab environments, NVDashboard provides a way to monitor and ensure that GPU resources are being used effectively across different users and workloads.
What’s new in NVDashboard v0.10?
NVDashboard v0.10 is now updated for JupyterLab v4 and later, featuring architectural improvements and performance upgrades beyond mere compatibility fixes:
- Enhanced performance with WebSockets
- User-centric monitoring and usability enhancements
- UX improvements for a cohesive experience
Enhanced performance with WebSockets
The most notable enhancement in NVDashboard v0.10 is the transition from REST API to WebSockets for data communication. This pivotal upgrade is designed to meet the high demands of real-time monitoring, with data points updating every 50-100 ms.
The persistent connection offered by WebSockets significantly reduces the overhead of establishing new connections for each data request, leading to better resource utilization and a seamless experience across devices, including those with limited capabilities.
User-centric monitoring and usability enhancements
NVDashboard v0.10 introduces play/pause functionality and a seekbar for time-series charts, empowering you with precise control over your data-monitoring experience. These features enhance the ability to interact with data, providing a more intuitive and user-friendly interface.
UX improvements for a cohesive experience
The latest version of NVDashboard boasts significant UX improvements, including theme support that ensures the extension’s appearance adapts to JupyterLab’s light or dark mode.
Synced tooltips across multiple dashboard components offer a unified view of data, enhancing your ability to analyze and understand complex relationships between different GPU utilization metrics.
Theme compatibility
The seamless integration of NVDashboard with JupyterLab themes is significant for consistency in UI, accessibility and comfort, which directly impact the user experience.


Brushing feature for time-series charts
The new brushing feature introduced in NVDashboard enables you to interactively select and inspect specific time ranges on GPU Resources time series charts. This feature enhances the ability to analyze GPU performance and identify potential bottlenecks during particular periods of code execution.

Synced tooltips
NVDashboard now features synchronized tooltips across multiple time series charts, enabling you to view the corresponding data points on all charts simultaneously by hovering over any single data point. This integration minimizes the need for extensive mouse movement, streamlining the analysis of stats across different charts.
For example, hovering over a timestamp in the GPU utilization chart simultaneously displays tooltips for GPU memory and PCI Throughput charts at that same timestamp.
Installation
To experience the full range of improvements and new features, install NVDashboard v0.10 using PyPI and Conda with the following commands:
# PYPI

pip install jupyterlab_NVDashboard
# CONDA

conda install -c rapidsai -c conda-forge jupyterlab-NVDashboard
Conclusion
The release of NVDashboard v0.10 represents a significant milestone in our journey to provide the best possible tools for JupyterLab users. With enhanced performance, improved usability, and a host of new features, we are excited to see how our community uses these updates to push the boundaries of what’s possible with JupyterLab and NVDashboard.
For those looking to contribute or delve deeper into the development of NVDashboard, the updated Developer Guide and resources are available on the /rapidsai/juyterlab-NVDashboard GitHub repo. We encourage our community to explore, contribute, and provide feedback to help continue improving NVDashboard.
For more information about application profiling and performance optimization, see NVIDIA Nsight Systems.

