This post was originally published on the RAPIDS AI blog here.
Introduction
NVDashboard is an open-source package for the real-time visualization of NVIDIA GPU metrics in interactive Jupyter Lab environments. NVDashboard is a great way for all GPU users to monitor system resources. However, it is especially valuable for users of RAPIDS, NVIDIA’s open-source suite of GPU-accelerated data-science software libraries.
Given the computational intensity of modern data-science algorithms, there are many cases in which GPUs can offer game-changing workflow acceleration. To achieve optimal performance, it is absolutely critical for the underlying software to use system resources effectively. Although acceleration libraries (like cuDNN and RAPIDS) are specifically designed to do the heavy lifting in terms of performance optimization, it can be very useful for both developers and end-users to verify that their software is actually leveraging GPU resources as intended. While this can be accomplished with command-line tools like nvidia-smi, many professional data scientists prefer to use interactive Jupyter notebooks for day-to-day model and workflow development.
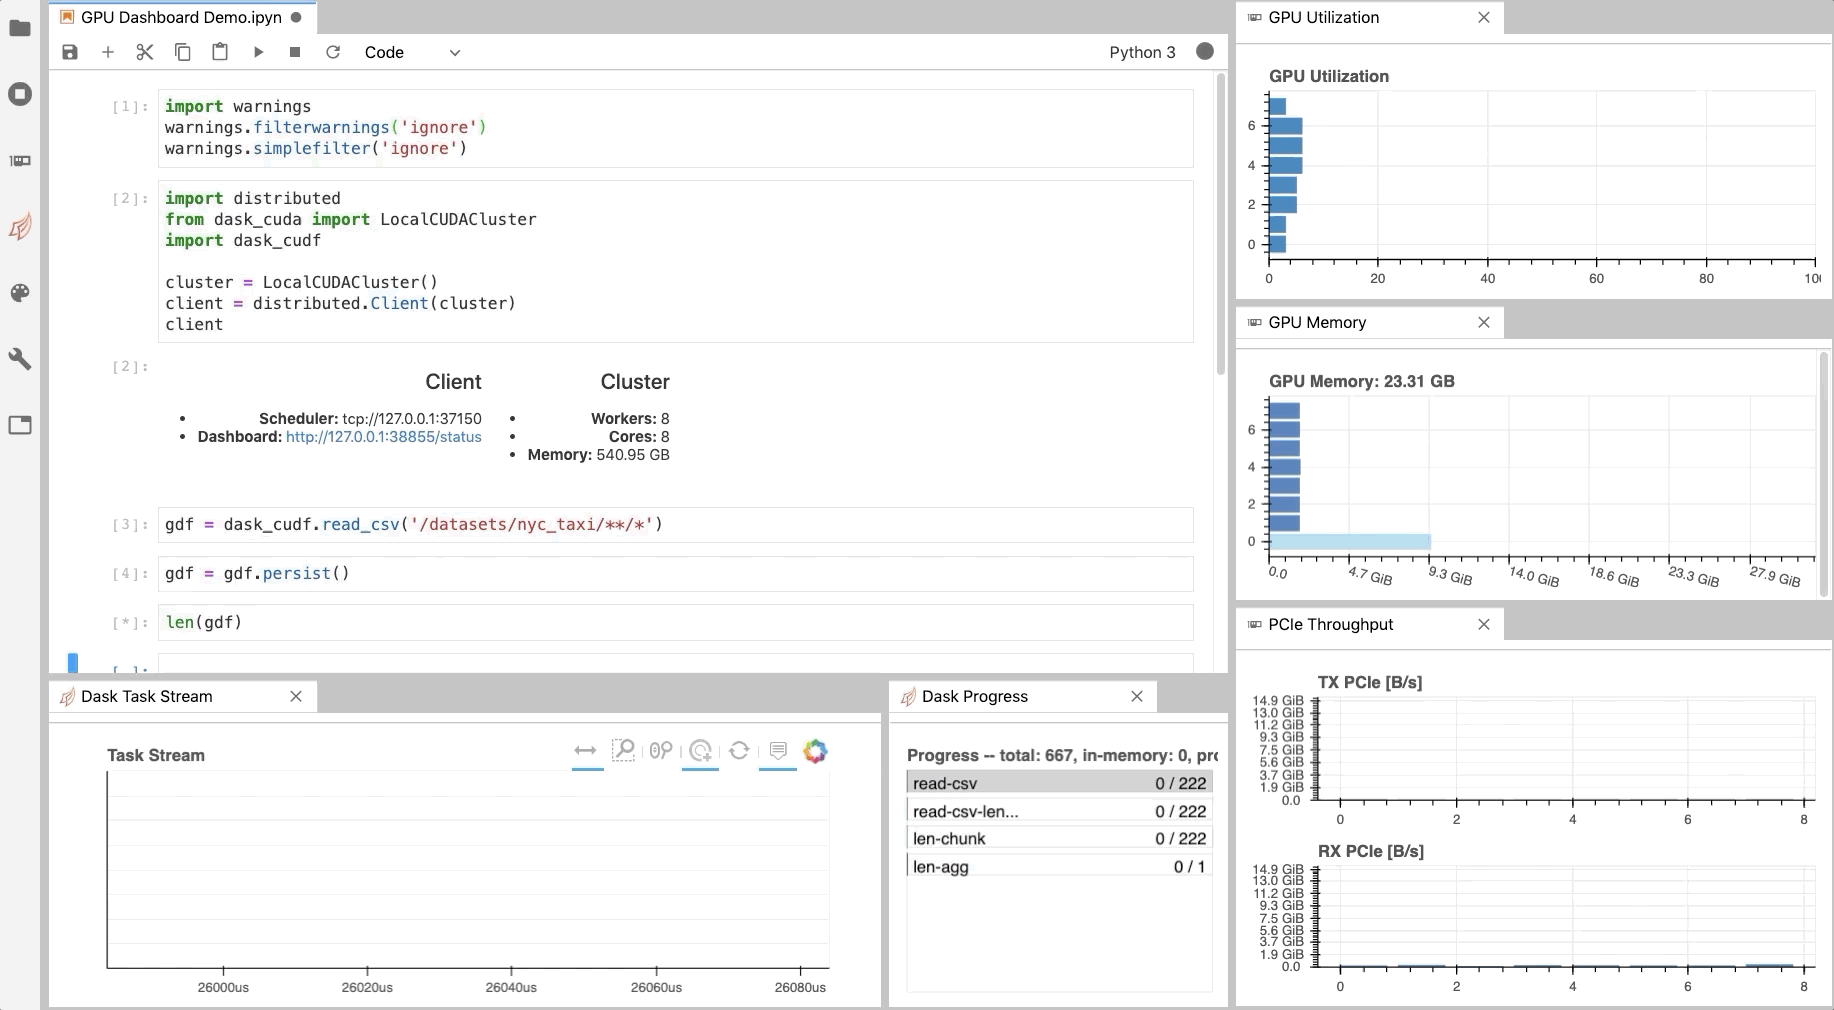
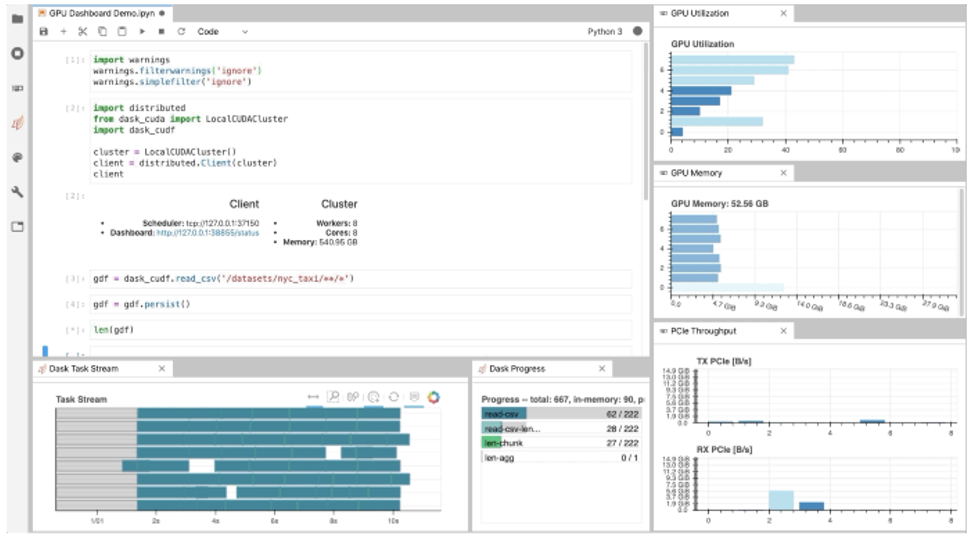
As illustrated in Fig. 1, NVDashboard enables Jupyter notebook users to visualize system hardware metrics within the same interactive environment they use for development. Supported metrics include:
- GPU-compute utilization
- GPU-memory consumption
- PCIe throughput
- NVLink throughput
The package is built upon a Python-based dashboard server, which support the Bokeh visualization library to display and update figures in real time[1] . An additional Jupyter-Lab extension embeds these dashboards as movable windows within an interactive environment. Most GPU metrics are collected through PyNVML, an open-source Python package composing wrappers for the NVIDIA Management Library (NVML). For this reason, the available dashboards can be modified/extended to display any queryable GPU metrics accessible through NVML.
Using NVDashboard
The nvdashboard package is available on PyPI, and consists of two basic components:
- Bokeh Server: The server component leverages the wonderful Bokeh visualization library to display and update GPU-diagnostic dashboards in real time. The desired hardware metrics are accessed with PyNVML, an open-source python package composing wrappers for the NVIDIA Management Library (NVML). For this reason, NVDashboard can be modified/extended to display any queryable GPU metrics accessible through NVML, easily from Python.
- Jupyter-Lab Extension: The Jupyter-Lab extension makes embedding the GPU-diagnostic dashboards as movable windows within an interactive Jupyter-Lab environment.
$ pip install jupyterlab-nvdashboard

# If you are using Jupyter Lab 2 you will also need to run
$ jupyter labextension install jupyterlab-nvdashboard

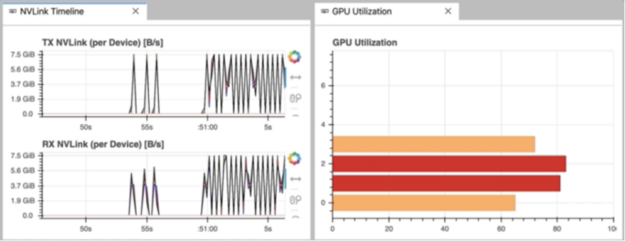
It is important to clarify that NVDashboard automatically monitors the GPU resources for the entire machine, not only those being used by the local Jupyter environment. The Jupyter-Lab eExtension can certainly be used for non-iPython/notebook development. For example, in Fig. 3, the “NVLink Timeline” and “GPU Utilization” dashboards are being used within a Jupyter-Lab environment to monitor a multi-GPU deep-learning workflow executed from the command line.
The Boker server
While the Jupyter-Lab extension is certainly ideal for fans of iPython/notebook-based development, other GPU users can also access the dashboards using a sandalone Bokeh server. This is accomplished by running.
$ python -m jupyterlab_nvdashboard.server <port-number>
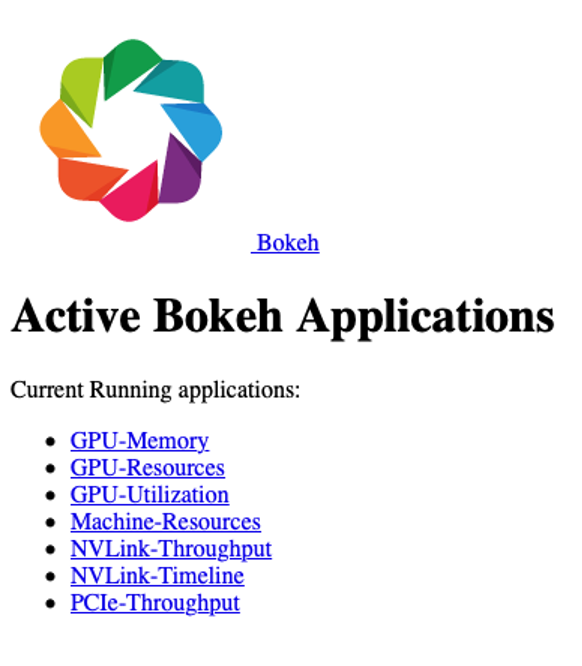
After starting the Bokeh server, the GPU dashboards are accessed by opening the appropriate url in a standard web browser (for example, http://<ip-address>:<port-number>). As shown in Fig. 4, the main menu lists all dashboards available in NVDashboard.
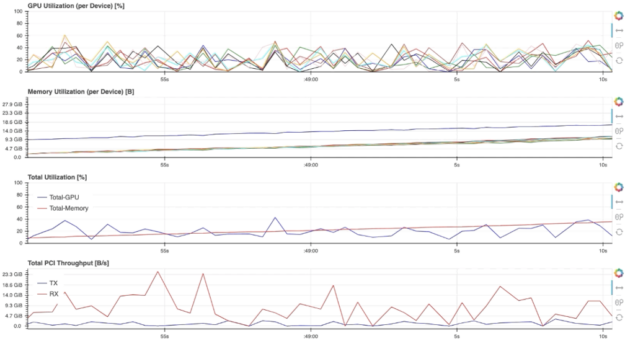
For example, selecting the “GPU-Resources” link opens the dashboard shown in Fig. 5, which summarizes the utilization of various GPU resources using aligned timeline plots.
To use NVDashboard in this way, only the pip-installation step is needed (the lab extension installation step can be skipped):
$ pip install jupyterlab-nvdashboard
Alternatively, one can also clone the jupyterlab-nvdashboard repository, and simply execute the server.py script (for example, python jupyterlab_nvdashboard/server.py <port-number>).
Implementation details
The existing nvdashboard package provides a number of useful GPU-resource dashboards. However, it is fairly straightforward to modify existing dashboards and/or create completely new ones. In order to do this, you simply need to leverage PyNVML and Bokeh.
PyNVML dasic
PyNVML is a python wrapper for the NVIDIA Management Library (NVML), which is a C-based API for monitoring and managing various states of NVIDIA GPU devices. NVML is directly used by the better-known NVIDIA System Management Interface (nvidia-smi). According to the NVIDIA developer site, NVML provides access to the following query-able states (in additional to modifiable states not discussed here):
- ECC error counts: Both correctable single bit and detectable double bit errors are reported. Error counts are provided for both the current boot cycle and for the lifetime of the GPU.
- GPU utilization: Current utilization rates are reported for both the compute resources of the GPU and the memory interface.
- Active compute process: The list of active processes running on the GPU is reported, along with the corresponding process name/id and allocated GPU memory.
- Clocks and PState: Max and current clock rates are reported for several important clock domains, as well as the current GPU performance state.
- Temperature and fan speed: The current core GPU temperature is reported, along with fan speeds for non-passive products.
- Power management: For supported products, the current board power draw and power limits are reported.
- Identification: Various dynamic and static information is reported, including board serial numbers, PCI device ids, VBIOS/Inforom version numbers and product names.
Although several different python wrappers for NVML currently exist, we use the PyNVML package hosted by GoAi on GitHub. This version of PyNVML uses ctypes to wrap most of the NVML C API. NVDashboard utilizes only a small subset of the API needed to query real-time GPU-resource utilization, including:
nvmlInit(): Initialize NVML. Upon successful initialization, the GPU handles are cached to lower the latency of data queries during active monitoring in a dashboard.nvmlShutdown(): Finalize NVML- nvmlDeviceGetCount(): Get the number of available GPU devices
nvmlDeviceGetHandleByIndex(): Get a handle for a device (given an integer index)nvmlDeviceGetMemoryInfo(): Get a memory-info object (given a device handle)nvmlDeviceGetUtilizationRates(): Get a utilization-rate object (given a device handle)nvmlDeviceGetPcieThroughput(): Get a PCIe-throughput object (given a device handle)nvmlDeviceGetNvLinkUtilizationCounter(): Get an NVLink utilization counter (given a device handle and link index)
In the current version of PyNVML, the python function names are usually chosen to exactly match the C API. For example, to query the current GPU-utilization rate on every available device, the code would look something like this:
In [1]: from pynvml import *
In [2]: nvmlInit()
In [3]: ngpus = nvmlDeviceGetCount()
In [4]: for i in range(ngpus):
…: handle = nvmlDeviceGetHandleByIndex(i)
…: gpu_util = nvmlDeviceGetUtilizationRates(handle).gpu
…: print(‘GPU %d Utilization = %d%%’ % (i, gpu_util))
…:
GPU 0 Utilization = 43%
GPU 1 Utilization = 0%
GPU 2 Utilization = 15%
GPU 3 Utilization = 0%
GPU 4 Utilization = 36%
GPU 5 Utilization = 0%
GPU 6 Utilization = 0%
GPU 7 Utilization = 11%
Note that, in addition to the GitHub repository, PyNVML is also hosted on PyPI and Conda Forge.
Dashboard Code
In order to modify/add a GPU dashboard, it is only necessary to work with two files (jupyterlab_bokeh_server/server.py and jupyterlab_nvdashboard/apps/gpu.py). Most of the PyNVML and bokeh code needed to add/modify a dashboard will be in gpu.py. It is only necessary to modify server.py in the case that you are adding or changing a menu/display name. In this case, the new/modified name must be specified in routes dictionary (with the key being the desired name, and the value being the corresponding dashboard definition):
routes = {
   "/GPU-Utilization": apps.gpu.gpu,
   "/GPU-Memory": apps.gpu.gpu_mem,
   "/GPU-Resources": apps.gpu.gpu_resource_timeline,
   "/PCIe-Throughput": apps.gpu.pci,
   "/NVLink-Throughput": apps.gpu.nvlink,
   "/NVLink-Timeline": apps.gpu.nvlink_timeline,
   "/Machine-Resources": apps.cpu.resource_timeline,
}
In order for the server to constantly refresh the PyNVML data used by the bokeh applications, we use bokeh’s ColumnDataSource class to define the source of data in each of our plots. The ColumnDataSource class allows an update function to be passed for each type of data, which can be called within a dedicated callback function (cb) for each application. For example, the existing gpu application is defined like this:
Note that the real-time update of PyNVML GPU-utilization data is performed within the source.data.update() call. With the necessary ColumnDataSource logic in place, the standard GPU definition (above) can be modified in many ways. For example, swapping the x and y axes, specifying a different color palette, or even changing the figure from an hbar to something else entirely.
Users should feel free to open a pull request to contribute valuable improvements/additions — Community engagement is certainly encouraged!
