This post was originally published on the Mellanox blog.
Let’s talk about network streaming telemetry and why you need it. Have you ever had problems trying to re-create issues or had a tough time figuring out why you were seeing packet loss? Maybe you are a network admin who has been blamed for an application outage or a server or storage performance issue. If any of that sounds familiar, you need good network telemetry. Because the network enables applications to be accessed, share data, and connect to storage, good network streaming telemetry is also good application telemetry.
Some of you may be asking, what is telemetry?
What is telemetry?
When you’re driving a car, telemetry is the speedometer, tachometer, gas gauge, oil pressure gauge, engine temperature, and dashboard warning lights. That’s all the data you need to get you safely to where you want to go and to know how the car is doing along the way. Whether you are driving a car or flying a plane, you need good telemetry, and the faster you travel, the more critical it is.
The same is true if you are running a data center, deploying VMs and containers, or managing a storage deployment. You need visibility into what’s going on inside the network fabric. And the faster your network runs, or the more critical network performance is to your business, the more important that becomes. Switch streaming telemetry can give you that crucial visibility.
Shift from protocols to streaming telemetry
The legacy position on network management has been that more is better: more protocols, more packets captured, and—in case of a problem—more deep digging through captured packets to find the cause and then the fix. But over the last several years there’s been a trend in data center networks towards simplification. The larger, or more advanced the data center, the fewer the protocols they like to run.
Back in my tech support days, we used to have a saying that, “The smarter the customer, the shorter the config file.” The customers who always had trouble seemed to be those who enabled every possible feature and protocol. You could estimate the number of problems by the length of the config files. I’ve seen this trend to move to more L3 and away from L2 and all the versions of spanning tree, and band-aids like root guard, loop guard, BPDU guard, and the rest.
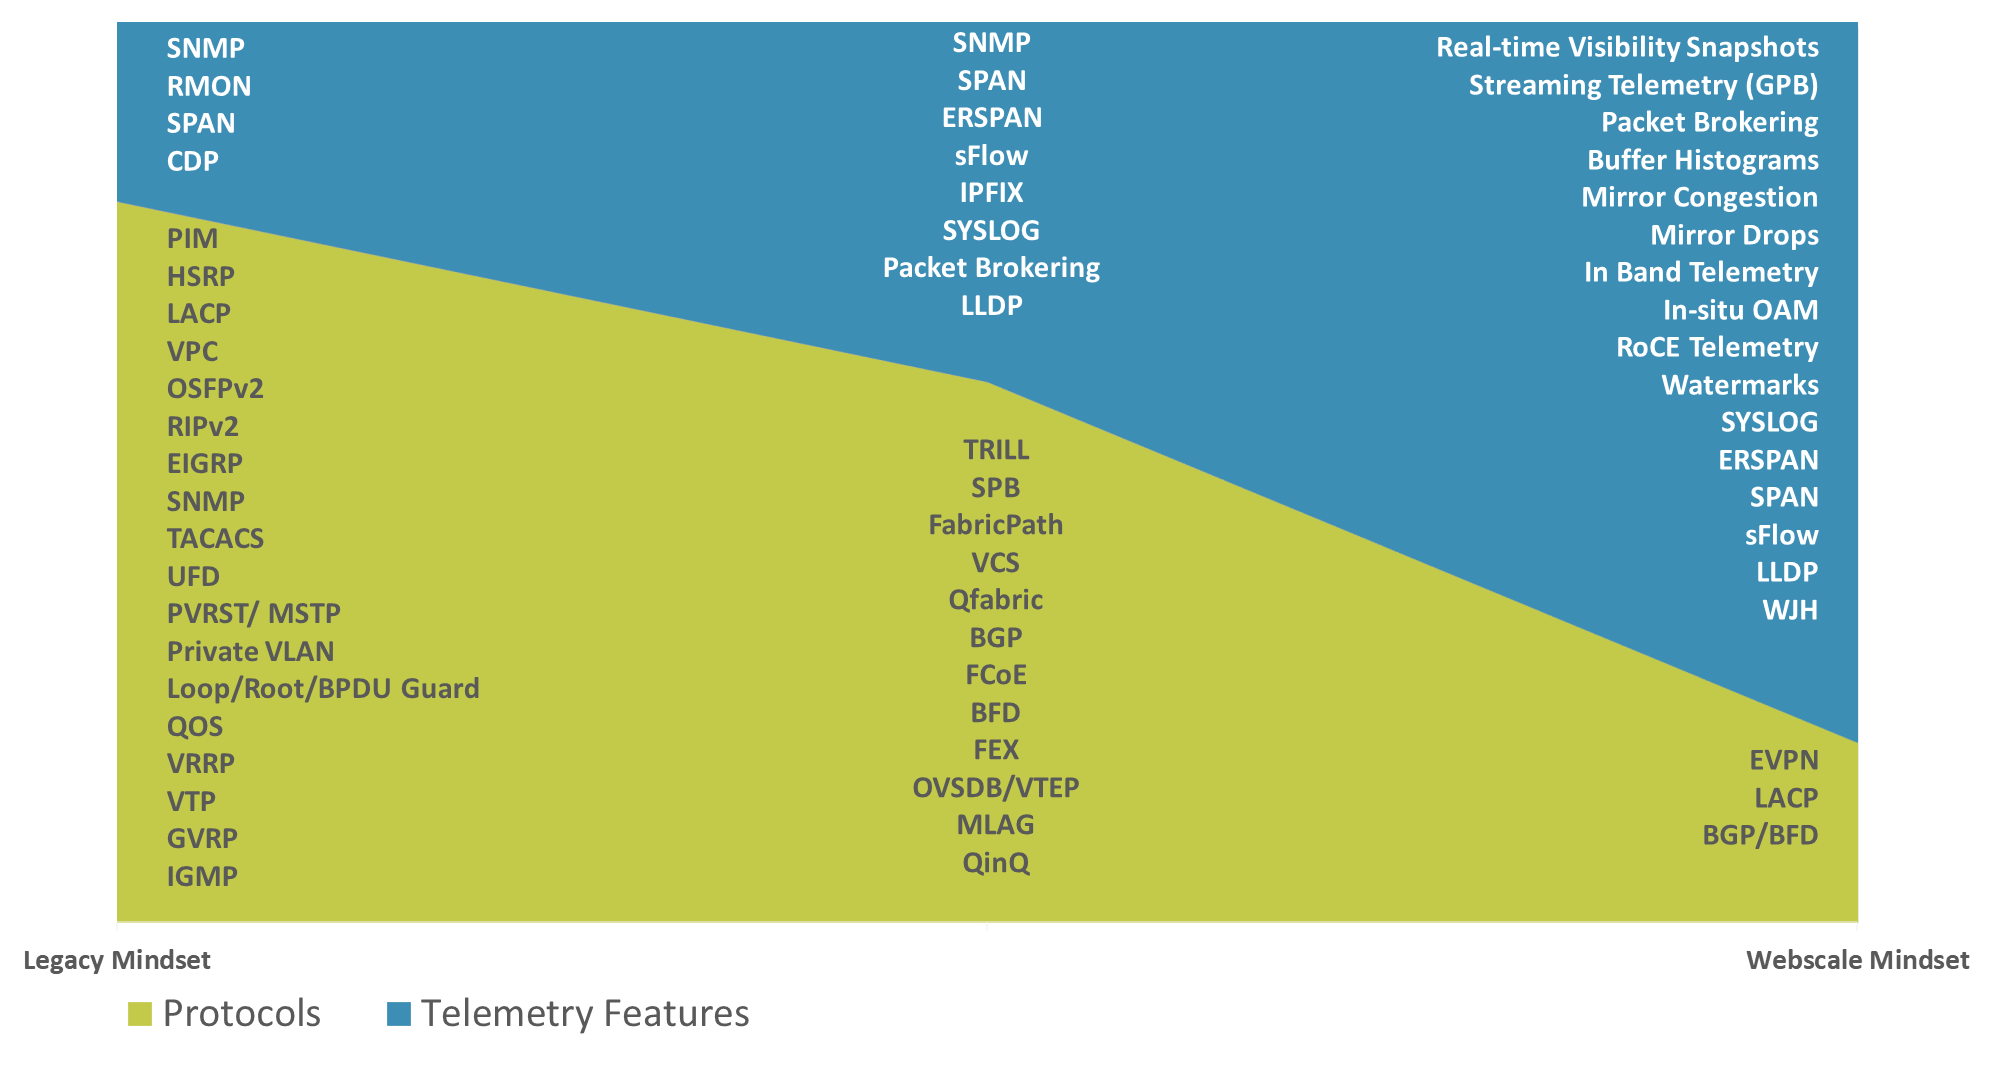
The main exception to the simplification trend is the need for more visibility, as smart folks want to see what’s going on inside their network. As the networks gets larger and faster, savvy administrators are using fewer protocols but aiming for more network telemetry to achieve better visibility.
Some network admins want better streaming telemetry to improve their “mean time to innocence.” They want to speed up the time to find the root cause of issues so they can rule out whatever is NOT causing the problem and prove if it’s really the server team’s fault (or maybe the storage teams’ fault).
Others are trying to get more out of their network. Most network teams don’t really know if their networks are under-used or over-used because they have poor visibility into what’s really going on. Without that understanding, it’s impossible to run the network efficiently or to grow it properly.
WJH is a switch-level monitoring solution where the switch ASIC monitors flows at line rate and alerts you if you had performance problems due to packet drops, congestion events, routing loops, and so on.
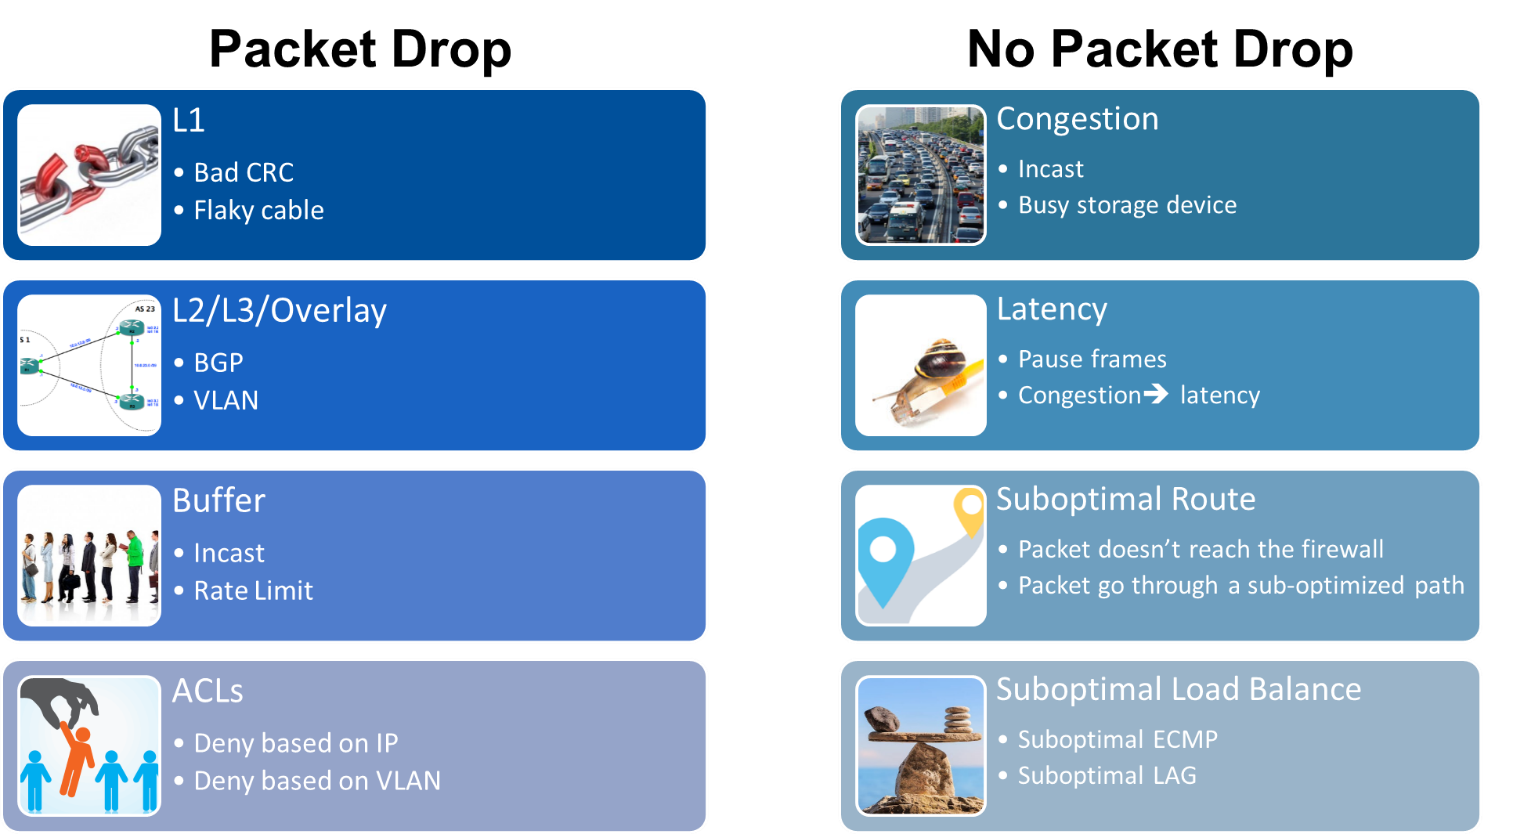
For example, if you’re dropping packets because of a bad cable or bad optic, WJH shows you those dropped packets and tell you why they were dropped. WJH alerts you to congestion, buffer problems, or even security issues. For example, if you’re hitting a bunch of ACLs, and they’re dropping packets, you’d like to know why, because you might have a corrupted server or VM. Or, you might have a poorly configured ACL that’s causing problems.
In lossless environments, like NVMe over Fabrics (NVMe-oF) running on RoCE, you might have performance problems even though you are not dropping packets. The performance issues could be due to congestion issues, excessive pause frames, or latency issues. It’s common to find out that the root cause is uneven load balancing across a LAG or ECMP group. Whether your problem is packet drops or poor performance without packet drops, WJH was built to get to the bottom of those things and give you the best streaming telemetry for superior network visibility.
Pretty much every network in the world is going to have some packet drops. Sometimes it’s for bad reasons and sometimes it’s for good reasons. Many other switch telemetry solutions don’t deliver enough data to diagnose and solve problems. When a non-NVIDIA switch drops a packet, that packet is sent to bit heaven, never to be seen again. The packet, and all that useful diagnostic information, just disappears.
The most those switches do is increment a vague counter. When you check that counter, the switch says, “Oh, you’ve now dropped 504 packets, due to a bad VLAN.” Those switches don’t tell you anything about the packet that was dropped, when it was dropped, or why it was dropped–just that it was dropped. You don’t know if the packet was dropped because the switch was misconfigured, because the server was misconfigured, or something else completely.
Other switch or network management solutions perform statistical sampling of packets from every port on every switch. This produces a staggeringly large boatload of packets but not all the problem packets, so it doesn’t record when, why, or how a packet was lost. It also doesn’t properly explain how congestion started, what caused unacceptably high latency, or why traffic might have become unbalanced or been misrouted. When a problem is suspected, you have to sort through huge piles of saved packets and try to extrapolate (or guess) what really happened and why.
In these cases, you simultaneously have too much data (too many sampled packets) and yet not enough information (not enough details about the problem packets). Everything on the network becomes suspect and determining what really happened can take many hours. There is a better way!
How does WJH work?
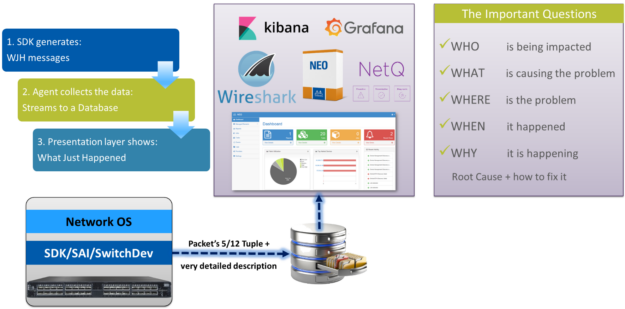
NVIDIA What Just Happened (WJH) is a hardware-accelerated telemetry technology where the switch ASIC holds onto important parts of dropped packets. The switch won’t keep the whole packet or all the normal packets, as that would consume a lot of space, for little benefit.
Instead, the switch keeps the important parts of the problem packet like the source and destination IP address, MAC, port numbers, and so on, along with some detailed descriptions of why, when, and where it was dropped. Because the switch is involved, it knows which packets to save and why those packets were dropped, too slow, or misrouted. With hardware acceleration, the switch can record all the relevant packets along with important details, even while driving many ports of 25, 40, 50, or 100 (soon 200) Gigabit Ethernet.
For small deployments, you can log into the switch and quickly see what’s going wrong in your network. For larger deployments, WJH can stream these packets out to a centralized database using gRPC. This works with turnkey solutions like NVIDIA NEO and, because it’s in a standard database, it works with open source tools like Kabana and Grafana.
If you are a network expert, or have been to Sniffer University, and want to look at the actual packet capture, the switch can generate a p.cap file of all the dropped packets so you can look at it using Wireshark. WJH helps to get to the bottom of problems, by showing who’s being impacted, which applications, which servers, what’s causing the problem, when and where the problem is in your network.
A new hope in network telemetry
WJH is a new way of monitoring a network. Traditional network monitoring tools collect tons of innocent data and counters. They may even use sFlow to sample random packets, with the idea that you’re collecting all this information to guess what went wrong in your network.
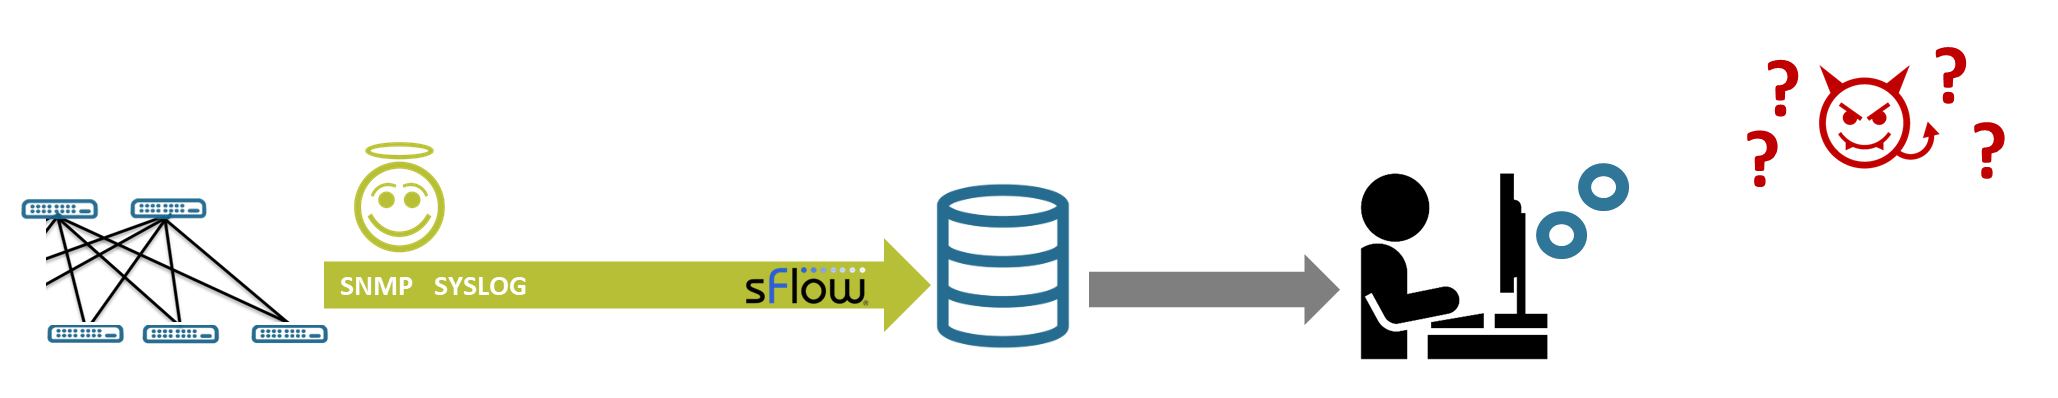
For some reason, the trickiest network problems usually occur at night or on the weekend. Then you’ve got to leave dinner or your family time to sift through a mountain of data and find the root cause. You try to guess what’s the culprit that’s causing all the trouble. There are even predictive analytics tools that might give you a 60 -70% confidence level that they’ve found the root cause. At the end of the day, it’s still just guesswork. The problem is that you have too much data (from packet sampling) but often not the most important data (what, where, when, and why).
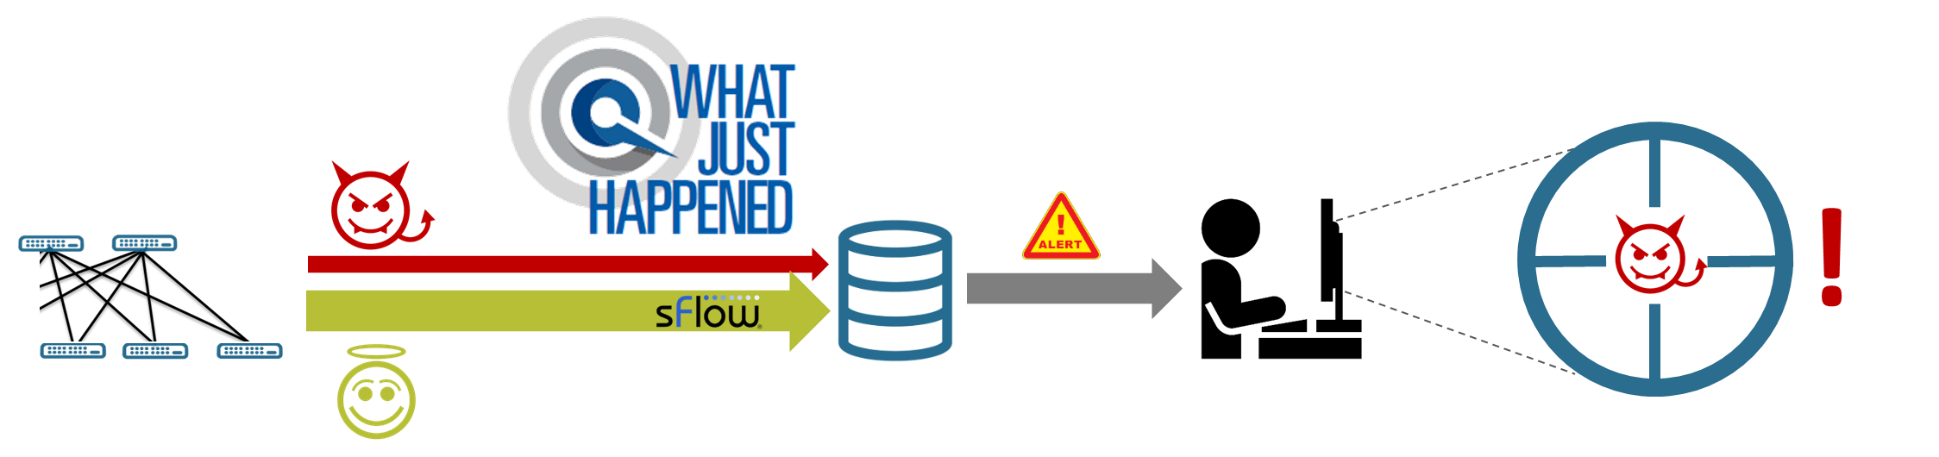
WJH is a new way of monitoring a network that focuses on data plane anomalies, built to give you back your evenings and weekends. WJH quickly shows you both the victims and the packet troublemakers or bandwidth bullies in your network. You can keep collecting those huge piles of data about innocent devices and events and try to crunch them, but WJH gives you the actual root cause, recorded firsthand by the switch that had to drop the packet.
No more problem/re-creation drama!
WJH also breaks the problem/re-create cycle:
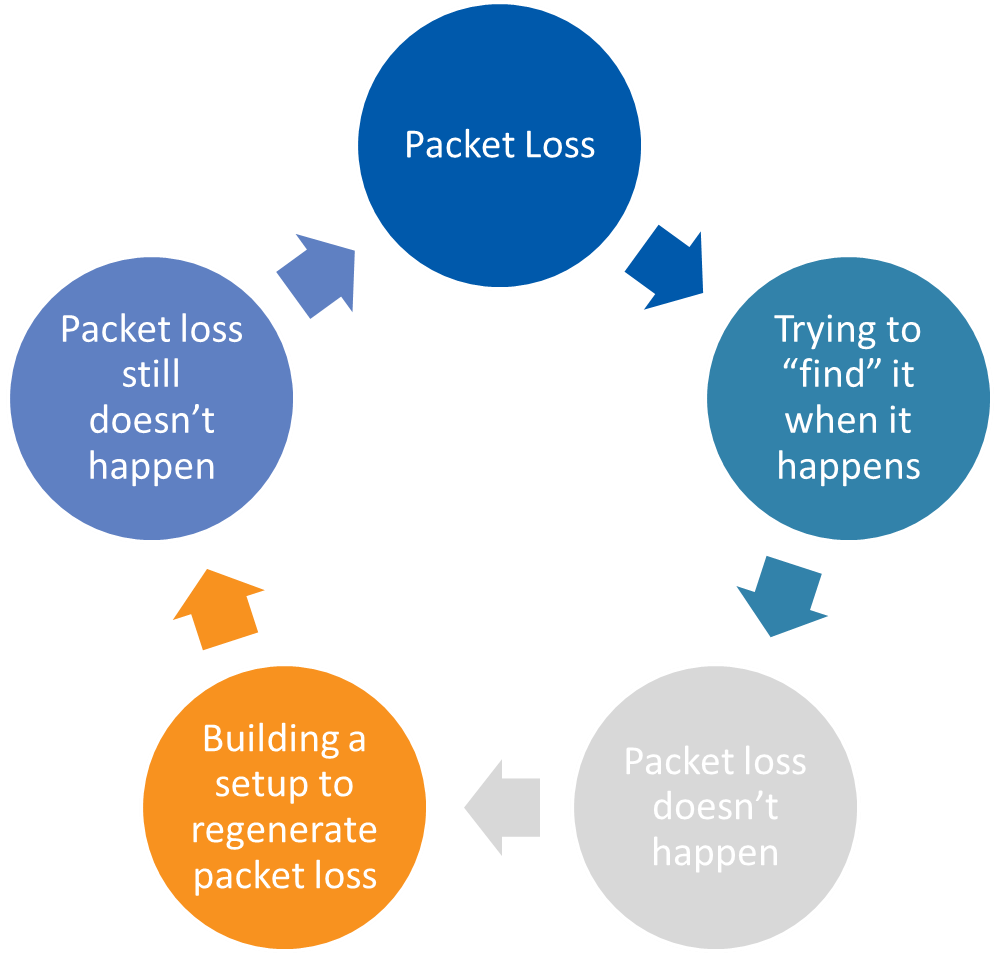
The old approach of guessing when a problem will re-occur and set up a recreation scenario on a test bed or packet trace only to have the problem not reveal itself, so you retry the next week… and the week after…. This was the impetus for WJH: advanced telemetry technology. Because WJH holds on to those packets that are getting dropped and reports on them, it helps you get to the root cause. WJH gives you network visibility without needing to reproduce issues to resolve them.
How to deploy WJH?
Now I know some of you might be thinking, “This sounds amazing, but I can’t replace my entire network with NVIDIA switches.” The great thing about WJH is that it works independently of the rest of the network. WJH running on one switch can report errors that are likely happening on other switches in that tier of the network doing a similar function. This is different than InBand telemetry, which works best with all switches from the same vendor.
It’s super simple to get started with WJH.
WJH deployment
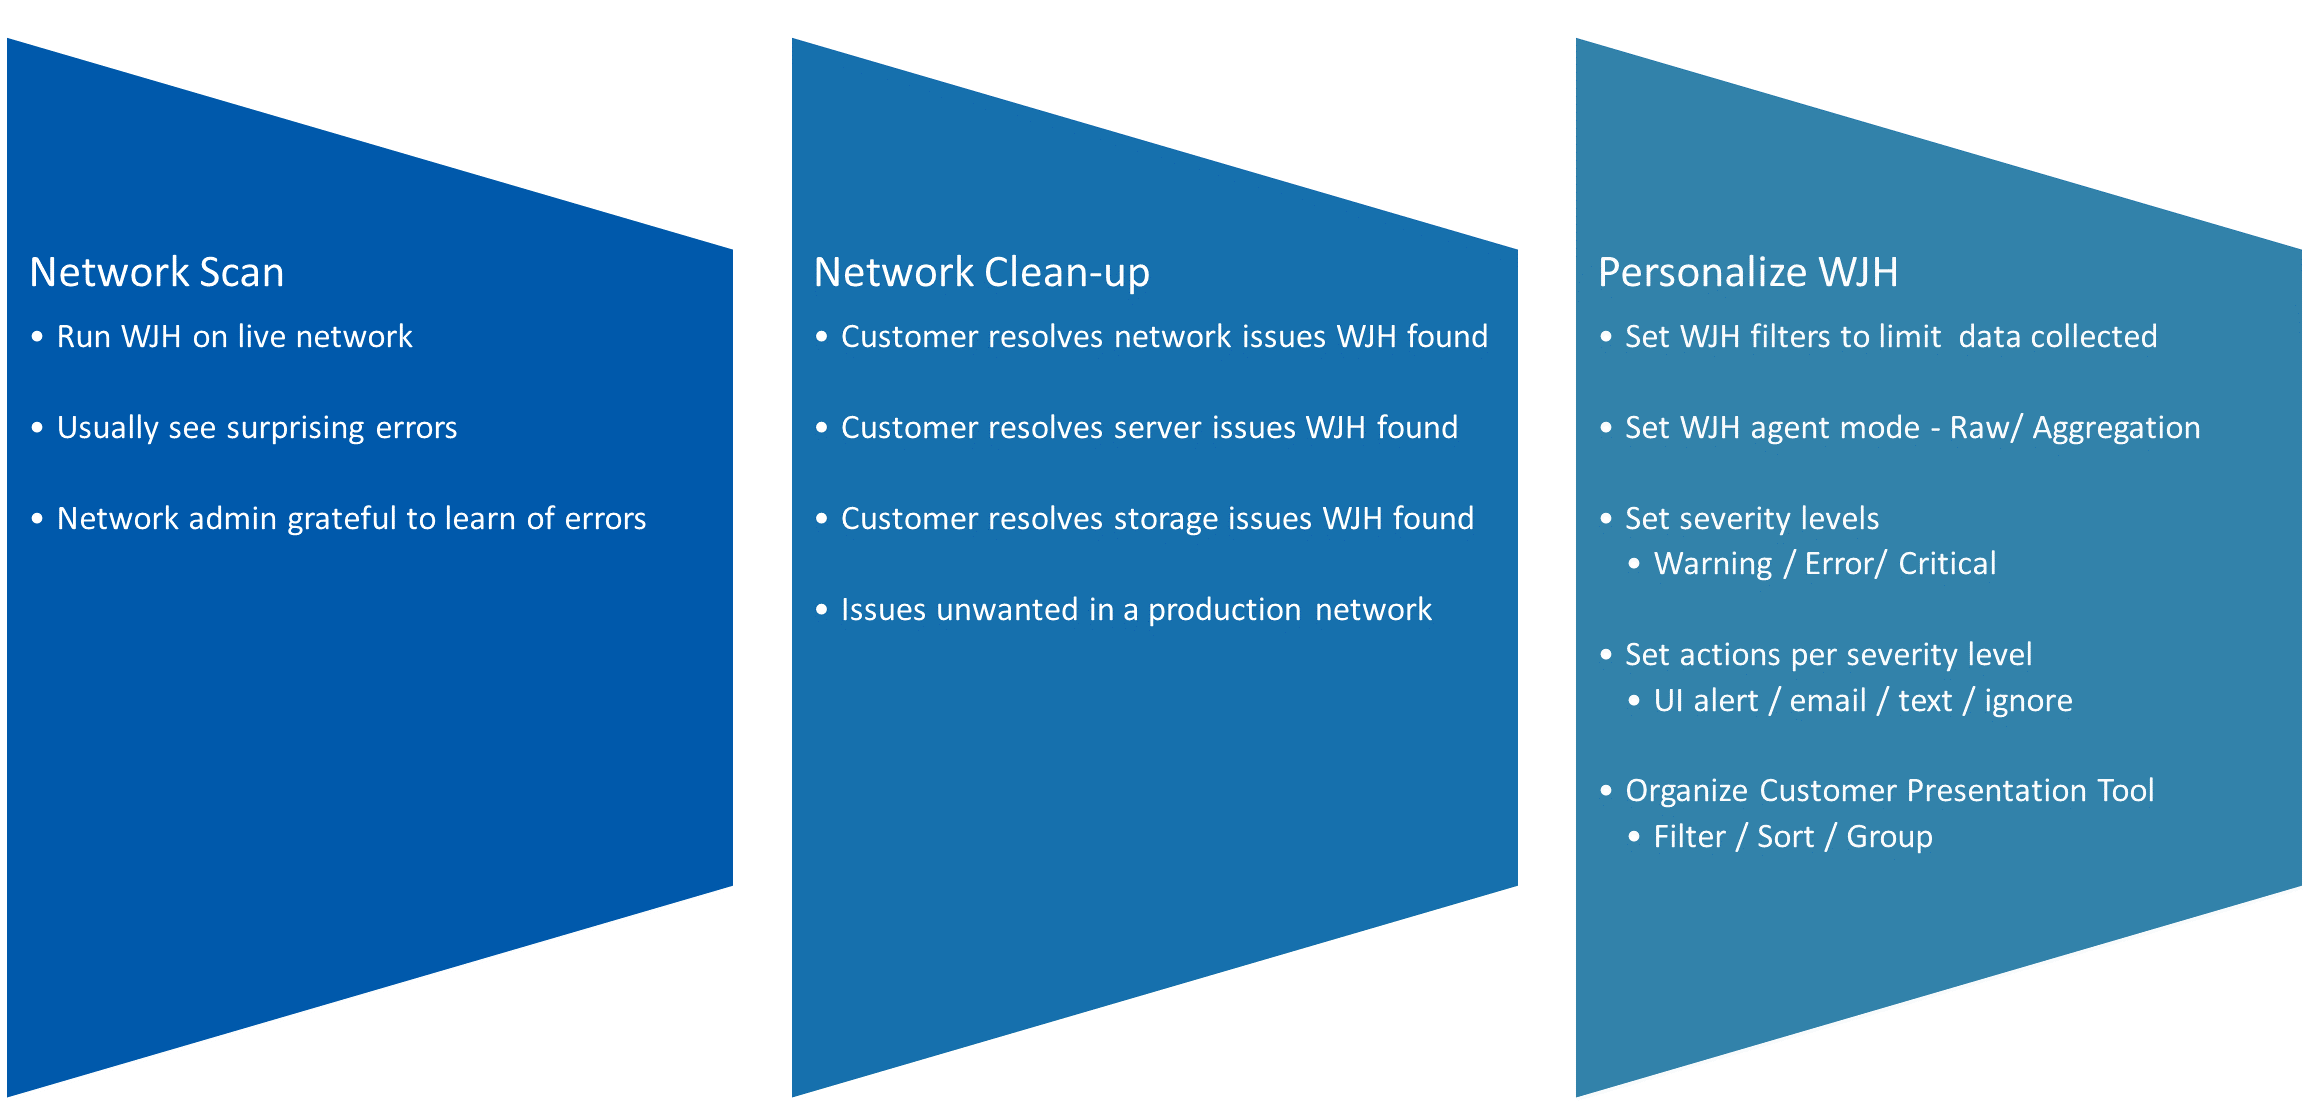
Step 1
Most people start using WJH by doing a network scan, which is done by enabling WJH on a switch they have plugged into their production network. People are almost always surprised at the kind of errors that they learn about. The network admin is super happy to learn what’s going on in the network. So step one is just turn on WJH and see what’s really going on in your network.
Step 2
Next is the clean-up phase, where people resolve the network issues that WJH found as well as the server issues and the storage issues that WJH found.
Step 3
This is where you personalize WJH for your network and your management needs:
- You might set some filters because you don’t need to report certain kinds of “normal” errors or even want to log or store it
- You might set the WJH agent to aggregation mode if the kinds of issues tend to show up in 1000s of the exact same packet. Aggregation mode stores just one copy of that problem packet instead of 1000 identical problem packets.
- You might set the severity level of issues that matter to you. Some might be critical and require immediate notification, while others you could check later, or even ignore.
- You can set actions of the severity levels. For example, you might want a text sent on critical issues, an email on significant issues, and no alerts on minor issues.
Summary
WJH is a great tool for advanced network-heads as well as the network novice who just wants a simple way to identify network issues from server and storage issues. With WJH, you don’t have to be a network expert to quickly find the root causes of performance problems.
Advanced streaming telemetry technology is good for your business. It helps you get more performance, uptime, and productivity out of the networks that you you’ve paid for.
