
NVIDIA NetQ is a highly scalable, modern networking operations tool providing actionable visibility for the NVIDIA Spectrum Ethernet platform. It combines advanced telemetry with a user interface, making it easier to troubleshoot and automate network workflows while reducing maintenance and downtime.
We have recently released NetQ 4.2.0, which includes:
- Simplified events management
- Enhanced flow telemetry analysis
- New RoCE validation
- New DPU monitoring
For more information about new features and enhancements, see the NetQ 4.2.0 User’s Guide.
Simplified events management
With NetQ 4.2, we have simplified the way network events are communicated through the interface. Events vary in terms of severity—some events are network alarms that may require further investigation, while others are informational notices that may not require intervention. Before this release, NetQ displayed alarms and information events as two separate cards. The NetQ 4.2 release merges the two cards into a single card that, when expanded, displays a dashboard to help you quickly visualize all network events.
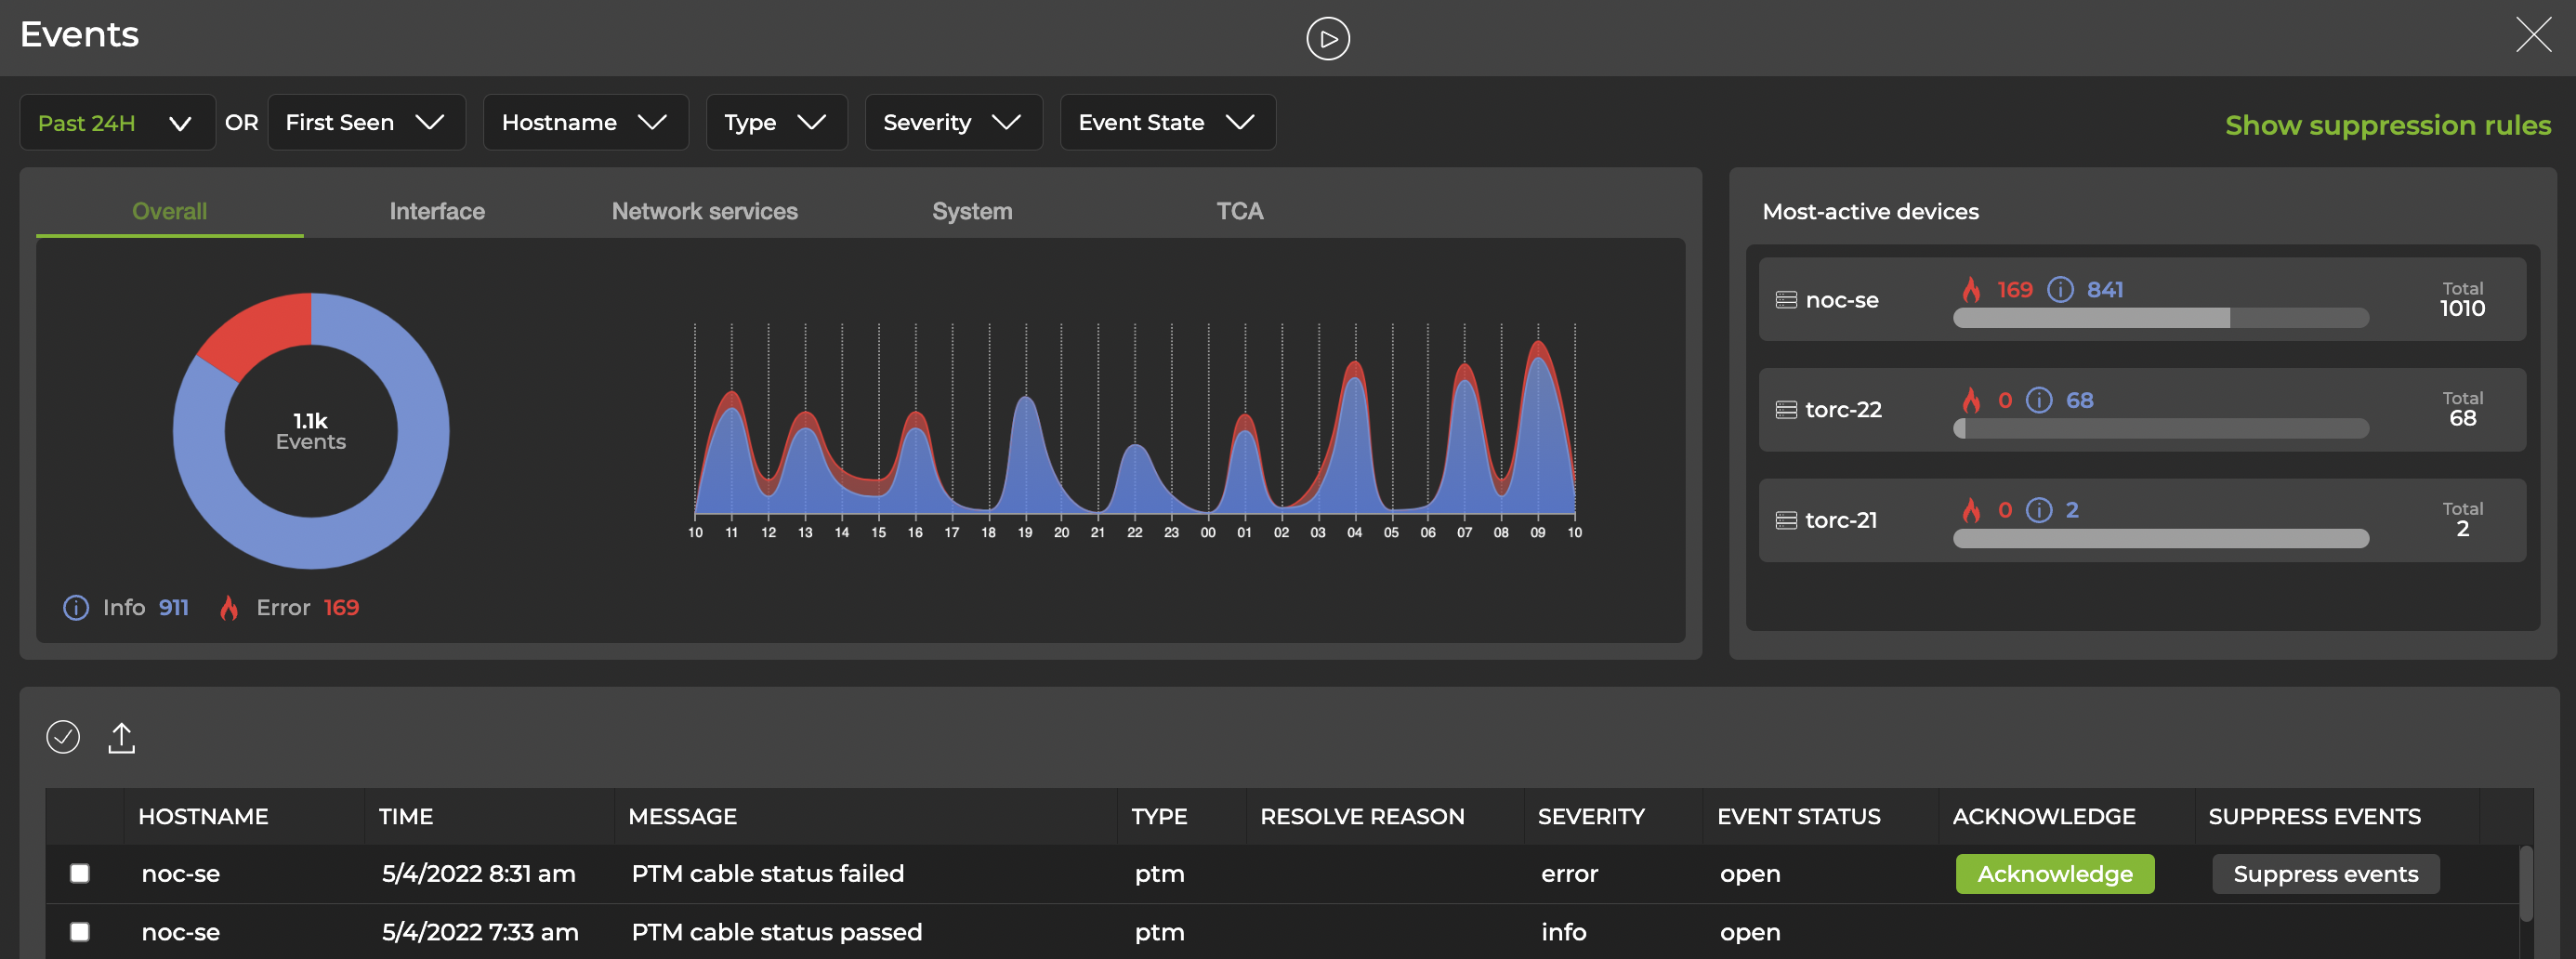
The dashboard presents a timeline of events alongside the switches that are causing the most events. You can filter events by type, including interface, network services, system, and threshold-crossing events.
Acknowledging events helps you focus on active events that need your attention. From the dashboard, you can also create rules to suppress events. This feature is also designed to help you focus on active events, so that known issues or false alarms are not displayed in the same way that errors are displayed.
Enhanced flow telemetry analysis
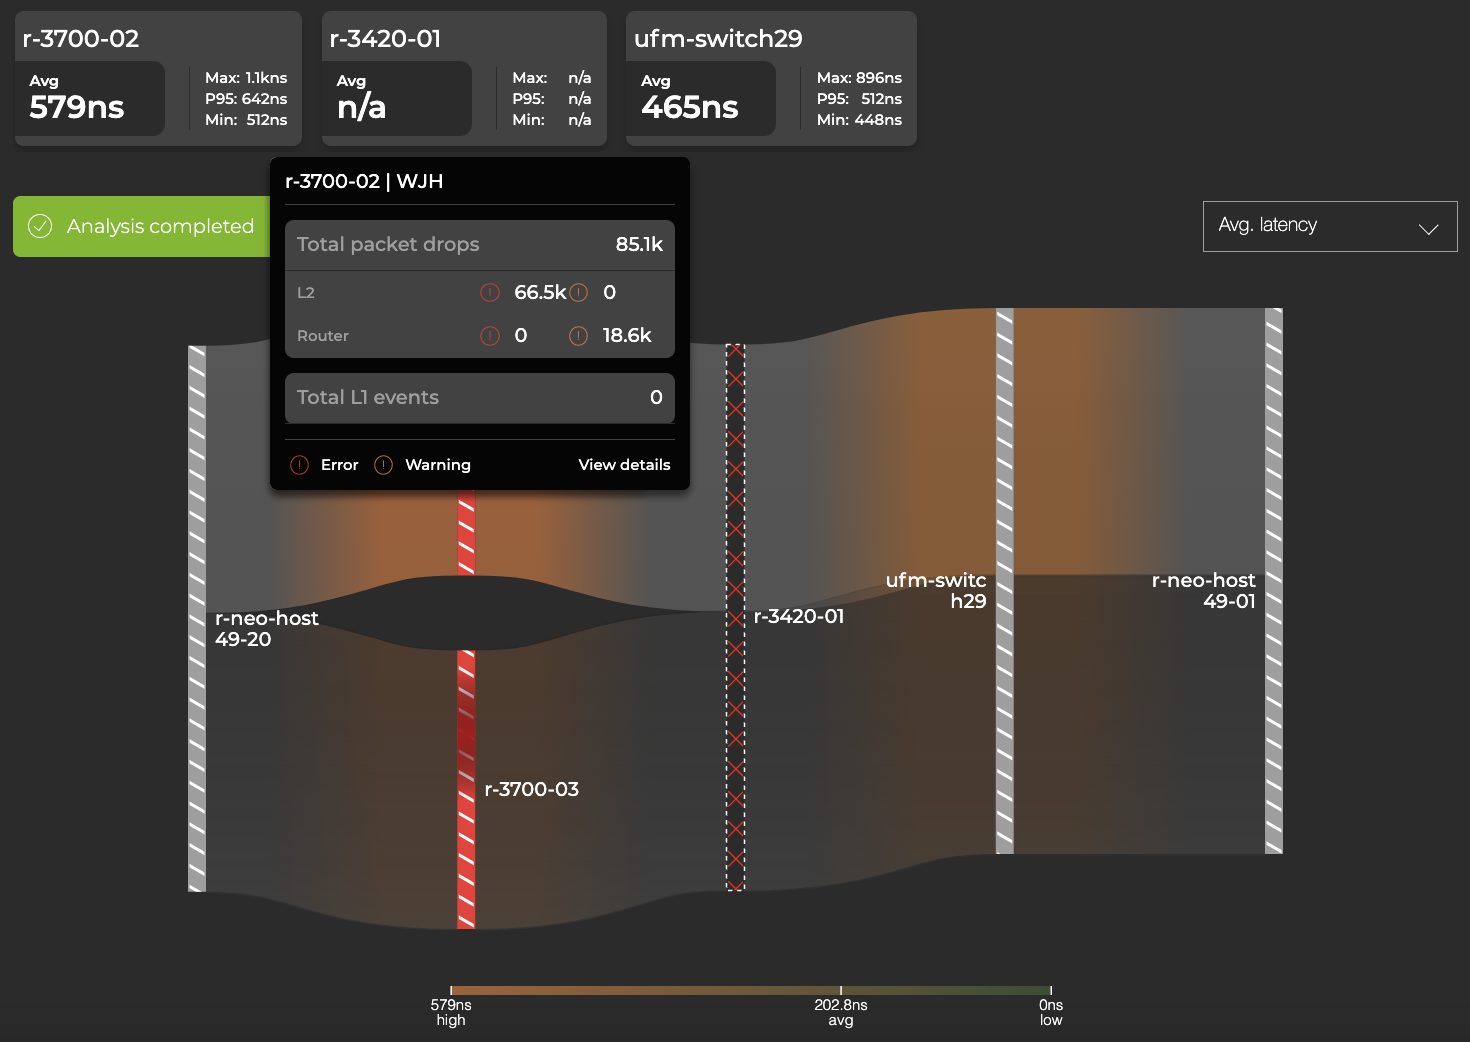
NetQ 4.1.0 introduced fabric-wide network latency and buffer occupancy analysis for Cumulus Linux 5.x data center fabrics. Now, NetQ 4.2 supports partial-path flow telemetry analysis in mixed fabrics—those that use Cumulus Linux 5.x switches in combination with other switches (including non-Cumulus Linux 5.x and third-party switches). Cumulus Linux 5.x devices in the path display flow statistics, such as latency and buffer occupancy. Unsupported devices are represented in the flow analysis as a black bar with a red X, and the device does not display flow statistics.
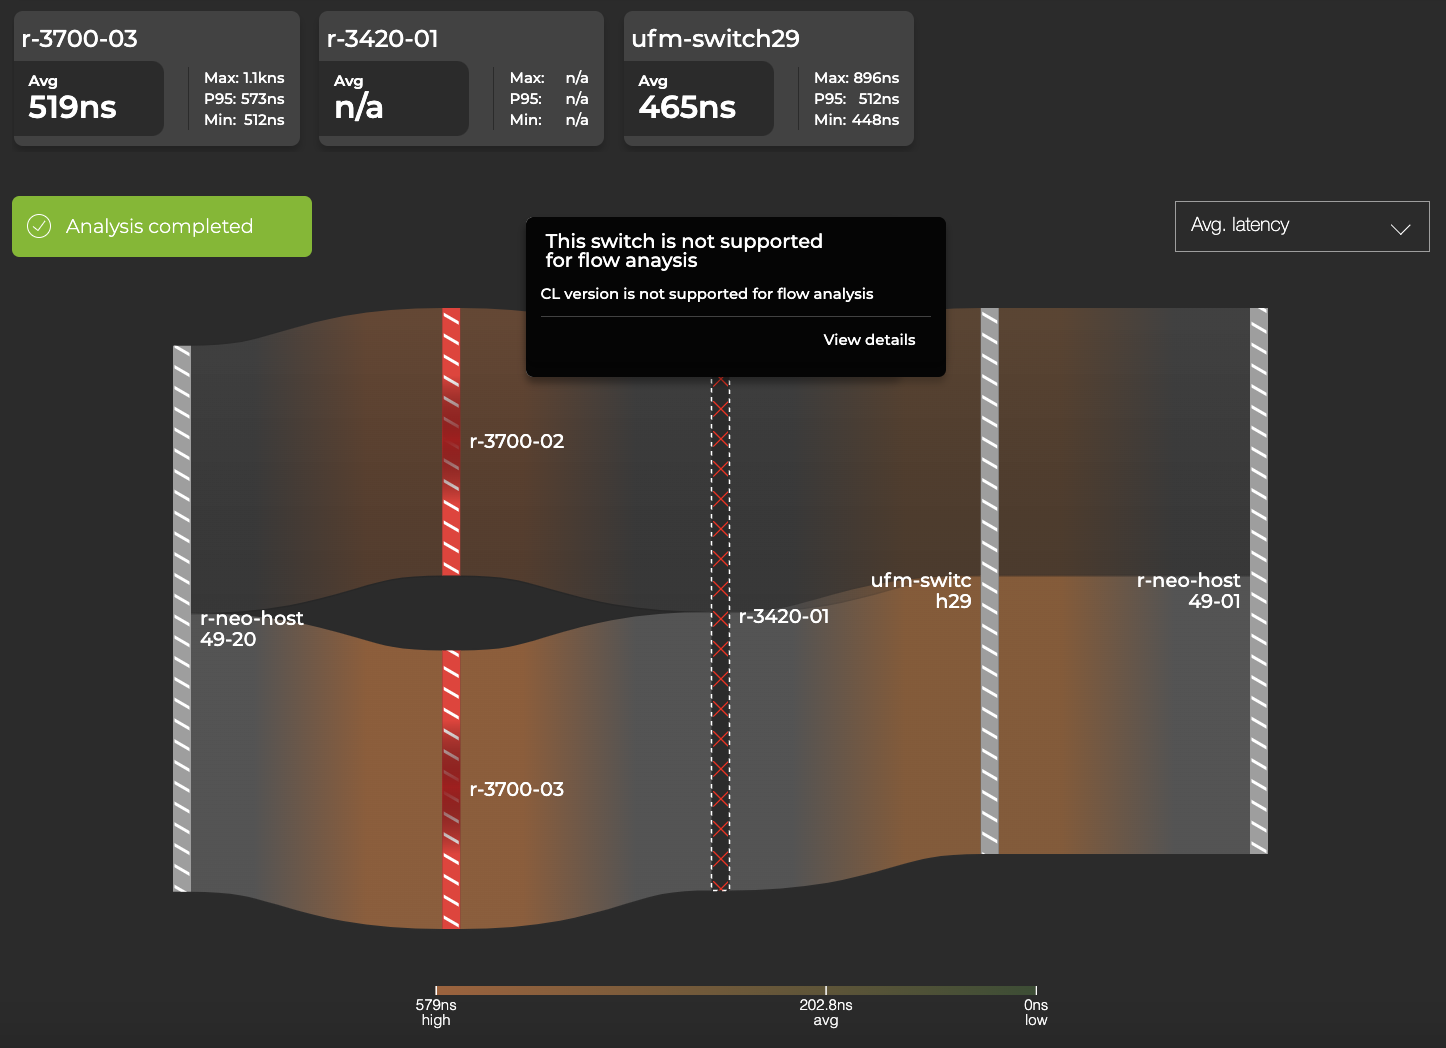
In addition, NetQ 4.2 flow telemetry analysis shows contextual ‘What Just Happened’ (WJH) events and drops for the flow under analysis. Switches with WJH events are represented in the flow analysis graph as a red, striped bar. Hovering over the device with the red bar presents a WJH events summary.
New RoCE validation
With RDMA over Converged Ethernet (RoCE), you can write to compute or storage elements using remote direct memory access (RDMA) over an Ethernet network instead of using host CPUs. NetQ 4.0.0 introduced RoCE configuration and counters, including the ability to set up various RoCE threshold-crossing alerts (TCAs).
With NetQ 4.2.0, RoCE validation checks:
- Lossy- or lossless-mode configuration consistency across switches
- Consistency of DSCP, service pool, port group, and traffic class settings
- Consistency of ECN threshold settings
- Consistency of PFC configuration for lossless mode
- Consistency of Enhanced Transmission Selection settings
You can schedule RoCE validation to run periodically or on-demand.
New DPU monitoring
NVIDIA BlueField data processing units (DPUs) provide a secure and accelerated infrastructure for any workload by offloading, accelerating, and isolating a broad range of advanced networking, storage, and security services.
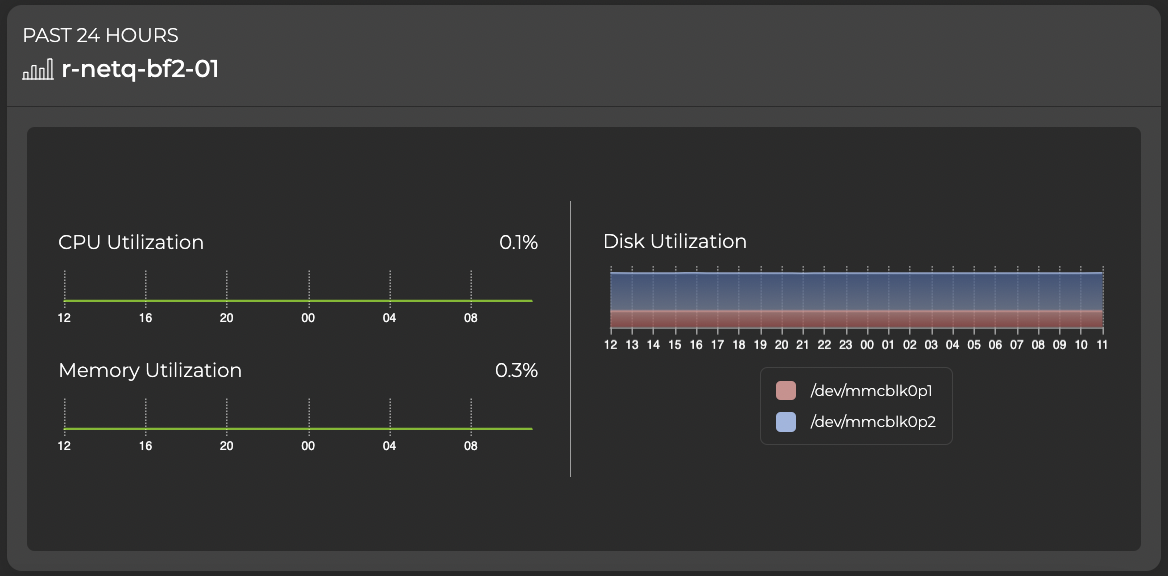
NetQ helps you monitor your DPU inventory across the network. You can monitor a DPU OS, ASIC, CPU model, disk, and memory information to help manage upgrades, compliance, and other planning tasks. With NetQ, you can view and monitor key DPU attributes, including installed packages and CPU, disk, and memory utilization.
In this post, you have seen an overview of some of the new capabilities available with NetQ 4.2.0. For more information, see the NetQ 4.2.0 User’s Guide and explore NetQ with NVIDIA Air.
