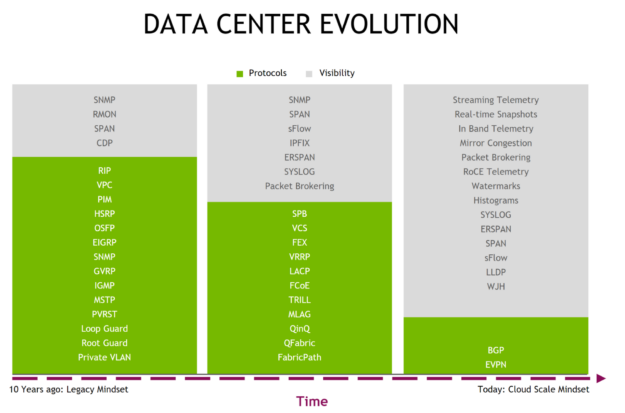
EVPN has become the standard solution for modern data center fabrics. To end users, EVPN offers the flexibility of extending their broadcast domains while benefiting from the stability of BGP-based control planes. However, these extra benefits come at a price of increased configuration complexity.
No longer are we dealing with relatively flat, simple network configurations that can be visually analyzed by a human to spot any errors. The real, production EVPN configuration may include multiple, deeply nested structures that grow proportionally to the number of tenants in the fabric.
EVPN configuration complexity can and must be addressed by a proper automation solution that would reduce the likelihood of a manual error and NVIDIA Cumulus Linux has just the right solution for that. However, automation alone is not enough, errors can still get introduced into the system through the data source, for example, human error in configuration management database (CMDB).
The importance of observability
This is why, for any reasonably complex infrastructure, you should have a way to collect various types of logs, metrics, and debug outputs, aggregate, correlate, and process this information to try to infer the internal state of a system. The ability to do that is often referred to as the “observability” of a system and it’s becoming more and more critical as the complexity of the underlying infrastructure increases. This is an industry-wide trend that is proven by the ever-growing number of projects in the “Observability and Analytics” section of the CNCF cloud native landscape. This is also what we, at NVIDIA, strongly believe.
Network-wide observability with NetQ
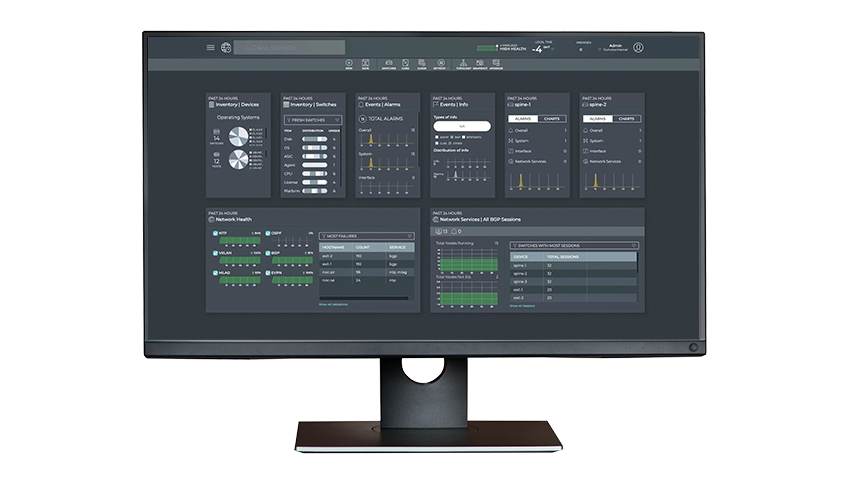
For a long time, the ability to look at a network as a whole was limited to the topological view—there were diagrams that would include variable levels of details, from physical links through L2 and L3 interfaces to control plane protocols. However, these diagrams, representing the high-level intent, were only as accurate as the people who maintained them. They could never reflect the actual state of the network which was contained in each individual device. NetQ was designed to address many of these problems and create a single pane of glass for the entire operational state of the network.
On the one hand, NetQ collects and aggregates many metrics from its remote agents that may be running on anything from a network switch to a general-purpose compute server. These metrics include but are not limited to, interface statistics and utilization, LLDP, MAC, ARP/ND and IP routing tables, control plane state for BGP, MLAG, and OSPF, as well as What Just Happened (WJH) events to help diagnose any data plane packet drops.
On the other hand, NetQ uses these metrics to infer the internal state of the network and make protocol-specific assertions. These checks range from simple MTU and link state consistency, through BGP and EVPN state validation, all the way to end-to-end connectivity tests.
Troubleshooting demo
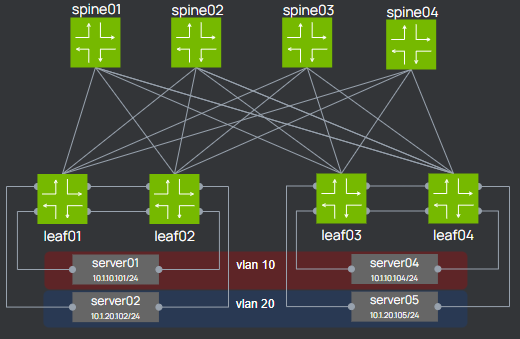
In this post, we demonstrate how to use NetQ to troubleshoot a few common configuration mistakes using the following topology. The leaves are configured as MLAG pairs and inside the fabric we’re running EVPN with symmetric IRB and PIM-based BUM replication.
Environment setup
This test topology can be spun up on the cloud-based infrastructure simulation platform called NVIDIA Air. For more information, see the NVIDIA Air User Guide.
- Choose Create a Simulation, Demo Marketplace, and Network Troubleshooting with NetQ card.
In the next few sections, we discuss each troubleshooting scenario and show how NetQ can help locate the source of the problem.
Scenario #1: Server01 is unable to communicate with Server02
The first issue is simple: both servers are attached to the same pair of leaf switches so that the number of places where things need to be checked is limited to the following:
- L1 and bond interface configuration of all server links
- MLAG state and configuration of the peerlink
- L3 and VRR interface configuration for vlan 10 and 20
With NetQ, all these checks can be done with just a few clicks.
- From the simulation page, choose Launch NetQ and enter the provided username and password.
- From the workbench header, select Validation and create a new MLAG validation.
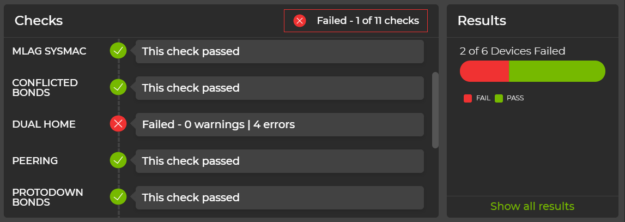
When the validation completes, NetQ finds four errors for dual-homed devices. For each of the unsuccessful checks, you can view additional details and see what NetQ thinks are the errors.
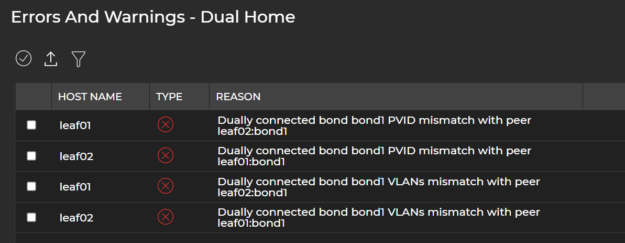
In this case, it clearly points at the VLAN configuration of interface bond1, which can now be quickly verified and corrected by logging in and comparing the configuration on both leaf switches.
Follow the lab guide to fix the issue and move on to the next one.
Scenario #2: Server01 is unable to communicate with Server04
The second scenario involves intra-VLAN communication over a VXLAN EVPN fabric. A typical troubleshooting procedure for this fault could involve the following steps:
- Confirm that all BGP sessions are Established and the EVPN address family is enabled for all peers.
- Verify that VLAN-to-VNI mapping is consistent on all four leaf switches
- Make sure that the required Type-2 routes are exported and imported using the same set of route targets.
- Check that BGP is configured to advertise all configured VNIs.
That is a number of values that must be compared across all leaf switches. Here’s how easy it is to check this information with NetQ.
- From the main workbench header, select Card and open the EVPN Sessions card.
- Open this card in a full-screen view and look at the All Sessions screen (Figure 5).
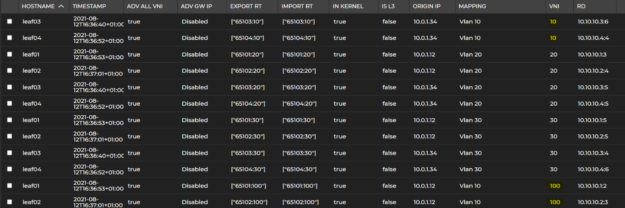
Here from a single screen, you can see all of the relevant values in a table format that can be sorted and filtered to narrow down the search. In this case, it’s easy to spot the difference in VNI mapping for Vlan10 between Leaf01/02 and Leaf03/04.
Follow the lab guide to fix the issue and move on to the next one.
Scenario #3: Server01 is unable to communicate with Server05
The last scenario involves inter-VLAN symmetric routing over VXLAN EVPN. The number of things you should verify has increased and now includes the following additional steps:
- Per-VRF BGP configuration and session state
- EVPN type-5 routes propagation between the leaf switches
- Check that the L3 VNI is configured consistently and has unique Router MAC per MLAG pair
- L3 VNI to VRF mapping across all switches
With NetQ EVPN validation, all these assumptions can be verified in a few seconds.
- From the main workbench header, select Validation and create a new on-demand EVPN validation. A few seconds later, you can see the result (Figure 6).
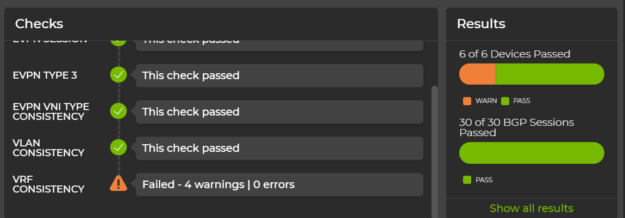
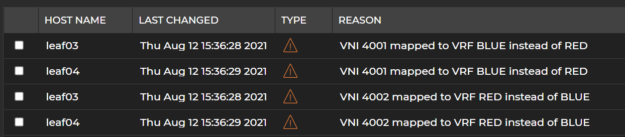
By clicking on VRF consistency warnings, you can clearly see where the error is. The entire time to resolution has been reduced to just a few seconds and the administrator can now proceed to rectify the VNI to VRF mapping on Leaf03/04.
Check the lab guide for the exact commands required to fix this issue.
Summary
In this post, you’ve seen the ability of NetQ to analyze and infer network state from various metrics it collects from the managed devices. The three scenarios demonstrate how root cause analysis can be reduced from minutes or hours to seconds using NetQ’s validation and protocol-specific cards. These validations can be run on-demand, scheduled to be run periodically, or even run in the past, thanks to the fact that all logs are stored in a time-series database.
The abilities of NetQ extend far beyond what was shown and discussed in this post and include things like device inventory, software lifecycle management, and threshold-based alarms and integrations with third-party platforms like Slack, PagerDuty, and Grafana. We continue to expand and add more features and third-party integrations so that NetQ can bring even more value to customers in the future.
