NetQ 4.1.0 was recently released, introducing fabric-wide network latency and buffer occupancy analysis along with many other enhancements. For more information about all the new capabilities, see the NetQ 4.1.0 User Guide.
This post covers the following features:
- Flow based fabric-wide latency and buffer occupancy analysis (new)
- What Just Happened (WJH) dashboard (new)
- Generic webhook notifications (new)
- Validation improvements
- gNMI streaming enhancements
Fabric-wide latency and buffer occupancy analysis
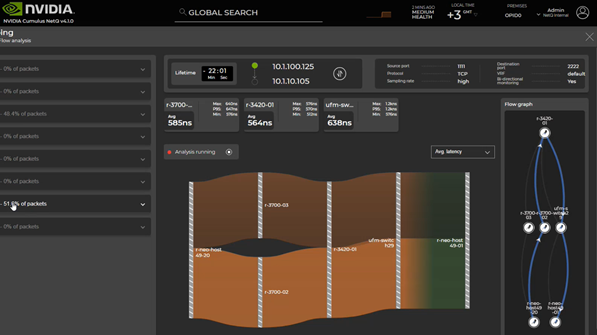
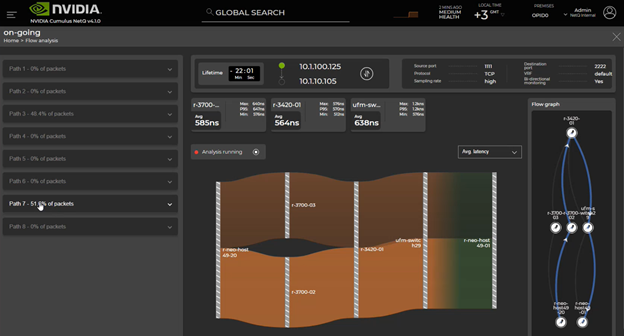
For the first time, NetQ offers network-wide fabric latency and buffer occupancy analysis by using the live application traffic to troubleshoot network issues impacting application performance. NetQ working with Cumulus Linux samples packets matching 4-tuple and 5-tuple application flow, analyzes, and reports per-switch latency (max, min, avg) and buffer occupancy details along the path of the flow.
The NetQ graphical user interface reports all the possible paths, paths in use, and per-path details (Figure 1). On each switch, you can see minimum latency, maximum latency, and average latency.
WJH is an always-on, full packet inspection, tool-detecting network issues at line rate with respect to packet drops, congestion, and latency issues. Working with WJH, flow telemetry is enabled on-demand for deep analysis and troubleshooting of traffic matching specific flows.
Using these capabilities together, network engineers can proactively identify and root cause server and application issues and inform the server or application administrator about the possible outage or performance impact.
How does this differ from sFlow?
NetQ flow-based telemetry enables you to select the flow for analysis using 5-tuple or 4-tuple information of the packet, including VXLAN inner or outer headers.
sFlow does not have this level of flexibility and normally monitors at a physical port level. sFlow also provides a specific device attribute without correlating to peer devices in the network and therefore does not have the capability to provide data to build a network topology.
How does this differ from traceroute?
In the case of traceroute, the host generates a packet that runs through the network for collecting the trace data. NetQ flow telemetry analysis uses the actual application packets to build the data of the trace. The data you get from flow-based telemetry includes latency and buffer occupancy provided by the hardware. Traceroute returns ping-level accuracy of the latency, which is much less accurate than hardware-level latency.
How does this differ from in-band flow analysis?
In-band flow analysis is intrusive in nature as each hop adds metadata to the packets in the data plane. This creates network overhead. NetQ flow-based telemetry does not alter the data plane packet structure.
What Just Happened events dashboard
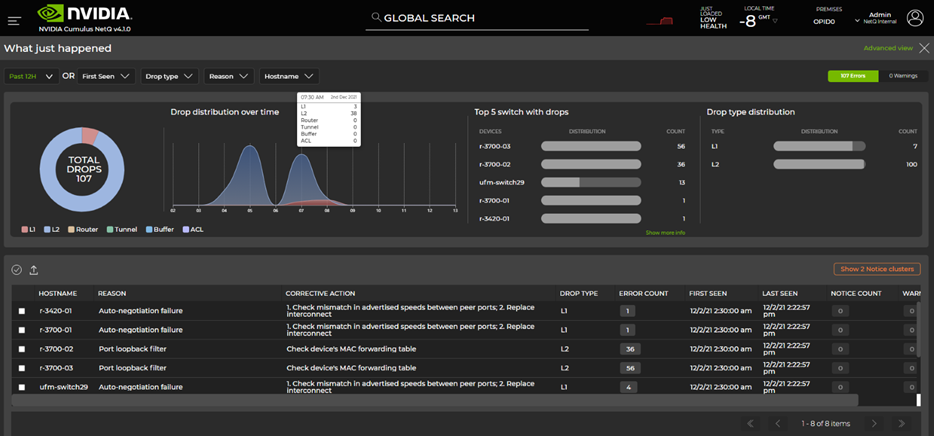
The new What Just Happened (WJH) dashboard introduced with NetQ 4.1 presents a timeline view of WJH events, top switches generating WJH events, top event types, and more. This enables you to quickly absorb insights from WJH Events data collected from all the switches in the fabric. WJH event details can be used to trigger flow telemetry analysis described earlier.
Here’s how to get the most out of WJH: Learn, clean, and personalize.
Learn
Collect WJH events from all switches centrally into NetQ. This enables you to see what is happening in your network with respect to drops, congestion, ACLs, and other protocols. NetQ dashboards are organized by drop category:
- L1
- L2
- Router
- Tunnel
- Buffer
- ACL
Clean
WJH reports issues that inform network, server, and storage admins. Resolve the network issues identified by WJH in priority order.
Personalize
Set WJH filters on NetQ to receive only selected WJH events going forward. For example, you may not want to receive ACL drops until the next revision of ACL updates. This reduces the volume of events to what matters to you.
NetQ also offers flexibility in receiving specific event types or events with a specified severity. NetQ also offers to set up threshold-crossing alerts on WJH events that can be integrated with tools like PagerDuty, Slack, and other notification tools.
Validation enhancements
In the production network, NetQ validations provide insight into the live state of the network and help with proactive monitoring and troubleshooting. As part of NetQ 4.1.0, validation checks are re-architected, resulting in significant performance improvements.
- Hourly network validation checks can be enabled or disabled depending on protocols running in your data center fabric.
- Global validation check filters applied to hourly network validation checks with NetQ 4.1.0 enable network admins to establish a clean network validation state matching what’s running in the network.
When this baseline is established, it is easy to detect any deviations using NetQ.
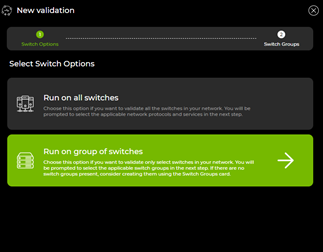
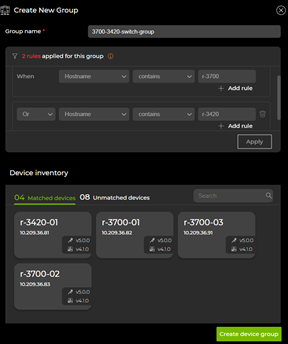
In NetQ 4.1, a grouping concept has been added to create multiple validation scopes within a site. Using this, customers with multiple fabrics in a single site can run per-fabric on-demand and scheduled validations.
gNMI streaming enhancements
NetQ 4.1.0 supports gNMI, the gRPC network management interface, to collect WJH data from the NetQ Agent on SONiC in addition to Cumulus Linux. For Cumulus Linux switches, system resource and interface counters can be streamed using gNMI. YANG Model details are available in the User Guide.
Generic webhook notification support
NetQ 4.1.0 introduced support for generic webhook notifications in addition to email, syslog, PagerDuty, and Slack event notification distribution options. Generic webhook enables NetQ to integrate with custom applications using event payload information in JSON format.
Summary
In this post, you’ve seen an overview of the new capabilities available with NetQ 4.1.0. You can further explore NetQ 4.1.0 using NVIDIA Air. For more information, see Troubleshooting Networks with NetQ.