The 11.2 CUDA C++ compiler incorporates features and enhancements aimed at improving developer productivity and the performance of GPU-accelerated applications.
The compiler toolchain gets an LLVM upgrade to 7.0, which enables new features and can help improve compiler code generation for NVIDIA GPUs. Link-time optimization (LTO) for device code (also known as device LTO), introduced as a preview feature in the CUDA 11.0 toolkit release, is now available as a full-featured optimization capability. The 11.2 CUDA C++ compiler can optionally generate a function-inlining diagnostic report for device functions that can provide insights into the compiler’s function inlining decisions. These diagnostic reports can aid advanced CUDA developers in application performance analysis and tuning efforts.
The CUDA C++ compiler aggressively inlines device functions into call sites by default. This can make assembly-level debugging of optimized device code a difficult task. For source code compiled using the 11.2 CUDA C++ compiler toolchain, the cuda-gdb and Nsight Compute debugger can display names of inlined device functions in call stack backtraces, thereby improving the debugging experience.
These and other new features are incorporated into the CUDA C++ 11.2 compiler and we are going to take a deep dive in this post. Read on!
Accelerated application performance with device LTO
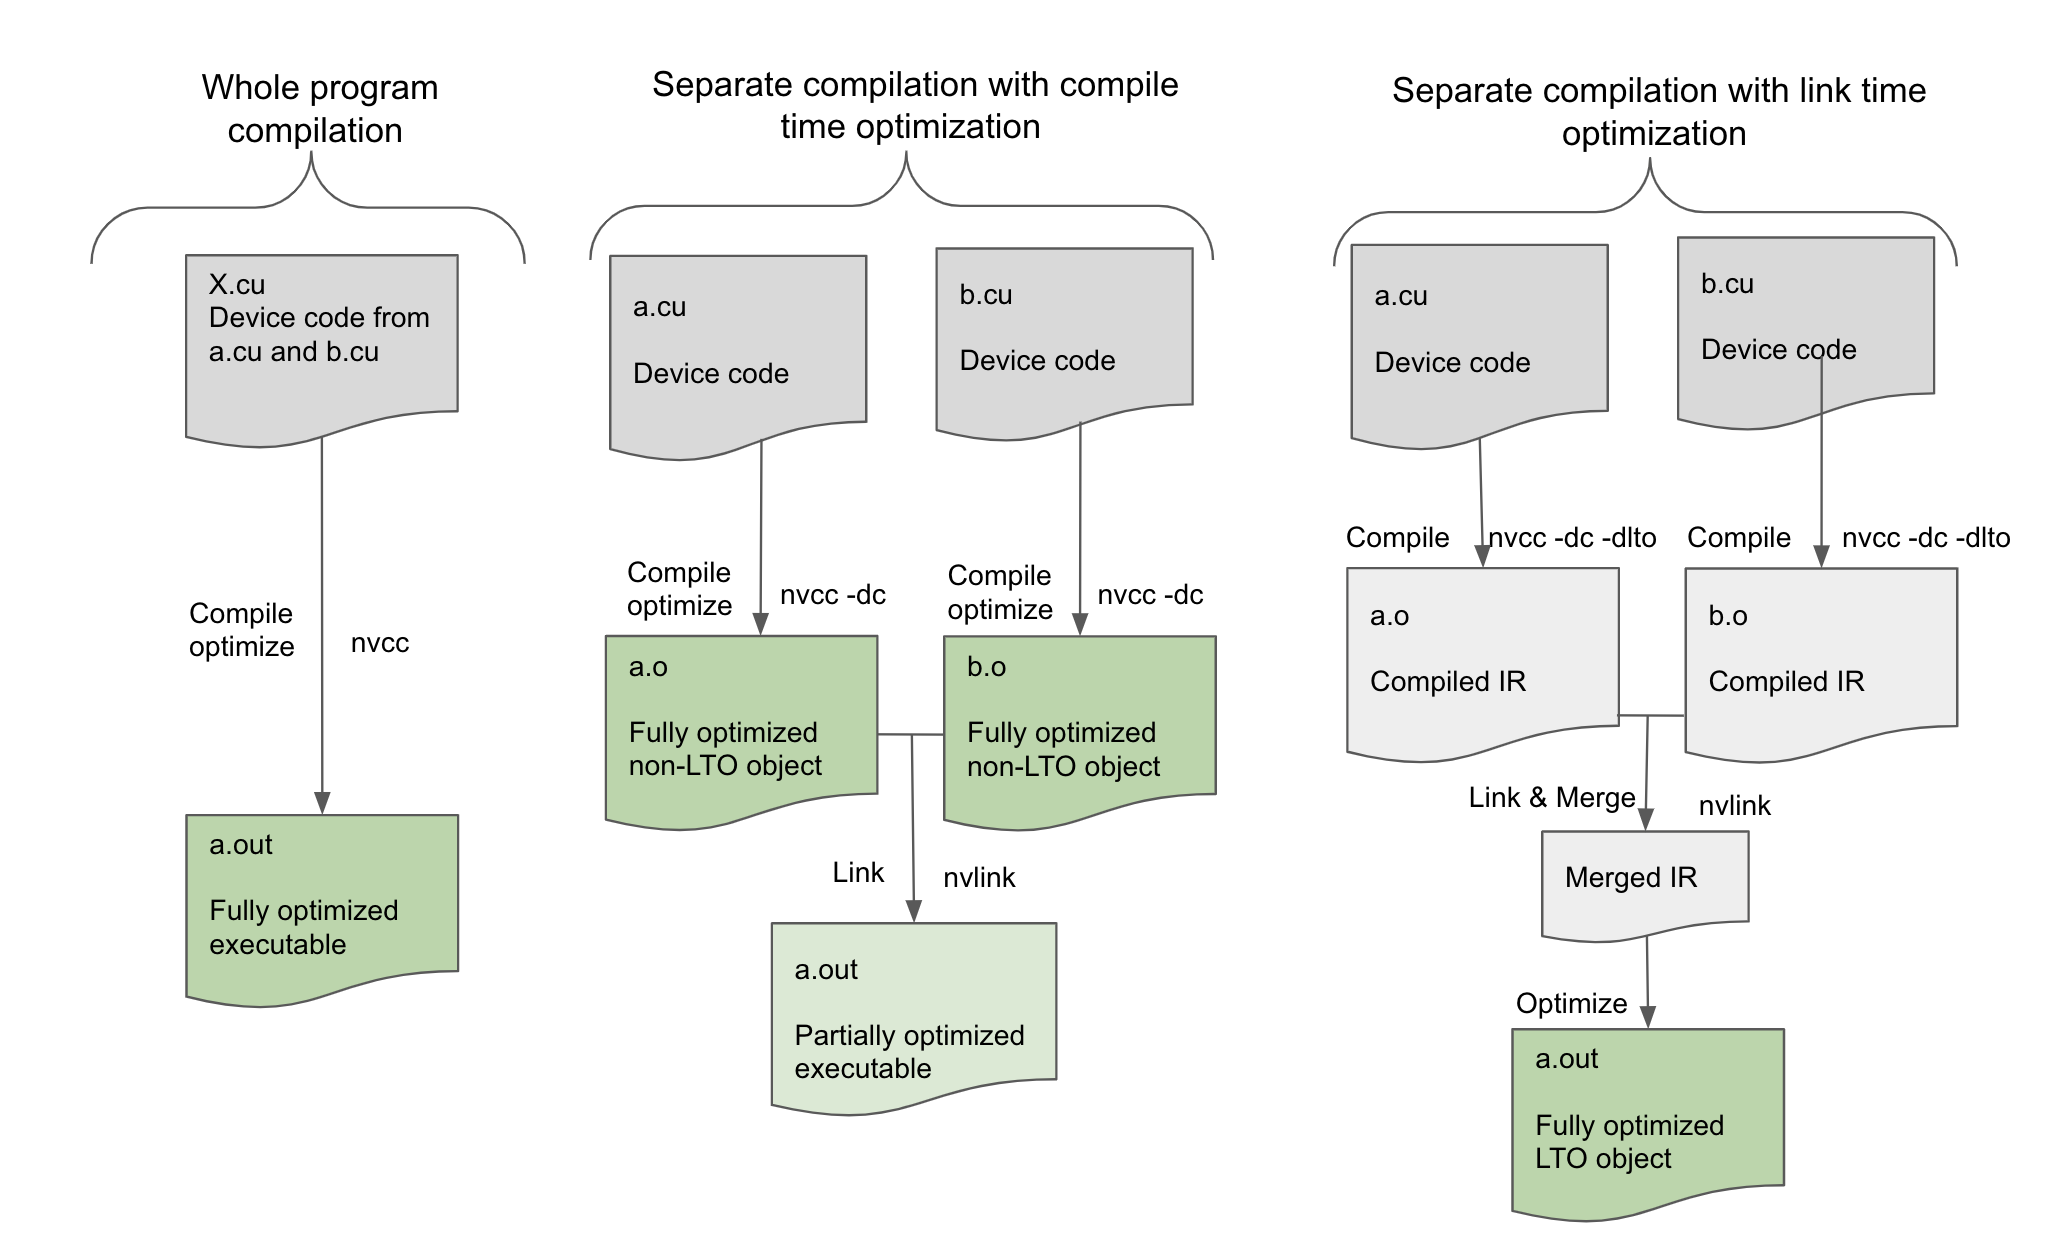
CUDA 11.2 features device LTO, which brings the performance benefits of LTO to device code compiled in separate compilation mode. In CUDA 5.0, NVIDIA introduced separate compilation mode to enhance developer productivity to design and build GPU-accelerated applications. Without the separate compilation mode, the compiler only supported the whole program compilation mode where all the device code in CUDA applications had to be restricted to a single translation unit. Separate compilation mode gave you the freedom to structure the device code across multiple files, to include GPU accelerated libraries and take advantage of incremental builds. Separate compilation mode allowed you to focus on source code modularity.
However, separate compilation mode was limited in the scope of performance optimization that can be performed at compile time. Optimizations such as device function inlining that spans across the boundaries of a single translation unit cannot be performed in separate compilation mode. This results in suboptimal code generation in separate compilation mode when compared to the whole program compilation mode especially when linking against device code libraries. With device LTO, performance of applications compiled in separate compilation mode is comparable to whole compilation mode.
LTO is a powerful optimization capability available in CPU compiler toolchains that we are now making accessible for GPU-accelerated codes. Device LTO enables device code optimizations that were only possible in NVCC whole program compilation mode, for separately compiled device code. With device LTO, you can harness the benefits of source code modularity afforded through separate compilation without sacrificing the runtime performance benefits of whole program compilation.
For more information about the performance impact of device LTO, see Improving GPU Application Performance with NVIDIA CUDA 11.2 Device Link Time Optimization.
Enhanced debugging of optimized device code
We have made a few enhancements to make debugging optimized device code easier in some situations.
Precise debugging
With CUDA 11.2, most inline functions are visible in the call stack backtrace on cuda-gdb and the Nsight debugger. You have a consistent backtrace of a performance-optimized code path and, more importantly, you can determine the call path of an error or exception more precisely, even when all the functions are inlined.
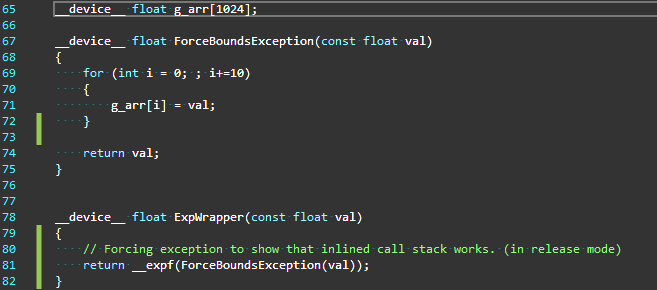
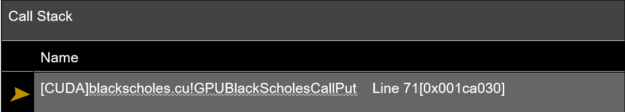
Figure 1 shows an example of a scenario where this capability can save a lot of time while you’re debugging an exception.
In Figure 1, the function ExpWrapper invokes ForceBoundsException that injects an array out of bounds exception. Because the function ForceBoundsException is defined in the same file as the function ExpWrapper, it is trivially inlined there. Without backtrace support for inline function that is added in CUDA 11.2, the call stack would show only the top-level caller that was not inlined in this call path. In this example, it happened to be the caller of the function ExpWrapper and therefore the call stack at the point of the exception is as shown in Figure 2, leaving out all the other inlined function calls.
From the call stack in Figure 2, it is obvious how little information there is in the call stack to meaningfully debug the execution path that eventually led to the point of exception. Without knowing how the functions were inlined, the line number 71 provided in the call stack is also not useful. In a three-level-deep function call, this issue may appear to be simple to track down. As stacks get deeper, this problem can quickly escalate. We understand that this can be quite frustrating.
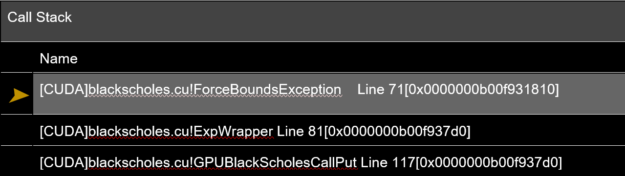
In CUDA 11.2, NVIDIA is taking a step towards symbolic debugging of optimized code by adding meaningful debug information for inline functions. The call stack that’s now generated is both precise and useful, including all the functions invoked at every level including those that are inlined. This enables you to determine not only the exact function where the exception occurred but also disambiguate the exact call path in which the exception was triggered.
It gets even better!
More debug information for even the most optimized code
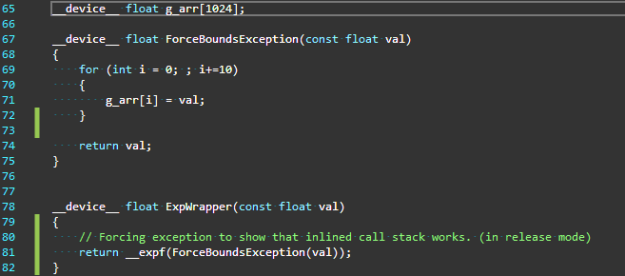
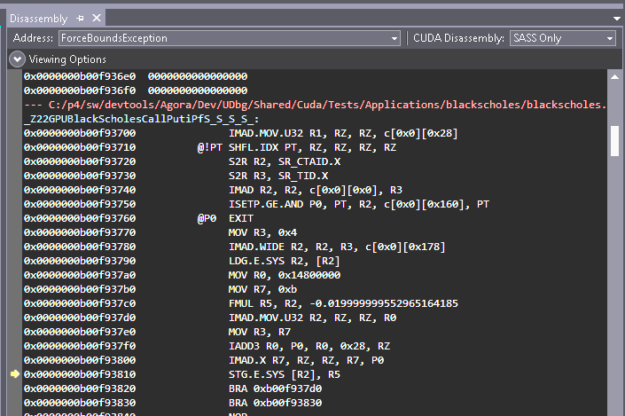
Improvements to debugging inline functions are not only about viewing the inline functions on the call stack backtrace, but they also extend to source viewing as well. Prior to CUDA 11.2, when function calls got aggressively inlined, the source view of the disassembled code was cryptic and compact (Figure 4).
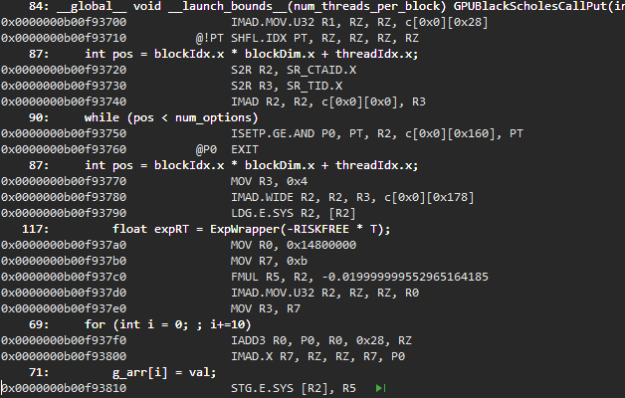
There is more debug information including line information and source lines are tagged to the disassembled code segment.
Figure 5 shows the source view of the same disassembled code segment on CUDA 11.2. You can get a more detailed source view for optimized code segments and can single step through them. Line information and source lines are tagged to the disassembled source code view even for inlined code segments.
To enable this feature, passing the --generate-line-info (or -lineinfo) option to the compiler is sufficient. A full-fledged symbolic debugging of optimized device code is not yet available. In some cases, you may still have to resort to debugging using the -G option. However, just having a precise call stack and a detailed source viewing should decisively make debugging performance optimized code more efficient, contributing to greater developer productivity.
But that’s not all!
Insights into inlining with diagnostic reports
Traditionally, compilers have been a bit of a black box when it comes to heuristic-based optimization decisions made by the compiler that aren’t visible to the application developer.
One such key optimization is function inlining. It has been difficult to understand the compiler heuristics on inlining without heavy post-processing of assembly output. Just knowing which functions were inlined and which weren’t can save a lot of time and that’s what we are introducing in CUDA 11.2. Not only do you now know when a function is not inlined, you also get to know why a function could not be inlined. You can then refactor the code, add inlining keywords to function declarations, or perform other source code refactoring, if possible.
You can get diagnostic reports about the optimizer’s inlining decisions with a new option, --optimization-info=inline. When inlining diagnostics are enabled, the optimizer reports additional diagnostics when a function cannot be inlined.
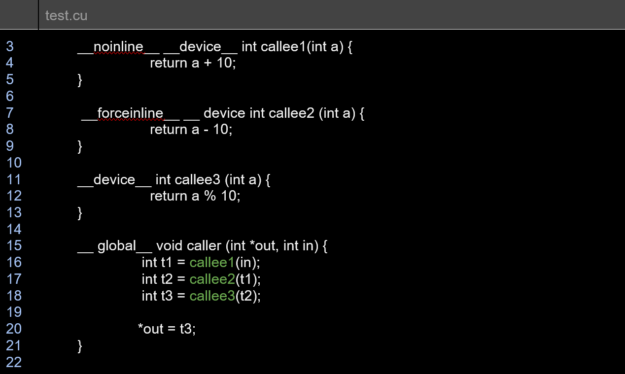
The diagnostics report for the earlier sample test.cu file is as shown:
remark: test.cu:16:12: _Z7callee2i inlined into _Z6callerPii with cost=always
remark: test.cu:17:11: _Z7callee3i inlined into _Z6callerPii with cost=always
remark: test.cu:18:12: _Z7callee1i not inlined into _Z6callerPii because it should never be inlined (cost=never)
In some cases, you may get a more detailed diagnostic:
remark: x.cu:312:28: callee not inlined into caller because callee doesn't have forceinline attribute and is too big for auto inlining (CalleeSize=666)
Diagnostics reports on inlining can be useful for you to refactor code to appropriately use the performance benefits of inline functions. Inlining diagnostics are emitted as the compiler runs the inlining pass. When the inliner is invoked multiple times from the compiler, a callsite not inlined in a prior pass could potentially be inlined in a subsequent pass.The CUDA C++ compiler documentation explains how this option can be used during nvcc invocation.
Reduced build-times through parallel compilation
The CUDA C++ compiler can be invoked to compile CUDA device code for multiple GPU architectures simultaneously using the -gencode/-arch/-code command-line options. While this is a convenient feature, it can result in increased build times resulting from several intervening steps.
In particular, the compiler needs to pre-process the CUDA C++ source code multiple times with different values of the __CUDA__ARCH__ built-in macro for each distinct compute architecture specified, including an extra preprocessing step where the built-in macro is left undefined for the purposes of compiling the source code for the host platform. Later, the preprocessed CUDA C++ device code instances must be compiled down to machine code for each target GPU architecture specified. These steps are currently done serially.
To mitigate the increase in build time arising from these multiple compilation passes, starting with the CUDA 11.2 release, the CUDA C++ compiler supports a new —threads <number> command-line option (-t for short) to spawn separate threads to perform independent compilation passes in parallel. If multiple files are compiled in a single nvcc command, -t compiles the files in parallel. The argument determines the number of independent helper threads that the NVCC compiler spawns to perform independent compilation steps in parallel.
For the special case -t0, the number of threads used is the number of CPUs on the machine. This option can help reduce the overall build time when NVCC is invoked to compile CUDA device code for multiple GPU architectures simultaneously. These steps are done serially by default.
Example
The following command generates .ptx files for two virtual architectures: compute_52 and compute_70. For compute_52, the .cubin files are generated for two GPU targets: sm_52 and sm_60; for compute_70, the .cubin file is generated for sm_70.
nvcc -gencode arch=compute_52,code=sm_52 -gencode arch=compute_52,code=sm_60 -gencode arch=compute_70,code=sm_70 t.cu
Parallel compilation can help reduce the overall build time when compiling applications with a large amount of CUDA C++ device code to multiple GPU targets. If the source code is mostly C/C++ host code with little CUDA device code or if only a single virtual architecture/GPU-SM combination is being targeted, then there may not be as much reduction in the overall build time. In other words, the speedup in build time can vary depending on the program, the compilation target characteristics, and the number of parallel compilation threads that NVCC can spawn.
NVCC launches helper threads to execute the compilation steps (as depicted in the CUDA compilation trajectory diagram) in parallel dynamically, constrained by serialization dependencies between the compilation steps where a compilation step is started on a separate thread only after all the prior steps on which it is dependent are completed.
Figure 7 shows how the CUDA compilation speedup due to parallel compilation varies when the limit on the independent compilation threads spawned by NVCC is increased (-t N option). This is for compilation trajectories that entail different levels of independent compilation steps that can be performed in parallel.
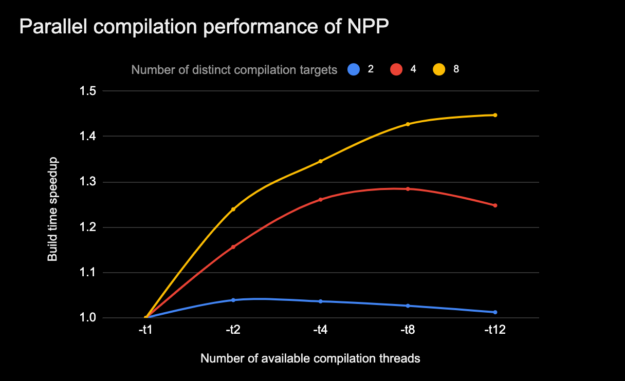
CPU model: i7-7800X CPU @ 3.50GHz #cpus: 12, threads per core: 2, cores per socket: 6, Memory: 31G. (All compilation was with make -j8)
The NVCC parallel thread compilation feature can be used in tandem with process-level build parallelism (that is, make -j N). However, the host platform characteristics must be considered to avoid oversubscribing build system resources (for example, number of CPU cores, available memory, other workloads), which can negatively impact overall build times.
New compiler built-in hints for better device code optimizations
CUDA 11.2 supports new built-ins that enable you to indicate programmatic hints to the compiler for better device code generation and optimization.
Using __builtin_assume_aligned, you can hint to the compiler about the pointer alignment which the compiler can use for optimizations. The __builtin_assume and __assume built-ins similarly can be used to indicate a runtime condition that can help the compiler generate better optimized code. The next sections take a deeper look at each of the specific built-in hint functions.
void * __builtin_assume_aligned(const void *ptr, size_t align)
void *__builtin_assume_aligned(const void *ptr, size_t align, offset)
The __builtin_assume_aligned built-in function can be used to hint to the compiler that the argument passed as a pointer is aligned to at least align bytes. The version with offset can be used when the argument (char *)ptr - offset is aligned to at least align bytes. Both functions return the argument pointer.
The compiler can use such alignment hints to perform certain code optimizations like load/store vectorization to work better. Consider the sample code in the function shown here that uses the built-in function to indicate that the argument ptr can be assumed to be aligned to at least 16 bytes.
__device int __get(int*ptr)
{
     int *v = static_cast <int *>
     (__builtin_assume_aligned(ptr, 16));
     return *v + *(v+1) + *(v+2) + *(v+3);
}
The earlier code example, when compiled with nvcc -rdc=true -ptx foo.cu without the built-in function, generated the following PTX with four separate load operations for the return expression.
ld.u32      %r1, [%rd1];
ld.u32      %r2, [%rd1 + 4];
ld.u32      %r4, [%rd1 + 8];
ld.u32      %r6, [%rd1 +12];
When the built-in function was used to hint to the compiler that the pointer was 16-bytes aligned, the PTX generated reflects the fact that the compiler could combine the load operations into a single, vectorized load operation.
ld.v4.u32 {%r1, %r2, %r3, %r4 }, [%rd1];
A single, vectorized load operation takes less time to execute as the four loads are executed in parallel. This avoids the overhead of issuing multiple requests to the memory subsystem while also keeping the binary size smaller.
void * __builtin_assume(bool exp)
The __builtin__assume built-in function allows the compiler to assume that the provided Boolean argument is true. If the argument is not true at runtime, then the behavior is undefined. The argument expression must not have side effects. Even though the CUDA 11.2 documentation indicates that the side effects are discarded, this behavior may change in a future release, so portable code should not have side effects in the provided expression.
As an example, for the following code segment, the CUDA 11.2 toolkit compiler can optimize the modulo-16 operation with fewer instructions, knowing that the num variable is guaranteed to have a positive value.
__device__ int mod16(int num){__builtin_assume(num > 0);return num % 16;}
As shown in the next generated PTX code example, when the sample code is compiled with nvcc -rdc=true -ptx, the compiler produces a single AND instruction for the modulo operation.
ld.param.u32 %r1, [_Z5Mod16i_param_0];and.b32 %r2, %r1, 15;st.param.b32 [func_retval0+0], %r2;
Without the hint, the compiler must account for the possibility of a negative num value, as seen in the generated PTX code, which includes additional instructions.
ld.param.u32   %r1, [_Z5Mod16i_param_0];
     shr.s32   %r2, %r1, 31;
     shr.u32   %r3, %r2, 28;
     add.s32   %r4, %r1, %r3;
     and.b32   %r2, %r1, 15;
     sub.s32   %r6, %r1, %r5
st.param.b32   [func_retval0+0], %r2;
NVCC also supports a similar built-in function, __assume(bool), when using cl.exe as a host compiler.
void * __builtin_unreachable(void)
In CUDA 11.3, we will introduce the __builtin_unreachable built-in function. This built-in function, when introduced in CUDA 11.3, can be used to indicate to the compiler that the control flow will never reach the point where this function is invoked. The program has undefined behavior if the control flow does reach that point at runtime. This hint could help the code optimizer to generate better code:
__device__ int get(int input)
{
   switch (input)
   {
          case 1: return 4;
          case 2: return 10;
          default: __builtin_unreachable();
   }
}
The PTX generated from compiling the earlier code fragment with nvcc -rdc=true -ptx in CUDA 11.3 would have the entire switch statement optimized into a single SELECT instruction.
  ld.param.u32   %r1, [_Z3geti_param_0];
   setp.eq.s32   %p1, %r1, 1;
      selp.b32   %r2, 4, 10, %p1;
  st.param.b32   [func_retval0+0], %r2;
Without the __builtin_unreachable call, the compiler generates a warning that the control flow reached the end of a non-void function. Typically, you must inject a dummy return 0 to avoid the warning message.
__device__ int  get(int input)
{
  switch (input)
  {
         case 1:   return 4;
         case 2:   return 10;
         default:   return 0;
  }
}
Adding the return to avoid the compiler warning leads to more PTX instructions, which also has the potential side effect of inhibiting further optimizations.
  ld.param.u32   %r1, [_Z3geti_param_0];
   setp.eq.s32   %p1, %r1, 2;
      selp.b32   %r2, 10, 0, %p1;
   setp.eq.s32   %p2, %r1, 1;
      selp.b32   %r3, 4, %r2, %p2;
  st.param.b32   [func_retval0+0], %r2;
The __builtin_assume and __builtin_assume_aligned functions are mapped to the llvm.assume LLVM intrinsic internally. For more information about why overusing the __builtin_assume* functions could be counterproductive, see the LLVM Language Reference manual. To quote:
“Note that the optimizer might limit the transformations performed on values used by the llvm.assume intrinsic to preserve the instructions only used to form the intrinsic’s input argument. This might prove undesirable if the extra information provided by the llvm.assume intrinsic does not cause sufficient overall improvement in code quality. For this reason, llvm.assume should not be used to document basic mathematical invariants that the optimizer can otherwise deduce or facts that are of little use to the optimizer.”
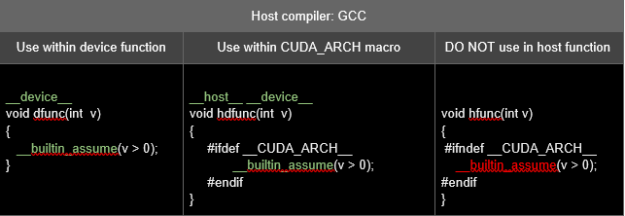
Some host compilers may not support the earlier built-in functions. In such cases, you must pay attention to where the built-in function is invoked in the code.
The following table has an example of the usage of __builtin_assume when the host compiler is gcc. Because gcc does not support this built-in function, invocations to __builtin_assume should not be present outside the __device__ functions during the host compilation phase when __CUDA_ARCH__ macro is undefined.
For more information about how to use these built-in functions, see Compiler Optimization Hint Functions.
Warnings can be suppressed or tagged as errors
NVCC now supports command-line options that you can use to manage compiler diagnostics. You can optionally have the compiler emit error numbers along with diagnostic messages and specify whether the diagnostic associated with an error number should be treated by the compiler as an error or suppressed altogether. These options are not applicable for diagnostics emitted by the host compiler or preprocessor. In a future release, the compiler will also support pragmas to promote specific warnings to errors or to suppress them.
Usage
--display-error-number (-err-no)
Displays a diagnostic number for any message generated by the CUDA frontend compiler.
--diag-error <error-number>,... (-diag-error)
Emits an error for the specified diagnostic messages generated by the CUDA frontend compiler.
--diag-suppress <error-number>,... (-diag-suppress)
Suppresses specified diagnostic messages generated by the CUDA frontend compiler.
Example
Sample code where the device function hdBar invokes host function hostFoo and the variable i is unused in hostFoo:
void hostFoo(void)
   {
     int i = 0;
   }
__host__ __device__ void hdBar(bool cond)
   {
     if (cond)
     hostFoo();
   }
The following code example displays the diagnostic number with default warnings:
$nvcc -err-no -ptx warn.cu
warn.cu(1): warning #177-D: variable "i" was declared but never referenced
warn.cu(2): warning #20011-D: calling a __host__ function("hostFoo()") from a __host__ __device__ function("hdBar") is not allowed
The following code example promotes warning #20011 to an error:
$nvcc -err-no -ptx -diag-error 20011 warn.cu
warn.cu(1): warning #177-D: variable "i" was declared but never referenced
warn.cu(2): error: calling a __host__ function("hostFoo()") from a __host__ __device__ function("hdBar") is not allowed
The following code example suppresses warning #20011 from being displayed:
$nvcc -err-no -ptx -diag-suppress 20011 warn.cu
warn.cu(1): warning #177-D: variable "i" was declared but never referenced
NVVM upgrade to LLVM 7.0
The CUDA 11.2 compiler toolchain receives an LLVM 7.0 upgrade.
Upgrading to LLVM 7.0 opens the door to new capabilities that are present in this LLVM version. It provides a stronger foundation for enabling further performance tuning efforts over time by exploiting the new optimizations available in LLVM 7.0.
Figure 8 shows the run-time performance impact on both Volta and Ampere-based GPUs for a subset of HPC applications compiled with the 11.2 compiler toolchain that incorporates a high-level NVVM optimizer based on LLVM 7.0 compared to the 11.1 compiler toolchain that incorporates a high-level NVVM optimizer based on LLVM 3.4.
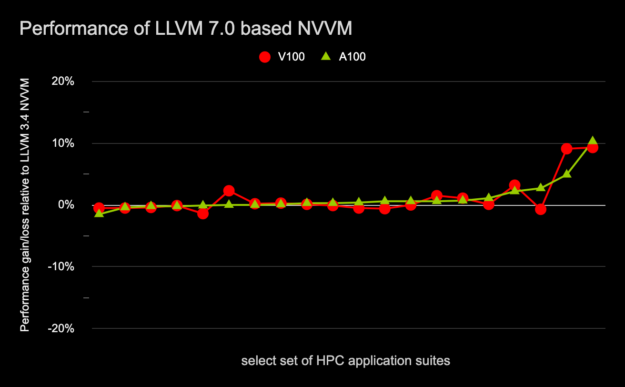
relative to LLVM 3.4 based NVVM on A100 and V100.
libNVVM upgrade to LLVM 7.0
With the CUDA 11.2 release, the CUDA C++ compiler, the libNVVM and NVRTC shared libraries have all been upgraded to the LLVM 7.0 code base. The libNVVM library provides GPU extensions to LLVM in support of the wider community with compilers, DSL translators, and parallel applications targeting computational workloads on NVIDIA GPUs. The NVRTC shared library helps compile dynamically generated CUDA C++ source code at runtime.
With the libNVVM library incorporating LLVM 7.0 support, the libNVVM API and the NVVM IR specifications have been modified to be LLVM 7.0 compliant. To update the input IR format, see the published NVVM IR specification. This libNVVM upgrade is not compatible with the debug metadata IR supported in the previous release. Third-party compilers that rely on debug metadata generation should adapt to the new specification. With this upgrade, libNVVM deprecates the textual IR interface as well. We recommend that you use the LLVM 7.0 bitcode format. For more information about the changes to be made to compiler software based on libNVVM, see the libNVVM specification and NVVM IR specification.
This upgrade also brings in enhancements to source-level debug support. A compiler frontend may need a DWARF expression to indicate the location at which a variable value is held at runtime. Such variables cannot be inspected in a debugger without proper support for DWARF expressions. An important aspect of this libNVVM upgrade is the broader expressibility of such variable locations using operations like DWARF expressions. NVVM IR now supports such expressions using intrinsics and operations. The final location of such a variable is expressed in DWARF using these expressions.
Try out the CUDA 11.2 compiler features
The CUDA 11.2 toolkit incorporates features focused on improving GPU performance and elevating the developer experience. Download today!
The compiler toolchain upgrade to LLVM 7.0, device LTO support, and new compiler built-ins are capabilities that can be leveraged to enhance CUDA C++ application performance.
Virtual stack backtrace support for inlined device functions, compiler reports on function inlining decisions, parallel CUDA compilation support and the ability to control compiler warning diagnostics are new capabilities incorporated in the CUDA 11.2 toolkit that are aimed at improving your productivity.
NVIDIA is pleased to deliver the CUDA 11.2 toolkit release to the growing CUDA community. Do you have feedback that you’d like to share in terms of your experience in using the 11.2 compiler toolchain? We welcome all comments through the NVIDIA Developer Forum.