
NVIDIA Nsight Compute is an interactive kernel profiler for CUDA applications. It provides detailed performance metrics and API debugging through a user interface and a command-line tool. Nsight Compute 2022.1 brings updates to improve data collection modes enabling new use cases and options for performance profiling.
What’s New
Range Replay
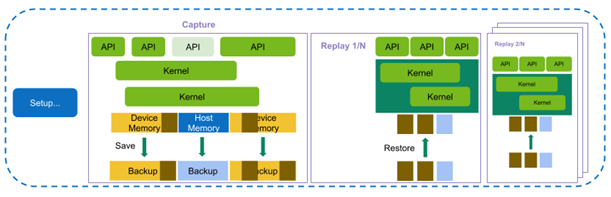
This release of Nsight Compute extends the existing replay modes with the highly requested feature of Range Replay. Range Replay captures and replays complete ranges of CUDA API calls and kernel launches within the profiled application. Metrics are associated with the entire range as opposed to individual kernels.This allows the tool to execute kernels without serialization and support profiling kernels that need to be run concurrently for correctness or performance reasons. A range consists of a start and an end marker; and includes all CUDA API calls and kernels launched between these markers from any CPU thread.
Range markers can be defined using either:
- Profiler Start/Stop API
- NVTX Ranges
For complete details, see the “Replay” section in Nsight Compute’s Kernel Profiling Guide.
Memory Analysis
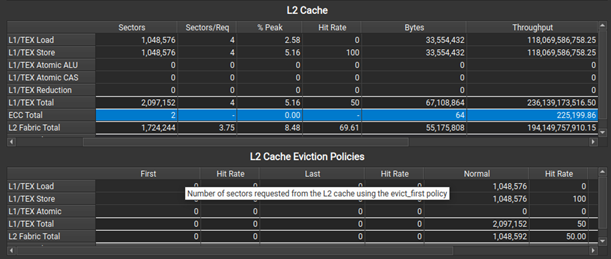
When profiling on A100, a new L2 Cache Eviction Policies table in the Memory Analysis section helps you understand the number of accesses and achieved hit rates by the various cache eviction policies. In the same section, the L2 Cache table now has a new ECC row to show traffic created from enabling hardware Error Correction Code on the GPU.
Guided Analysis
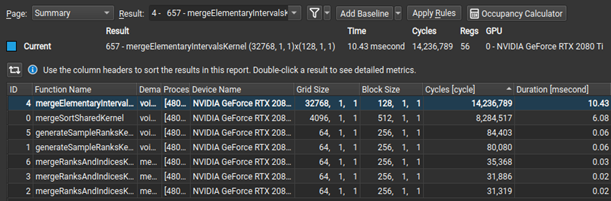
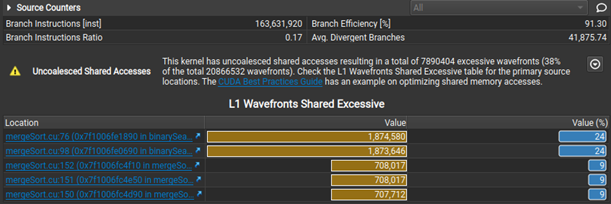
Nsight Compute now makes it easier to select initial analysis targets in multiresult collection by dynamically selecting between the Summary and Details pages when opening a report. Rules were extended to detect non-fused floating-point instructions as an optimization opportunity. Last, but not least, when the Uncoalesced Memory Access rules are triggered, they show a table of the five most valuable instances, making it easier to inspect and resolve them on the Source page.
Additional improvements
Further improvements include an Occupancy Calculator auto-update. There is also a new ‘Thread Instructions Executed’ metric and register name tooltips for the Register Dependency columns in the Source page, as well as NVLink updates.
At GTC in November of 2021, we released insightful assets showcasing Nsight tools capabilities:
- Understanding CUDA Application Behavior, Performance, and Optimization Just Got Easier with the Latest Developer Tools [A31048]
- Optimizing CUDA Machine Learning Codes with Nsight Profiling Tools [DLIT1605]
- Guided Analysis with Nsight Compute Demo