The new nvtx-plugins-tf library enables users to add performance logging nodes to TensorFlow graphs. (TensorFlow is an open source library widely used for training DNN—deep neural network—models).
These nodes log performance data using the NVTX (NVIDIA’s Tools Extension) library. The logged performance data can then be viewed in tools such as NVIDIA Nsight Systems and NVIDIA Nsight Compute.
Viewing performance data enables uncovering performance issues and reducing TensorFlow and Keras based training time, sometimes dramatically.
Introduction to NVTX
NVIDIA Tools Extension (NVTX) is a C-based Application Programming Interface (API) for annotating events, time ranges and resources in applications. NVTX brings the profiled application’s logic into the Profiler, making the Profiler’s displayed data easier to analyse and enables correlating the displayed data to profiled application’s actions.
NVTX can be quickly integrated into an application. The sample program below shows the use of marker events, range events, and resource naming.
#include "nvToolsExt.h"

void Wait(int waitMilliseconds)
{
   nvtxRangePush(__FUNCTION__);
   nvtxMark("Waiting...");
   Sleep(waitMilliseconds);
   nvtxRangePop();
}

int main(void)
{
   DWORD mainThreadId = GetCurrentThreadId();
   nvtxNameOsThread(mainThreadId, "Main thread");
   nvtxRangePush("Inside main function");
   Wait(10);
   nvtxRangePop();
}
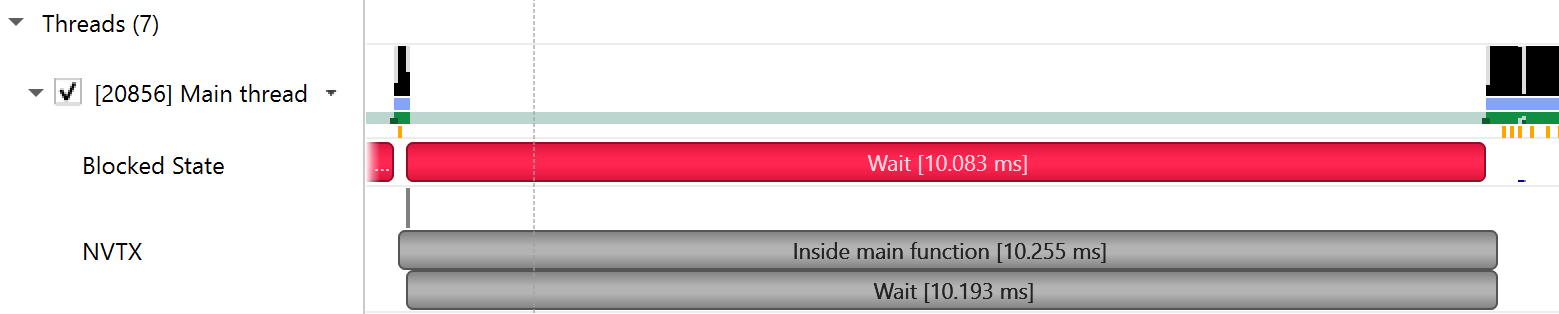
The resulting NVTX markers can be viewed in Nsight Systems timeline view, shown in figure 1.
The new nvtx-plugins-tf uses NVTX to bring NVTX capabilities into TensorFlow. Detailed NVTX documentation can be found under the CUDA Profiler user guide.
TensorFlow and nvtx-plugins-tf
TensorFlow is an open-source machine learning library for research and production. Users can use the low-level TensorFlow Core API or the higher level Keras API to create and train Deep Neural Network (DNN) models. Millions of data scientists worldwide use TensorFlow.
When working in “Graph execution” mode, TensorFlow’s programs consist of two discrete steps:
- Building the computational graph (a tf.Graph)
- Executing the computational graph (using a tf.Session)
Using NVTX emitting code in stage one only measures the graph’s build time which is not we’re seeking. In order to measure the graph’s actual execution time, we have to be smarter. Therefore, we add two new TensorFlow operations:
- NVTX Start
- NVTX End
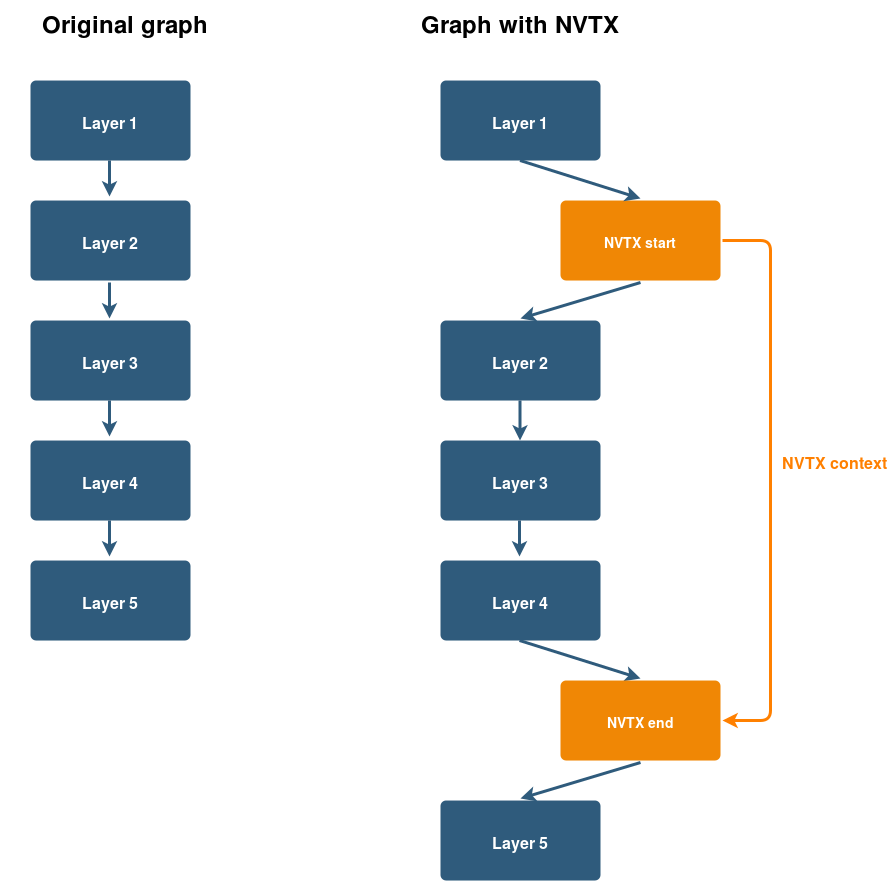
We implement these operations as TensorFlow operation nodes, using C++. In practice, they perform the identity operation (input equals output). However, these nodes have the side effect of opening and closing NVTX time ranges. All that a TensorFlow user needs to do is add these NVTX Start and NVTX End nodes before and after the subgraph that he would like to profile. Figure 2 illustrates this concept:
The good news is that you don’t need to implement these NVTX emitting nodes yourself; nvtx-plugins-tf does it for you. Moreover, nvtx-plugins-tf offers Python functions and decorators that makes it very easy to add these nodes to a TensorFlow graph while building it.
We show a simple example, below.
x, nvtx_context = nvtx_tf.ops.start(x, message='Dense 1-3',
       domain_name='Forward', grad_domain_name='Gradient')
   x = tf.layers.dense(x, 1024, activation=tf.nn.relu, name='dense_1')
   x = tf.layers.dense(x, 1024, activation=tf.nn.relu, name='dense_2')
   x = tf.layers.dense(x, 1024, activation=tf.nn.relu, name='dense_3')
   x = nvtx_tf.ops.end(x, nvtx_context)
Nvtx-plugins-tf also provides session hooks, keras layers and python callbacks and also supports TensorFlow’s eager execution mode.
Introduction to Nsight Systems
NVIDIA®️ Nsight™Systems tool offers system-wide performance analysis in order to visualize application’s algorithms, help identify optimization opportunities, and improve the performance of applications running on a system consisting of multiple CPUs and GPUs.
Nsight Systems Timeline
Nsight Systems displays data in a unified timeline view, combining CPU and GPU activities, together with other activities into a single timeline. The timeline comprises multiple rows, each displaying different data. Let’s dive into the timeline’s rows to see how these can help profile your TensorFlow based application.
CPUs
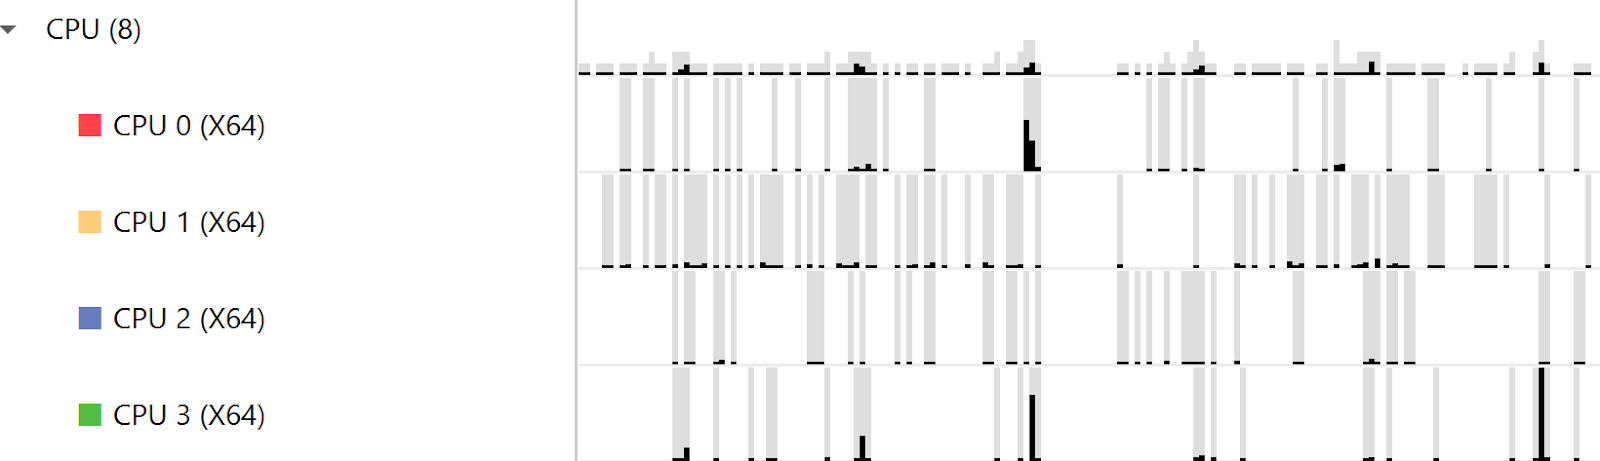
CPU rows display how your process’ threads utilize each CPU core, as shown in figure 3. This helps locating CPU cores’ idle times.
Threads
Thread rows display a detailed view of each thread’s activities, shown in figure 3. These include CPU cores load, blocked states, call-stacks, OS runtime libraries usage, CUDA API calls, CuDNN and cuBLAS usage. Figure 4 demonstrates threading and synchronization related issues. When a thread is blocked, contextual cues and tooltips present the blocking reason.

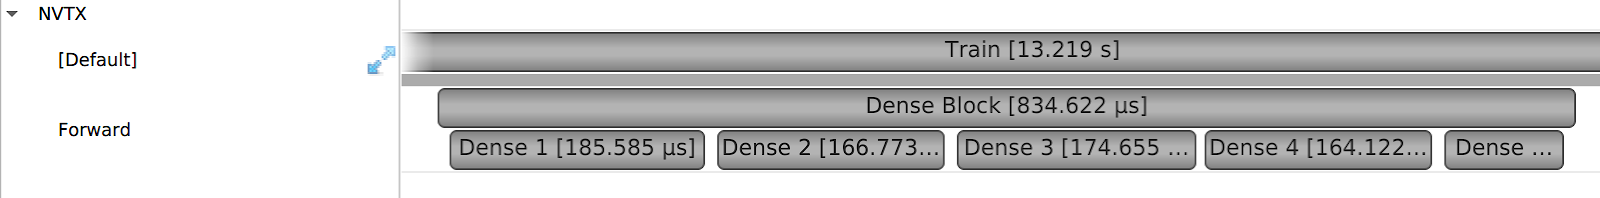
Using nvtx-plugins-tf, TensorFlow users can emit NVTX time ranges and events that will be shown in Nsight Systems’ timeline, as figure 5 shows. The correlation to TensorFlow’s graph greatly improve the timeline’s readability, allowing developers to identify how their high-level Python code is related to lower-level CUDA API calls, GPU workloads and CPU thread activities.
CUDA Workloads
The CUDA workloads rows display compute and copy GPU workloads executed by your process. Figure 6 below displays the execution time of the “EigenMetaKernel” CUDA kernel on the Quadro GV100 GPU:

Profiling your training session using Nsight Systems
The easiest way to profile your TensorFlow based training session is to use Nsight Systems’ command line interface.
After every machine boot, run:
sudo sh -c 'echo -1 >/proc/sys/kernel/perf_event_paranoid'
This will enable Nsight Systems to collect CPU utilization and thread’s data.
The Nsight Systems command line interface is named nsys. It resides under the Target-x86_64/x86_64 directory. Below is a typical command line invocation:
nsys profile -y 10 -d 15 -w true -t “cudnn,cuda,osrt,nvtx” -o ~/data/session1 /usr/bin/python main.py
- profile – start a profiling session
- -y – collection start delay in seconds
- -d – collection duration in seconds
- -w true – send target process’ stdout and stderr streams to the console
- -t – selects the APIs to be traced
- -o – name for the intermediate result file, created at the end of the collection
When profiling session ends, a qdrepfile will be created. This file can be loaded into Nsight Systems GUI (Host-x86_64/nsight-sys) using File -> Open.
NVTX in TensorFlow container on NGC
NGC (NVIDIA GPU Cloud) TensorFlow emits NVTX ranges by default for each graph node and don’t modify the graph. Nvtx-plugins-tf allows users to add their own markers to highlight specific layers or parts of their model by adding NVTX Start and NVTX End nodes to the graph.
The built in NGC TensorFlow markers can be disabled by setting the environment variable TF_DISABLE_NVTX_RANGES.
Getting Started
The nvtx-plugins-tf is available at GitHub. Documentation can be found here.
NVIDIA Nsight Systems is free to download and use. If you use TensorFlow, Nsight Systems plus nvtx-plugins-tf gives you a powerful tool for debugging and profiling your TensorFlow applications.