
Beyond the unimaginable prices for monkey pictures, NFT’s underlying technology provides companies with a new avenue to directly monetize their online engagements. Major brands such as Adidas, NBA, and TIME have already begun experimenting with these revenue streams using NFTs–and we are still early in this trend.
As data practitioners, we are positioned to provide valuable insights into these revenue streams, given that all transactions are public on the blockchain. This post provides a guided project to access, analyze, and identify potential fraud using blockchain data using Python.
In this post and accompanying Jupyter notebook, I discuss the following:
- The basics of blockchain, NFTs, and network graphs.
- How to pull NFT data using the open-source package NFT Analyst Starter Pack from a16z.
- How to interpret Ethereum blockchain data.
- The fraudulent practice of wash trading NFTs.
- Constructing network graphs to visualize potential wash trading on the NFT project Bored Ape Yacht Club.
The Jupyter notebook has a more detailed, step-by-step guide for writing Python code to implement this example walkthrough, and the post provides additional context. In addition, this post assumes that you have a basic understanding of pandas, data preparation, and data visualization.
What is blockchain data?
Cutting through the media frenzy of coins named after dogs and pixelated pictures selling for hundreds of thousands of dollars reveals fascinating technology: the blockchain.
The following excerpt best describes this decentralized data source:
“At a very high level, blockchains are ledgers of transactions utilizing cryptography that can only add information and thus can’t be changed (i.e., immutable). What separates blockchains from ledgers you find at banks is a concept called ‘decentralization’— where every computer connected to a respective blockchain must ‘agree’ on the same state of the blockchain and subsequent data added to it.”
For more information about Ethereum blockchain data, see Making Sense of Ethereum Data for Analytics.
Central to this technology is that all the data (for example, logs, metadata, and so on) must be public and accessible. I highly recommend Stanford professor Dan Boneh’s lecture.
What is an NFT?
NFT stands for non-fungible token, a crypto asset on a blockchain (such as Ethereum) in which it represents a unique one-of-one token that can be digitally owned. For example, gold bars are fungible, as multiple bars can exist and represent the same thing, while the original Mona Lisa is non-fungible in that only one exists.
Contrary to popular belief, NFTs are not just art and JPEGs but digital representations of ownership on a blockchain ledger for a unique item such as art, music, or whatever the NFT creator wants to put onto the metadata. For this post, however, we use the NFT project Bored Ape Yacht Club (BAYC), an artwork NFT.
P.S. If you are a visual learner, my favorite intro resource on the topic of NFTs is the What Are NFTs and How Can They Be Used in Decentralized Finance? DEFI Explained video by Finematics.
What is a network graph, and why are they prime to represent blockchain data?
Networks are a method of organizing relationship data using nodes and edges. Nodes represent an entity, such as an email address or social media account, while the edges show the connection between nodes.
Furthermore, you can store metadata for nodes and edges to represent different aspects of a relationship. Metadata can range from weights to labels. Figure 1 shows the steps of taking an entire network and zooming into a use case with helpful labels from metadata.
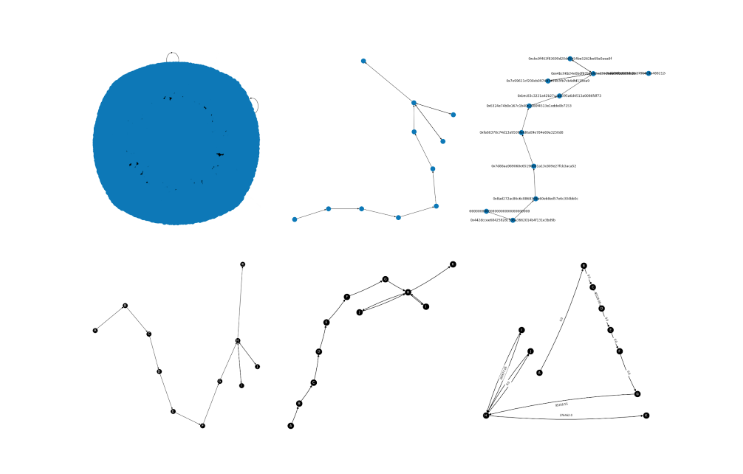
What makes network graphs ideal for representing blockchain transactions is that there is always a to and from blockchain address, as well as significant metadata (for example, timestamps, coin amounts, and so on.) for each transaction. Furthermore, as blockchain data is public by design through decentralization, you can use network graphs to visualize economic behaviors on a respective blockchain.
In this example, I want to demonstrate identifying the fraudulent behavior of wash trading, where an individual intentionally sells an asset to themselves across multiple accounts to artificially inflate the asset’s price.
Chainalysis wrote an excellent report on the phenomena, where they identified over 260 Ethereum crypto wallets potentially engaging in wash trading with a collective profit of over $8.4 million in 2021 alone.
Pulling data from the Ethereum blockchain
Though all blockchain data is publicly available to anyone, it is still tough to access and prepare for analysis. Following are some options to access blockchain data:
- Create your own blockchain node (for example, become a miner) to read the rawest data available.
- Use a third-party tool to create your own blockchain node.
- Use a third-party API to read raw data from their own blockchain node.
- Use a third-party API to read cleaned and aggregated blockchain data from their service.
- Use the open-source package NFT Analyst Starter Pack from a16z.
Although all are viable options, each has a tradeoff between reliability, trust, and convenience.
For example, I worked on an NFT analytics project where we wanted to create a reliable NFT market dashboard. Unfortunately, having our own blockchain node was cost-prohibitive, many third-party data sources had various data-quality issues that we couldn’t control, and it became challenging to track transactions across multiple blockchains. That project ultimately required bringing together high-quality data from numerous third-party APIs.
Thankfully for this project, you want the most convenience possible to focus on learning, so I recommend NFT Analyst Starter Pack from a16z. Think of this package as a convenient wrapper around the third-party blockchain API from Alchemy, where it creates easy-to-use CSVs of your desired NFT contract.
Preparing data and creating network graphs
The NFT Analyst Starter Pack results in three separate CSV files for the BAYC NFT project:
- BAYC Metadata: Information regarding a specific NFT, where
asset_idis the unique identifier within this NFT token. - BAYC Sales: Logs and metadata related to a specific transaction represented by its transaction hash where a seller and buyer inform you of the wallets involved.
- BAYC Transfers: The same as BAYC Sales data, but no money is transferred from one wallet to another.
For this project, most of the data preparation is around:
- Reorganizing BAYC Sales and BAYC Transfers to enable a clean union of the two datasets.
- Deleting duplicate logs of transfer transactions already represented in sales.
Given that the goal is to learn, don’t worry about whether the blockchain data is accurate, but you can always check for yourself by searching the transaction_hash value on Etherscan.
After preparing the data, use the NetworkX package to generate a network graph data structure of your NFT transactions. There are multiple ways to construct a graph, but in my opinion, the most straightforward approach is to use the function from_pandas_edgelist, where you just provide a pandas DataFrame, the to and from values to represent the nodes, and any metadata for edges and labeling.
[('0x2fdcca65899346af3a93a8daa6128bdbcb1ce3b3',
  '0xcedf17dfafa947cd0e205fe2a3a183cf2fb3a0bc',
  {'transaction_hash': '0xb235f0321b0b50198399ec7f2bb759ef625f85673b4d90d68f711229750181e4',
   'block_number': '14675897',
   'date': '2022-04-28',
   'asset_id': '7438',
   'sale_price_eth': 153.2,
   'sale_price_usd': 442685.5285671361,
   'transaction_type': 'sell',
   'asset_contract': '0xbc4ca0eda7647a8ab7c2061c2e118a18a936f13d'}),
('0x2fdcca65899346af3a93a8daa6128bdbcb1ce3b3',
  '0xd8fdd6031fa27194f93e1a877f8bf5bfc9b47e1e',     {'transaction_hash':'0x7b4797061eb16d73a28a869e51745e471e2849a55c80459b2aff7f0205925d74',
   'block_number': '14654313',
   'date': '2022-04-25',
   'asset_id': '5954',
   'sale_price_eth': 0.0,
   'sale_price_usd': 0.0,
   'transaction_type': 'transfer',
   'asset_contract': '0xbc4ca0eda7647a8ab7c2061c2e118a18a936f13d'})]
From this prepared data, the NetworkX package makes visualizing network graphs as easy as nx.draw, but with over 40k transactions in the DataFrame, visualizing the whole graph returns only a useless blob. Therefore, you must be specific about exactly what to visualize among your transactions to create a captivating data story.
Visualizing potential wash trading
Rather than scouring through the transactions of 10,000 NFTs, you can instead validate what others are stating within the market. Notably, the NFT Wash Trading – Is it possible to protect against it? post calls out BAYC token 8099 as potentially being subjected to the fraudulent practice of wash trading.
If you follow along in the accompanying notebook, you carry out these steps:
- Filter prepared NFT data to only rows containing logs for
asset_id8099. - Rename the
toandfromwallet addresses to uppercase letters ordered sequentially following when the wallet address first appeared among the NFT asset’s transactions. - Generate network graph data with the prepared asset 8099 data using the NetworkX package.
- Plot the network graph with desired labels, edge arrows, and node positioning.
Did BAYC 8099 NFT experience wash trading?
The data plotted in Figure 2 enables you to visualize the data corresponding to asset 8099. Starting at node H, you can see that this wallet first increases the price from $95k to $166k between H<->I, then adds more transactions through transfers between H<->J. Finally, node H sells the potentially artificially increased NFT to node K.
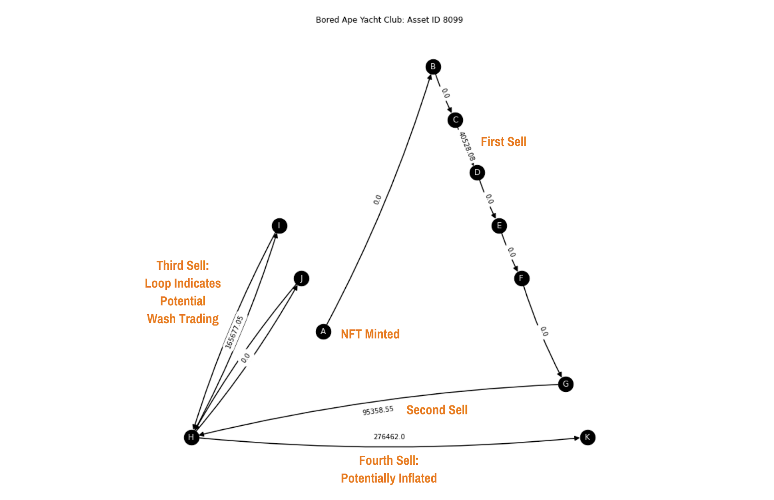
Though this graph can’t definitively state that node H engaged in wash trading—as you don’t know whether nodes H, I, and J are wallets owned by the same person—seeing loops for a node where the price increases should flag the need to do more due diligence. For example, you could look at etherscan.com to review the transactions between the following wallets:
0xe4bc96b24e0bdf87b4b92ed39c1aef8839b090dd(node H).0x7e99611cf208cb097497a59b3fb7cb4dfd115ea9(node I).0xcbc9f463f83699d20dd5b54be5262be69a0aea9f(node J).
Perhaps node H had sellers’ remorse and wanted their NFT back, as it’s not uncommon for investors to get attached to their beloved NFTs. But numerous transactions between the wallets associated with nodes H, I, and J could indicate further red flags for the NFT asset.
Next steps
By following along with this post and accompanying notebook, you have seen how to access Ethereum blockchain data and analyze NFTs through network graphs. If you enjoyed this analysis and are interested in doing more projects like this, chat with me in the CharlieDAO Discord, where I hang out. We are a collective of software engineers, data scientists, and crypto natives exploring web3!
Disclaimer
This content is for educational purposes only and is not financial advice. I do not have any financial ties to the analyzed NFTs at the moment of releasing the notebook, and here is my crypto wallet address on Etherscan for reference. This analysis only highlights potential fraud to investigate further but does not prove fraud has taken place. Finally, if you own crypto, never share your “secret recovery phrase” or “private keys” with anyone.
