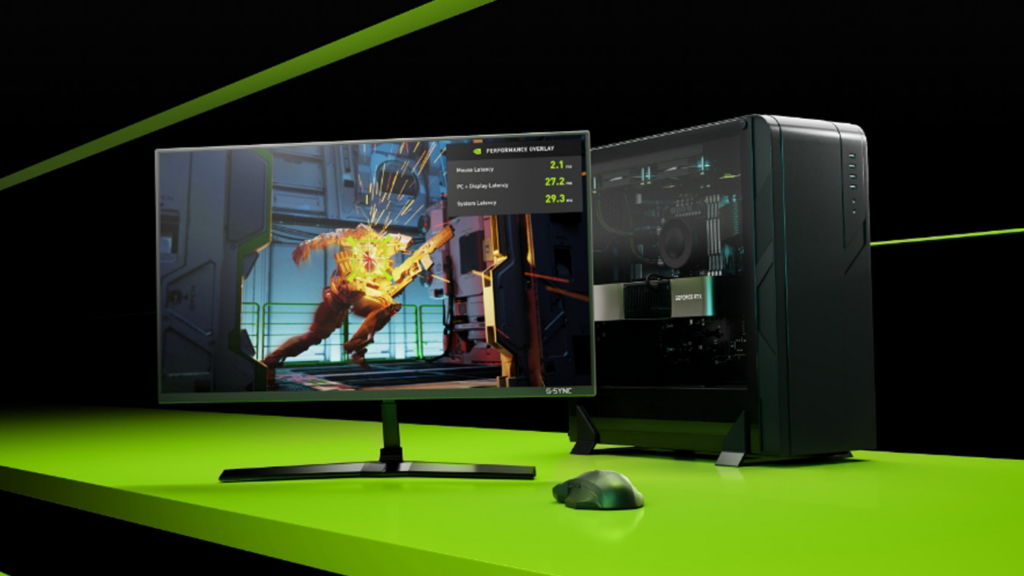
System latency is an important gaming performance metric. In many cases, it is more impactful to the overall gaming experience than frames per second (FPS). While FPS is relatively easy to measure, system latency has traditionally been difficult to measure.
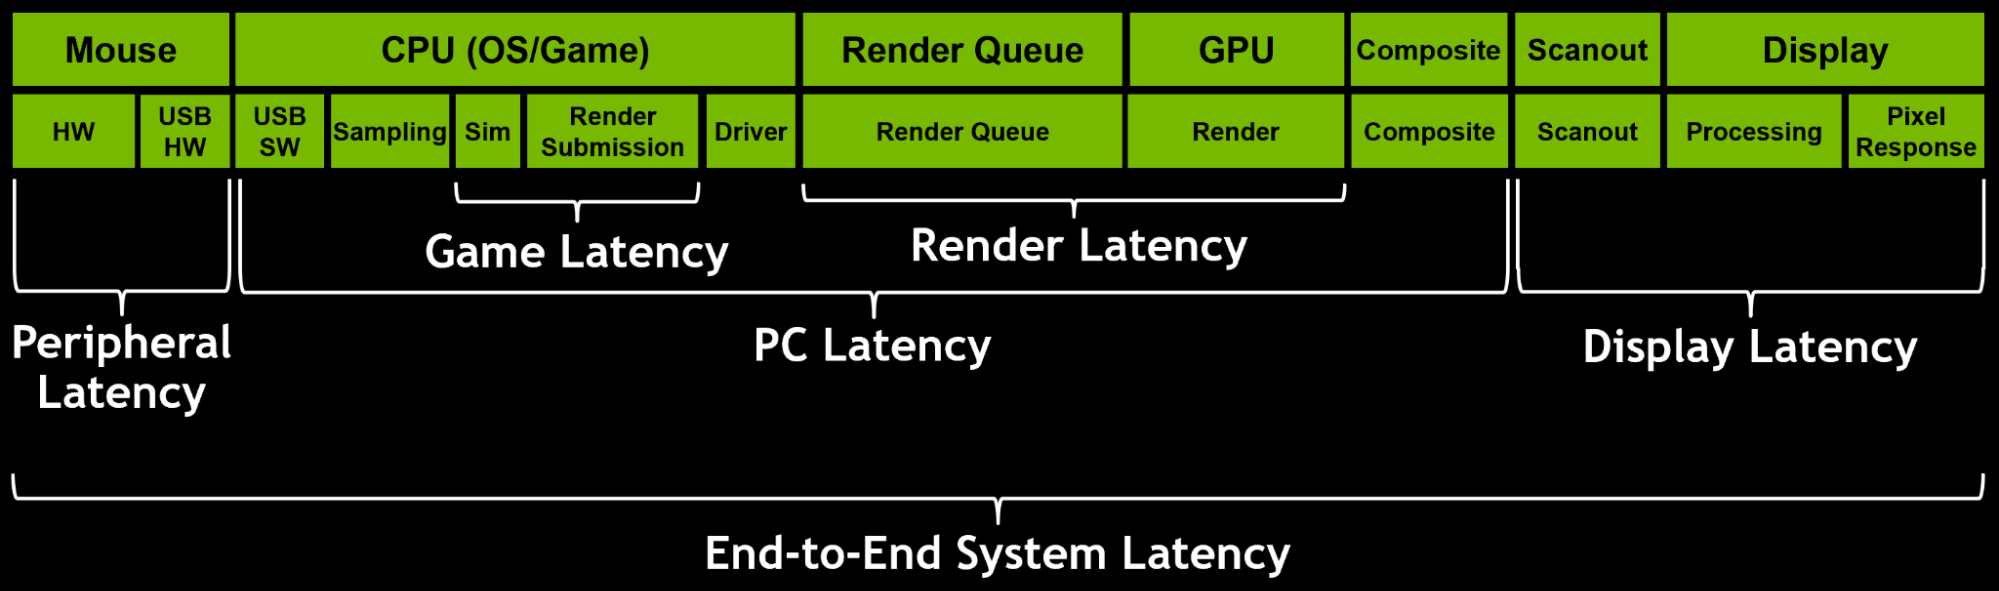
End-to-end (E2E) system latency is the sum of various latencies in the pipeline, as shown in Figure 1. To ease E2E measurement difficulties, PC Latency (PCL) Stats enables gamers, reviewers, and developers to measure PCL, the main component of system latency.
Peripheral latency + PCL + display latency gives you the full picture on E2E system latency. With PCL Stats, you can measure per-frame PCL autonomously—without any external devices or interventions.
To measure this critical portion of the system latency pipeline, integrate PC Latency Stats (through the NVIDIA Reflex SDK or Unreal Engine plugin) into your game. Once integrated, PCL can be measured in real time through FrameView or GeForce Experience in-game overlay.
Figure 2 shows all the interactions that FrameView will record when PCL Stats is integrated. This information is key to understanding and measuring latency.
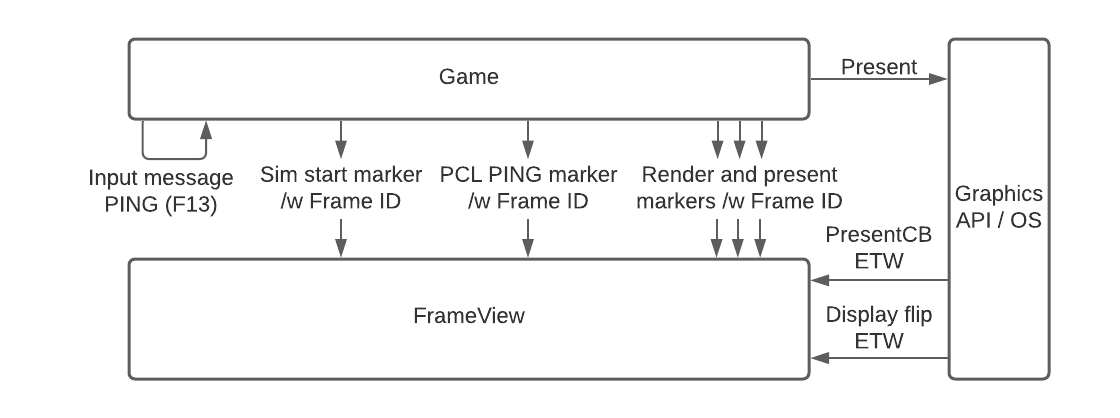
How PC Latency Stats emits an event log
Your game is responsible for posting unique “ping” messages to itself at random 100 to 300 ms intervals. It also emits the corresponding PCLStatsInput Event Tracing for Windows (ETW) events.
ETW is a Windows OS mechanism that enables you to trace and log events. On game engines that filter out unique messages, PCL Stats can instead post virtual keyboard input messages such as F13.
When the game samples this message, it tags the frame with a PC_LATENCY_PING marker ETW event. The game also logs the frame ID at the start of each frame with the SIMULATION_START marker ETW event, and at the start/end of each Present() call with the PRESENT_START/END marker ETW events.
On game engines that do not allow the Present() calls to be bracketed, the RENDER_START/END marker ETW events are used to log the frame ID, bracketing the render submissions. For a list of tagged events, see Table 1.
| ETW Event Name | Parameter (Marker) | Parameter |
|---|---|---|
| PCLStatsInput | ||
| PCLStatsEvents | PC_LATENCY_PING | Frame ID |
| SIMULATION_START | Frame ID | |
| SIMULATION_END | Frame ID | |
| RENDERSUBMIT_START | Frame ID | |
| RENDERSUBMIT_START | Frame ID | |
| PRESENT_START | Frame ID | |
| PRESENT_END | Frame ID |
FrameView and PC Latency
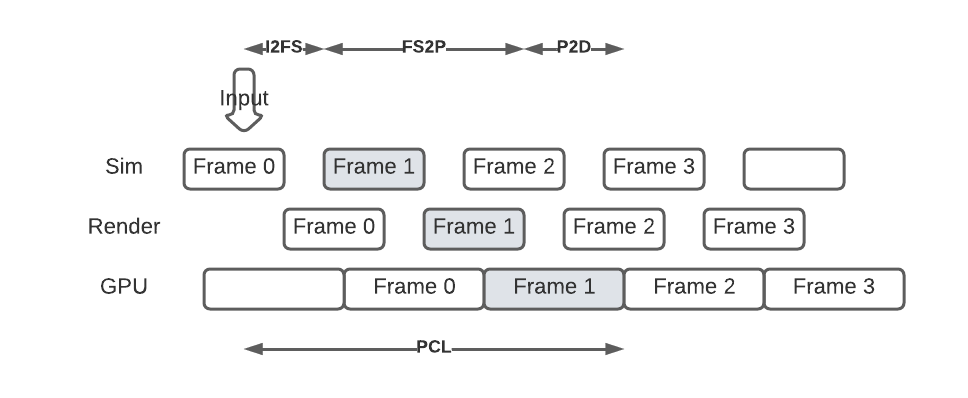
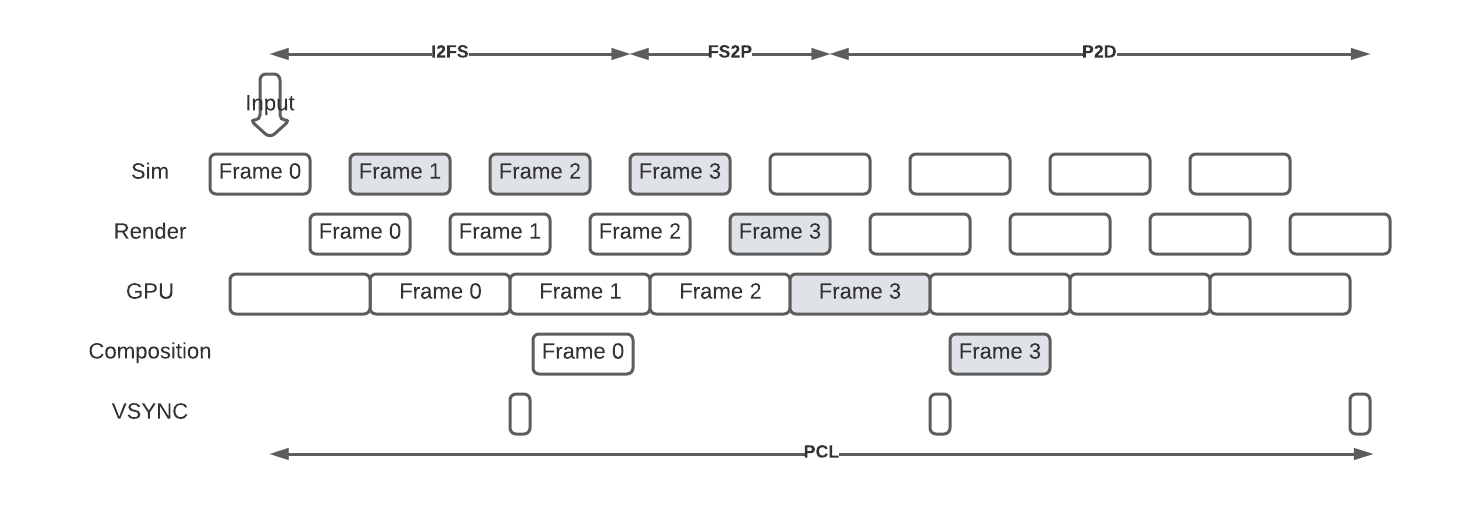
FrameView is an application that leverages the open-source project PresentMon for measuring frame rates, frame times, power, and performance-per-watt on GPUs. Using the frame IDs in the PCL Stats ETW events, FrameView can track each frame through the different stages of the gaming pipeline.
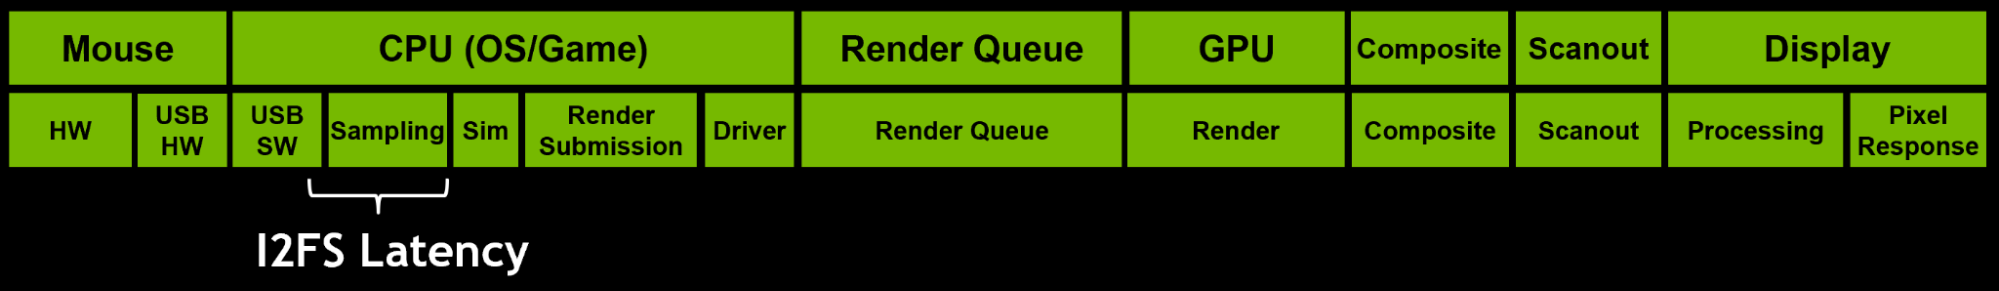
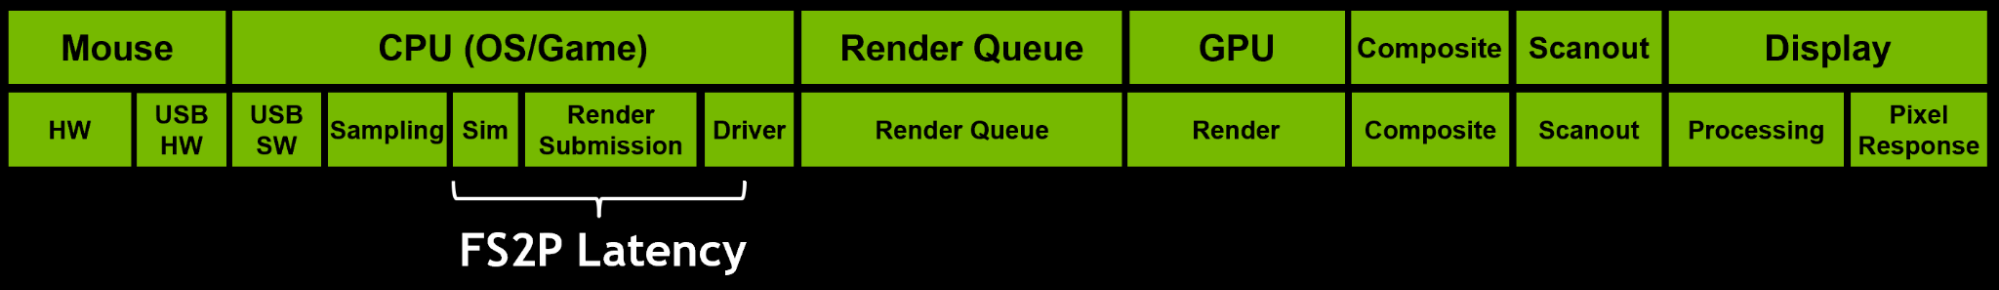
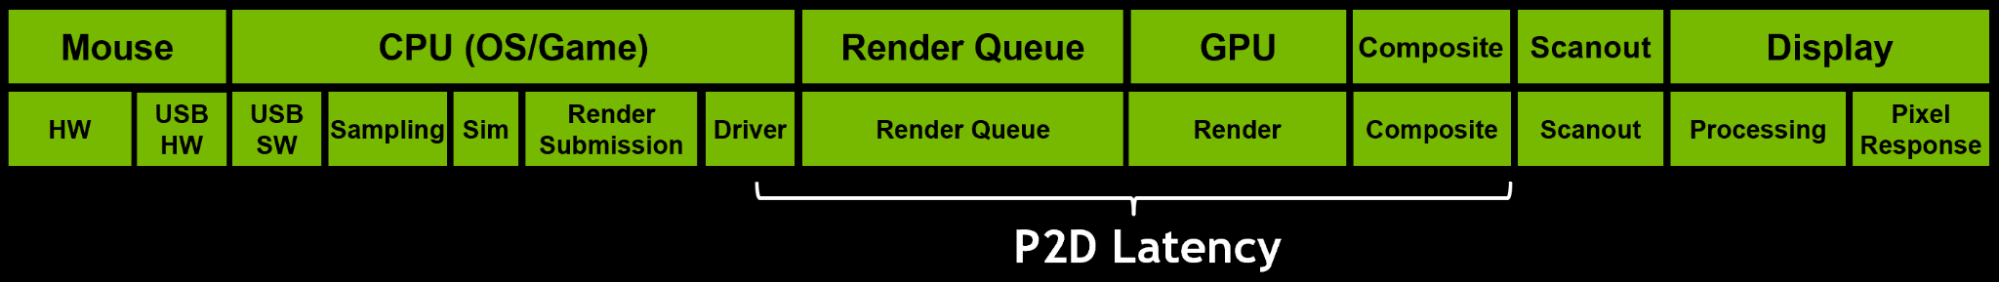
PC Latency is the summation of the average input-to-frame-start (I2FS) latency, frame-start-to-present (FS2P) latency, and present-to-displayed (P2D) latency. Each of these terms is defined below.
I2FS latency
I2FS latency is the time between the PCLStatsInput ETW event and the SIMULATION_START marker of the next frame that is tagged with the PC_LATENCY_PING marker.
The I2FS latency values are typically spread evenly across the input sampling interval. The game is sampling input periodically, and the I2FS latency of each input varies depending on when exactly the input happens in between two samples. It is therefore necessary to calculate the average I2FS latency before including it in PCL.
Note that due to the heuristics used, the I2FS latency measurement would not be correct when the game falls below 10 FPS. In most cases, the I2FS latency is very close to the “sampling latency.” Sampling latency refers to the waiting time between clicks from a mouse to being sampled by the game.
FS2P latency
FS2P latency is the time between the SIMULATION_START marker and the Present() call. This is the total time the CPU spends on the frame.
FS2P can be measured on each frame, even without inputs. In most cases where the Present() call is made right at the end of render submit, the FS2P latency is very close to the “game latency.” Game latency refers to the time it takes for the CPU to process inputs or changes to the world and submit a new frame to the GPU to be rendered.
P2D latency
P2D latency is the time between the Present() call and the frame buffer flip. PresentMon already measures this value as msUntilDisplayed. Note that the P2D latency does not include the display scanout latency. The display scanout latency is a component of display latency.
Summing the average I2FS latency, FS2P latency, and P2D latency results in PCL. Note that this PCL calculation does not include the USB SW latency. The assumption is that the USB SW latency is consistent, relatively small, and can therefore be represented by a small offset.
How PCL Stats handles frame drops
In windowed mode, some frames can be dropped and not shown on the display. This impacts PCL in the following two ways:
- The dropped frames would not have present-to-displayed latency.
- The
PC_LATENCY_PINGmarker can be tagged to a dropped frame.
Dropped frames are not shown to the user and should be ignored in system latency measurement. Additionally, if the tagged frame is dropped, the correct input-to-frame-start latency must be extended to incorporate the time between the SIMULATION_START marker (SSM) of the tagged frame and the SSM of the next frame that is not dropped.
For example, while running a 200 FPS game in windowed mode with a 60 Hz display, for every frame displayed, two to three frames are dropped. Suppose the input-to-frame-start latency is measured to 2.5 ms initially on the dropped frame X. The time between the SSM of frame X and the SSM of frame X+1 is 5ms. Frame X+1 is also dropped. And the time between the SSM of frame X+1 and the SSM of frame X+2 is 4.5 ms. Frame X+2 is shown to the user. In this example, the correct input-to-frame-start latency is the summation of the dropped frames: 2.5 + 5 + 4.5 = 12 ms.
Summary
Reducing system latency is critical for the smoothest gaming experience. With several components of PC Latency demystified, you can leverage PCL Stats to accurately track, measure, and improve the latency within your rendering pipeline.
Download the latest version of PCL Stats through the NVIDIA Reflex SDK and get more information, including integration tips. PCL Stats is also mainlined within Unreal Engine. You can also join the conversation on the NVIDIA forums.
