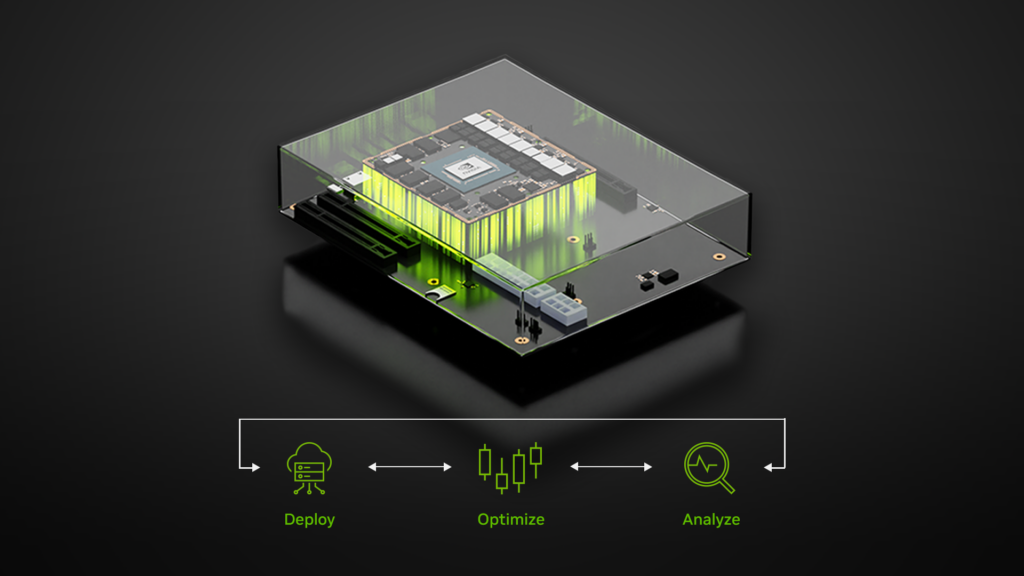
When working with embedded systems such as the Jetson modules, you must optimize your application based on your power budget and compute resources. To avoid performance or even thermal throttling issues, monitoring these resources becomes really important.
Jetson modules are designed with a GPU, CPU, and various AI accelerators. They also feature a high-efficiency power management integrated circuit (PMIC), voltage regulators, and a power tree to optimize power efficiency. NVIDIA provides several tools and resources that can help you take advantage of the power architecture and optimize your resource usage:
- Various power modes
- Power, thermal, and electrical management features
- A Jetson Power GUI for monitoring power and thermal status
- Tegrastats for providing command-line statistics regarding the module
- JTOP
Jetson power modes
Each Jetson module supports multiple preconfigured power modes that are optimized for certain power budgets: 10 Watts, 15 Watts, 30 Watts, and so on. For each power budget, there are various configurations possible in terms of resource utilization.
These power modes are set using nvpmodel, and you can choose to use one of the preconfigured modes or create a custom power mode that is tuned to your requirements. The nvpmodel configuration enables a certain number of online GPU TPC, CPU, DLA, and PVA cores, along with certain frequencies, to keep the module within a certain power budget.
MAXN mode is also available as an unconstrained power mode. It enables the maximum number of cores and clock frequencies for the various processors and engines that can then be tuned to create custom power modes that balance performance and power consumption.
Power, thermal, and electrical management features
Jetson provides various power, thermal, and electrical management features:
- Clock gating
- Power gating
- Dynamic voltage frequency scaling
- Deep sleep (SC7) modes
- Idle power modes
For more information, see Supported Modes and Power Efficiency in the Jetson Linux Developer Guide.
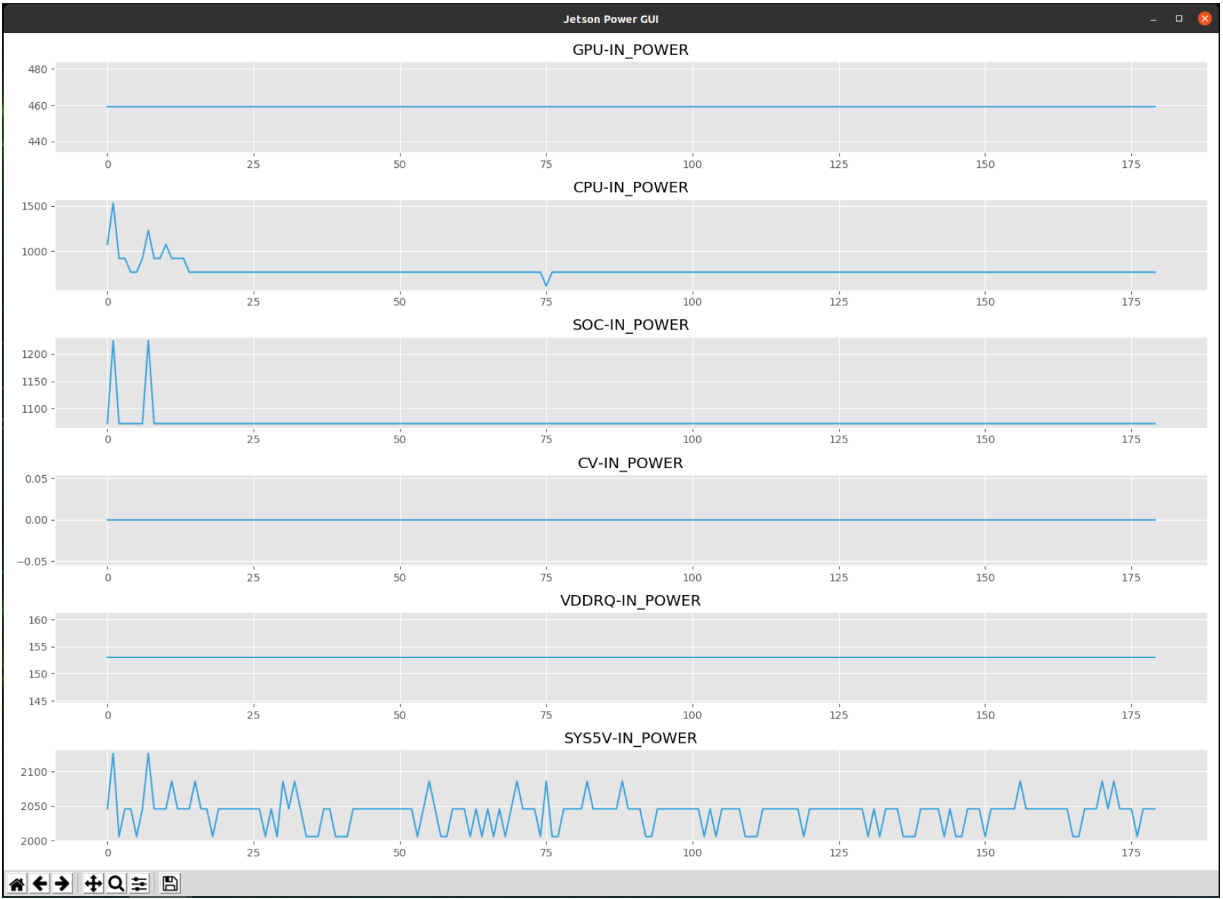
Jetson Power GUI
There are many tools that NVIDIA provides with JetPack that can assist you in thermal and power management. One such tool is the Jetson Power GUI, which gets installed as part of the JetPack image.
The Jetson Power GUI lets you monitor the power and thermal status of the Jetson board. With the Main tab, you can track CPU and GPU usage, as well as the device temperature. With real-time monitoring, you can quickly identify any performance bottlenecks or excessive power consumption that may lead to performance throttling.
With the Jetson Power GUI, you can adjust power modes, which optimize the trade-off between performance and power consumption. You can choose from one of the predefined power modes depending on the Jetson board that you are using.
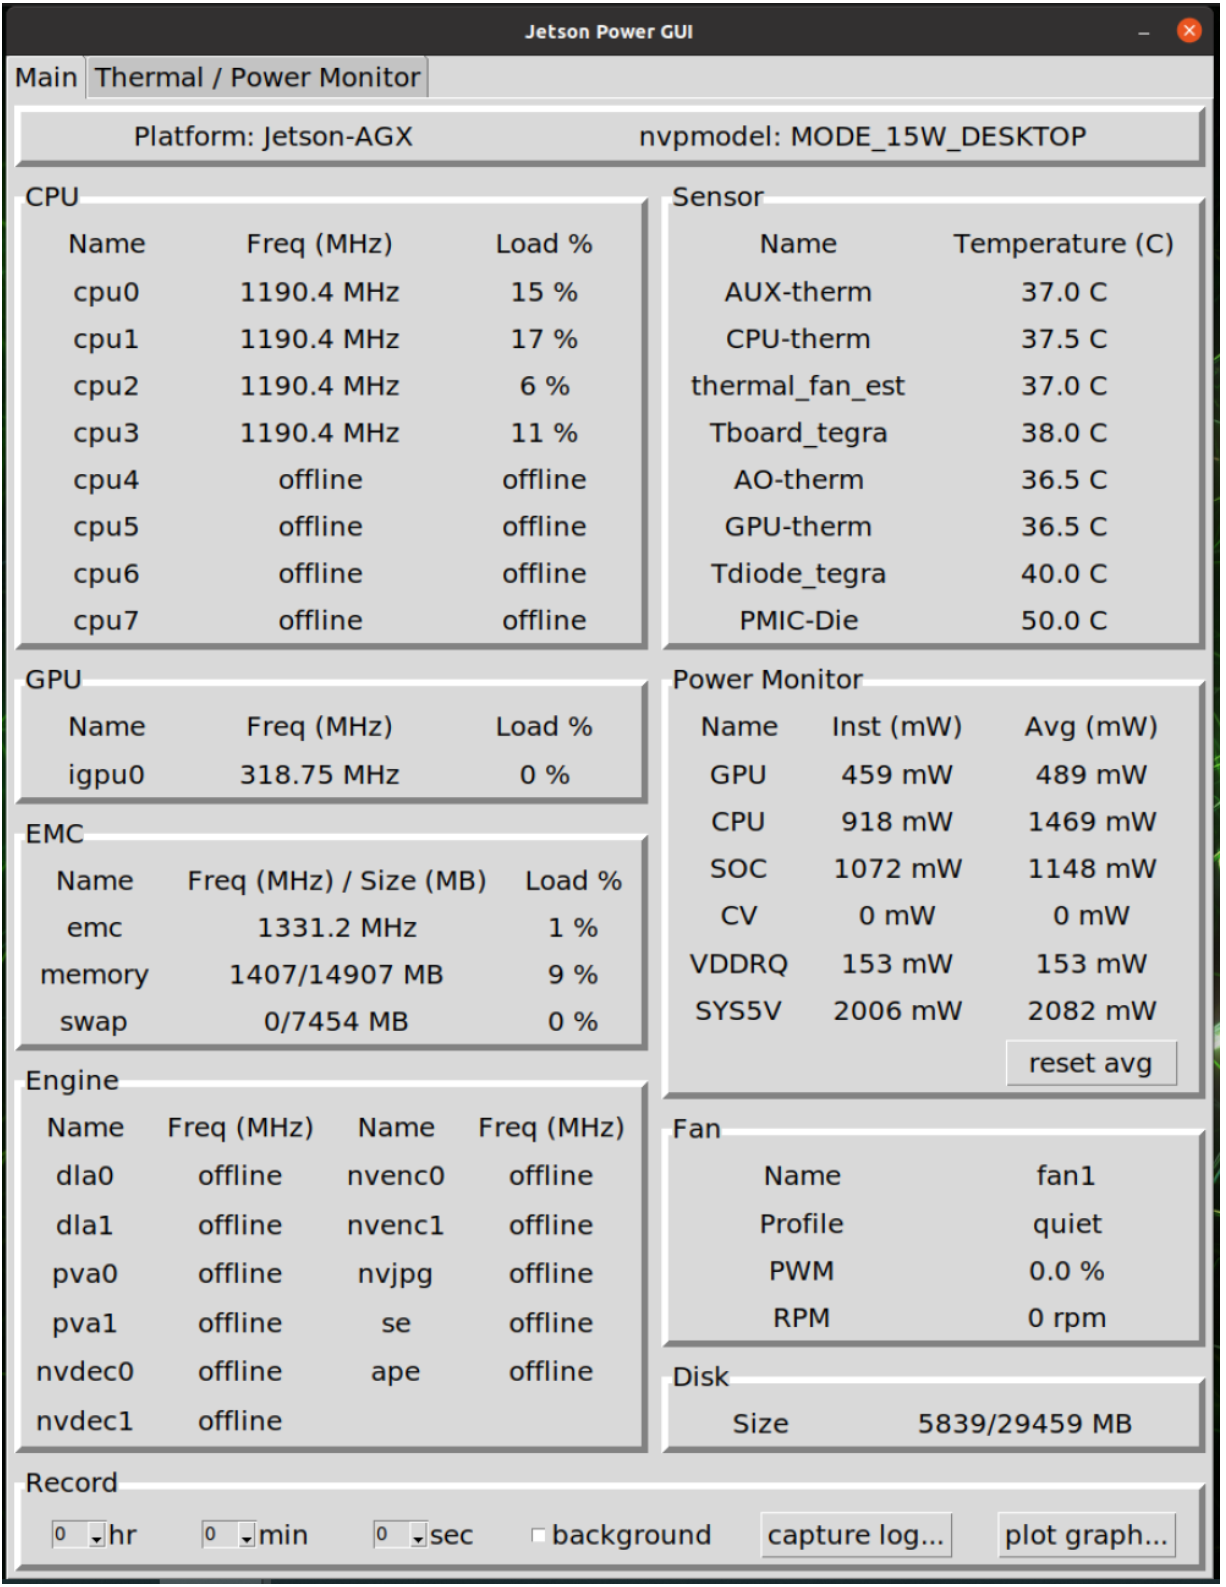
The Power GUI tool also enables you to record pertinent power-related information to a log file for a specific duration. This is useful for capturing and analyzing behavior during specific tasks or specific time duration. For example, you could capture information about the performance of Jetson within the first 3 minutes of startup.
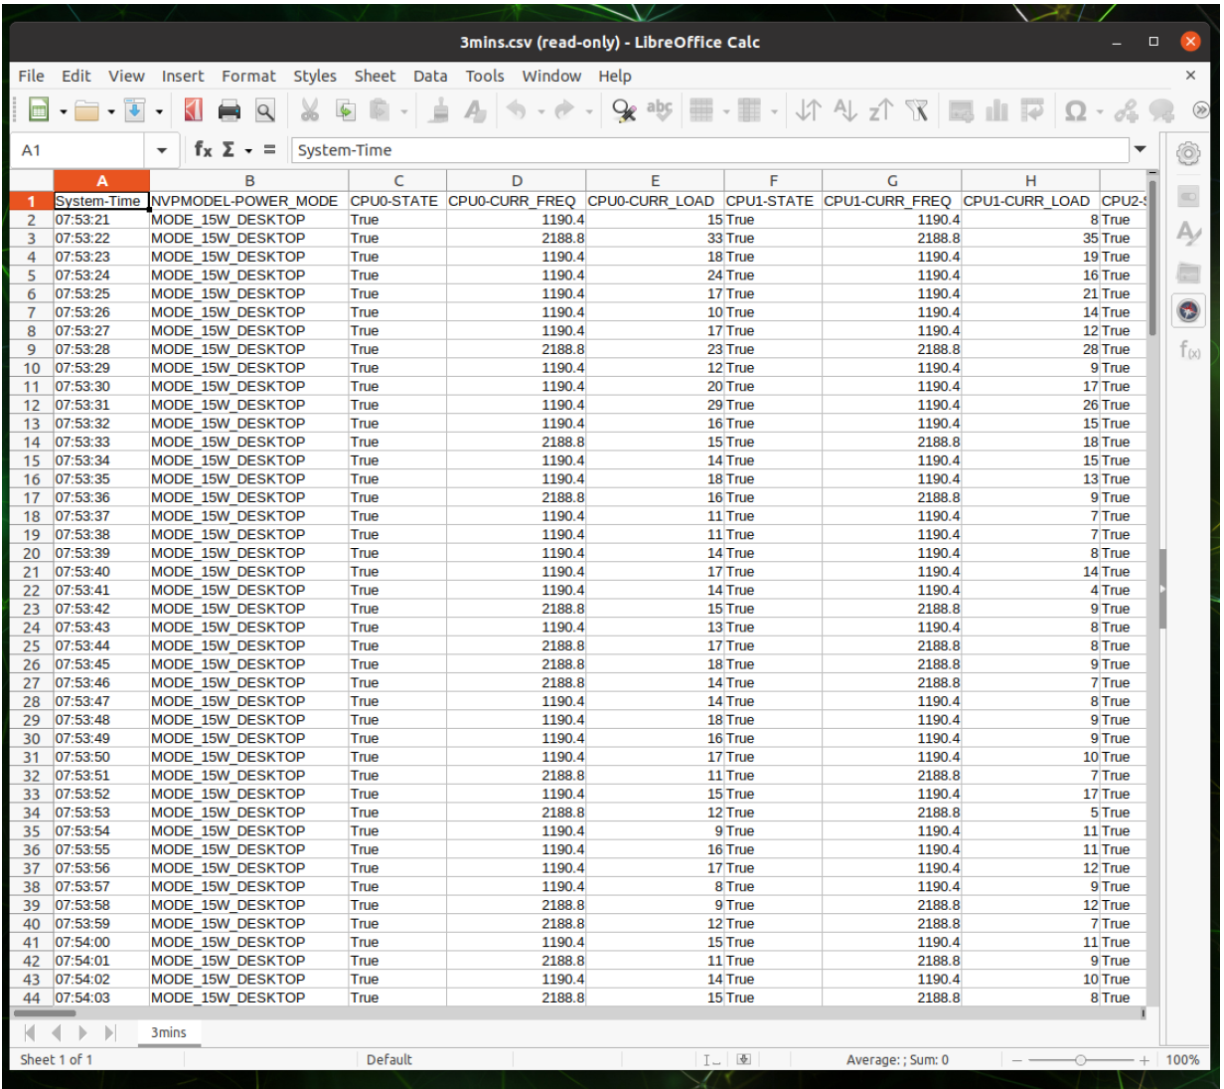
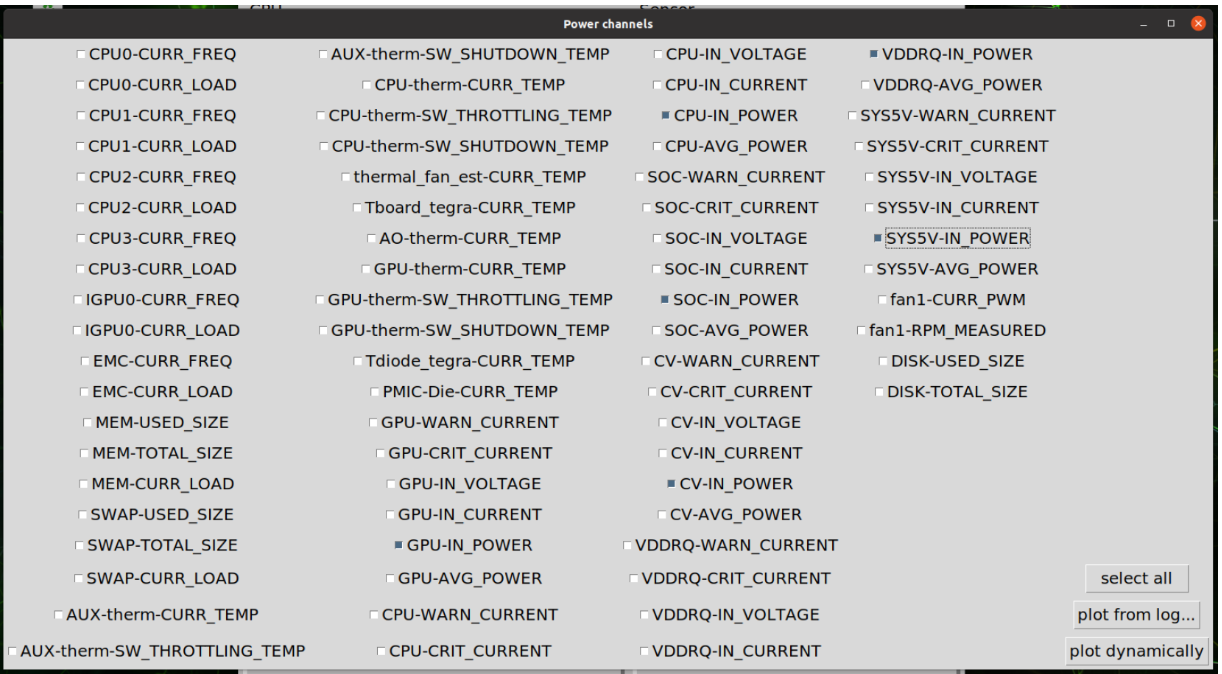
The plot graph… button provides data visualization functionality, so you can plot real-time, power-related information. The captured log file can also be used to plot a graph to help you visualize with even more simplicity how your system is performing.
Tegrastats
Tegrastats is a command line utility provided by NVIDIA that reports memory and processor usage on the Jetson platform. This utility is provided with JetPack and can be found at <top>/core/utils/tegrastats.
Tegrastats provides insights into several usage metrics, such as CPU, GPU, and memory. It also gives you the ability to monitor power consumption and provides real-time updates on power usage. These metrics are crucial in understanding how the system is performing.
Tegrastats also offers information about thermal behavior, such as the operating temperature for the CPU and GPU. This can help you prevent thermal throttling.
Usage
To use the Tegrastats utility on Jetson, use the following commands.
In the foreground, run the following command:
$ tegrastats —interval <int>
In this command, <int> is the interval between log prints in milliseconds. By default, Tegrastats updates the statistics every second.
In the background, run the following command:
$ tegrastats —interval <int> -logfile <out_file> &
In this command, <out_file> is the pathname of the output file to which Tegrastats writes the log prints.
The following is a sample print of Tegrastats:
RAM 1545/31919MB (lfb 7400x4MB) SWAP 0/15959MB (cached 0MB) CPU
[0%@1190,0%@1190,0%@1190,0%@1190,0%@1190,0%@1190,0%@1190,0%@1190]
EMC_FREQ 1%@408 GR3D_FREQ 0%@318 VIC_FREQ 0%@115 APE 150 MTS fg 0% bg 0%
AO@38C GPU@39.5C Tdiode@43.25C PMIC@100C AUX@38.5C CPU@39.5C
thermal@38.8C Tboard@39C GPU 0/0 CPU 468/468 SOC 937/937 CV 0/0 VDDRQ
312/234 SYS5V 1458/1458
Tegrastats can also be integrated into scripts or applications to capture system statistics, which enables more automation scenarios.
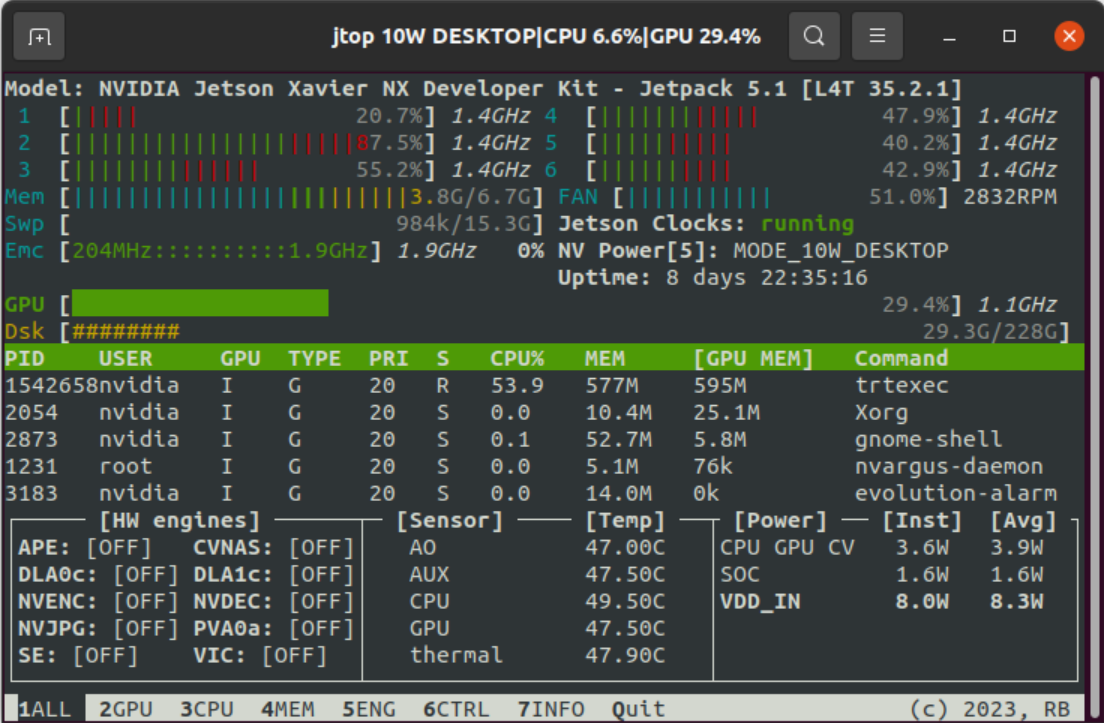
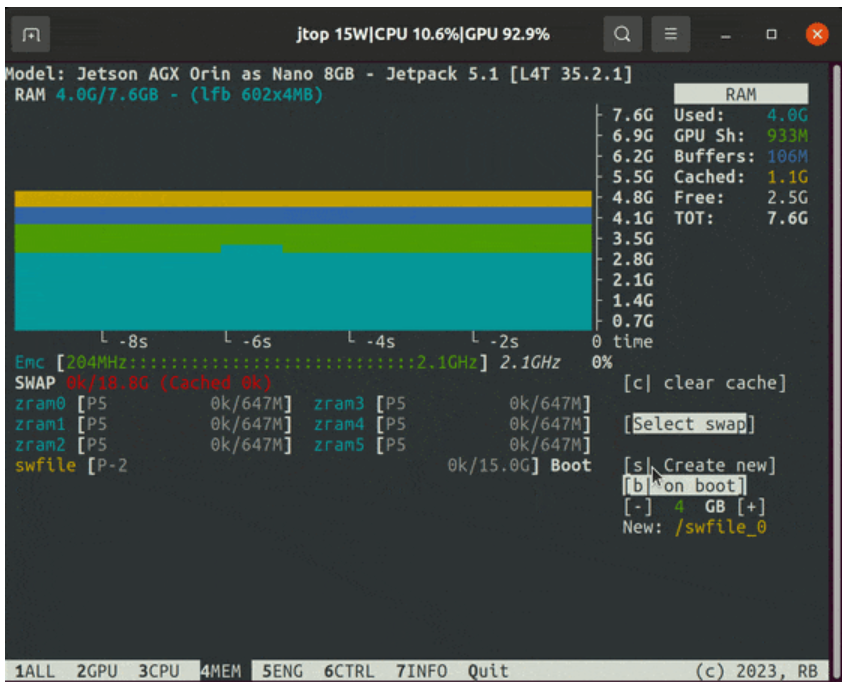
JTOP (Jetson-stats)
JTOP is a user-friendly way to monitor and control the resources on the Jetson. It can help you visualize and understand various bottlenecks in your applications. For example, it shows whether an application is heavy on memory operations or an application is not using the hardware-accelerated engines in the Jetson module. In this way, JTOP leads to a more efficient and streamlined application optimized for the Jetson module.
JTOP is specifically designed for monitoring and managing NVIDIA Jetson modules:
- NVIDIA Orin
- NVIDIA Xavier
- NVIDIA Nano
- NVIDIA TX
It provides real-time updates about system performance. This enables you to analyze the CPU and GPU usage, operating temperature, memory usage, and other relevant information.
With JTOP, this information can be accessed in a GUI for better visualization of the information. This way, it provides a convenient way to keep track of the system’s metrics and performance figures, especially when running heavy AI workloads.
JTOP also brings out the capability to tweak the system’s performance. You can select the power mode in which they want their Jetson devices to be running, as well as control over the fan speed. This helps in optimizing system performance and thermals.
JTOP is especially useful for building a system on a power budget but still squeezing out the maximum performance possible. To install it, use pip:
$ sudo apt update
$ sudo apt-get install python3-pip
$ sudo pip install -u jetson-stats
Use the jtop command:
$ jtop
The JTOP tool is also available as a Python library with APIs that enable you to include JTOP functions in your scripts with ease.
from jtop import jtop

with jtop() as jetson:
	while jetson.ok():
		#read jetson stats
		print(jetson.stats)
For more information, see the following video from JetsonHacks.
Get started with optimizing your power today
The NVIDIA Jetson platform is continuously advancing the edge inference performance for robotics and edge AI. It is an important factor in most edge AI applications to follow a power budget. With the NVIDIA tools, you can monitor system performance and model a custom power profile.
For more information, see the following resources:
- Supported Modes and Power Efficiency
- JTOP (jetson-stats) User Guide
- Troubleshooting (Jetson_stats)
- /rbonghi/ros_jetson_stats GitHub repo
- /NVIDIA-AI-IOT/ros2_jetson_stats GitHub repo
With all the tools mentioned in this post, you can easily create a power-efficient and performance-optimized system for your application.