Modern computer architectures have a hierarchy of memories of varying size and performance. GPU architectures are approaching a terabyte per second memory bandwidth that, coupled with high-throughput computational cores, creates an ideal device for data-intensive tasks. However, everybody knows that fast memory is expensive. Modern applications striving to solve larger and larger problems can be limited by GPU memory capacity. Since the capacity of GPU memory is significantly lower than system memory, it creates a barrier for developers accustomed to programming just one memory space. With the legacy GPU programming model there is no easy way to “just run” your application when you’re oversubscribing GPU memory. Even if your dataset is only slightly larger than the available capacity, you would still need to manage the active working set in GPU memory.
Unified Memory is a much more intelligent memory management system that simplifies GPU development by providing a single memory space directly accessible by all GPUs and CPUs in the system, with automatic page migration for data locality. Migration of pages allows the accessing processor to benefit from L2 caching and the lower latency of local memory. Moreover, migrating pages to GPU memory ensures GPU kernels take advantage of the very high bandwidth of GPU memory (e.g. 720 GB/s on a Tesla P100). And page migration is all completely invisible to the developer: the system automatically manages all data movement for you. Sounds great, right? With the Pascal GPU architecture Unified Memory is even more powerful, thanks to Pascal’s larger virtual memory address space and Page Migration Engine, enabling true virtual memory demand paging.
It’s also worth noting that manually managing memory movement is error-prone, which affects productivity and delays the day when you can finally run your whole code on the GPU to see those great speedups that others are bragging about. Developers can spend hours debugging their codes because of memory coherency issues. Unified memory brings huge benefits for developer productivity.
In this post I will show you how Pascal can enable applications to run out-of-the-box with larger memory footprints and achieve great baseline performance. For a moment you can completely forget about GPU memory limitations while developing your code.
New Pascal Unified Memory Features
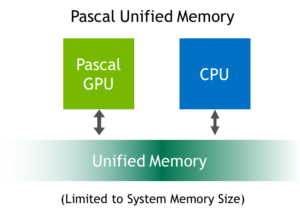
Unified Memory was introduced in 2014 with CUDA 6 and the Kepler architecture. This relatively new programming model allowed GPU applications to use a single pointer in both CPU functions and GPU kernels, which greatly simplified memory management. CUDA 8 and the Pascal architecture significantly improves Unified Memory functionality by adding 49-bit virtual addressing and on-demand page migration. The large 49-bit virtual addresses are sufficient to enable GPUs to access the entire system memory plus the memory of all GPUs in the system. The Page Migration engine allows GPU threads to fault on non-resident memory accesses so the system can migrate pages from anywhere in the system to the GPUs memory on-demand for efficient processing.
In other words, Unified Memory transparently enables out-of-core computations for any code that is using Unified Memory for allocations (e.g. `cudaMallocManaged()`). It “just works” without any modifications to the application. CUDA 8 also adds new ways to optimize data locality by providing hints to the runtime so it is still possible to take full control over data migrations.
These days it’s hard to find a high-performance workstation with just one GPU. Two-, four- and eight-GPU systems are becoming common in workstations as well as large supercomputers. The NVIDIA DGX-1 is one example of a high-performance integrated system for deep learning with 8 Tesla P100 GPUs. If you thought it was difficult to manually manage data between one CPU and one GPU, now you have 8 GPU memory spaces to juggle between. Unified Memory is crucial for such systems and it enables more seamless code development on multi-GPU nodes. Whenever a particular GPU touches data managed by Unified Memory, this data may migrate to local memory of the processor or the driver can establish a direct access over the available interconnect (PCIe or NVLINK).
Many applications can benefit from GPU memory oversubscription and the page migration capabilities of Pascal architecture. Data analytics and graph workloads usually run search queries on terabytes of sparse data. Predicting access patterns is extremely difficult in this scenario, especially if the queries are dynamic. Not only computational tasks but other domains like high-quality visualization can greatly benefit from Unified Memory. Imagine a ray tracing engine that shoots a ray which can bounce off in any direction depending on material surface. If the scene does not fit in GPU memory the ray may easily hit a surface that is not available and has to be fetched from CPU memory. In this case computing what pages should be migrated to GPU memory at what time is almost impossible without true GPU page fault capabilities.
Let’s look at an interesting example that shows how Unified Memory enables out-of-core simulations for combustion applications and how to analyze and optimize memory movements with new user hints added in CUDA 8.
HPGMG AMR Proxy
Efficient real-world physics simulations for combustion engines use the adaptive mesh refinement technique (AMR) to focus computational resources in regions of interest without wasting resources in regions that require less resolution. This method requires a hierarchy of progressively coarser structured grid representations of the mesh. AMR and geometric multigrid (GMG) solvers usually go hand in hand. It’s natural to use multigrid to solve equations during the AMR advance step because of the available structured representation of the mesh. To showcase GPU memory oversubscription I used a modified version of HPGMG, a state-of-the-art geometric multigrid code, that mirrors the memory access pattern and computation workload of production AMR combustion applications. The proxy was created using HPGMG code to allow researchers to gain some insight into active working set sizes and potential reuse without having to port a complete application. Figure 3 shows a high resolution view of multiple levels of refinement in the simulation.
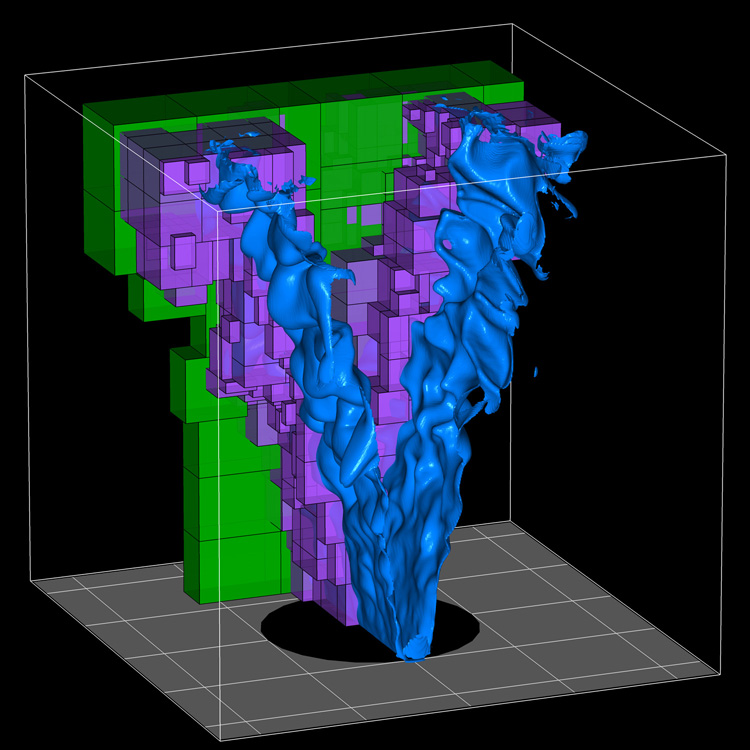
You can find more details about the GPU implementation of HPGMG in my previous Parallel Forall blog post. Unified Memory plays an integral part in the hybrid implementation using both CPU and GPU processors to solve coarse and fine multigrid levels, respectively. It helped to preserve the same data structures and avoid any manual data manipulations. To enable GPU acceleration I only needed to add low-level GPU kernels for various stencil operations and update allocations to use cudaMallocManaged() instead of malloc(), with no changes to data structures or high-level multigrid code.
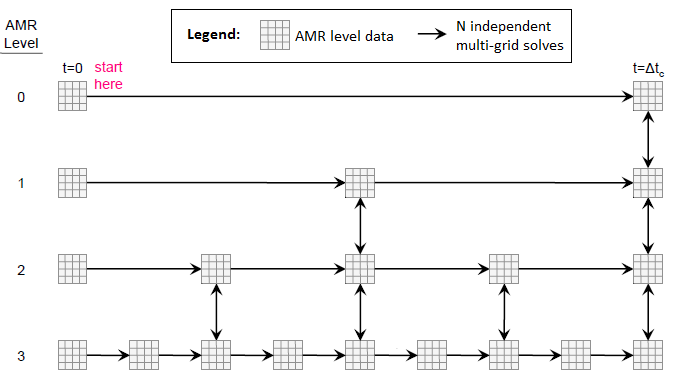
HPGMG AMR proxy is a special modification of the HPGMG driver code that introduces multiple AMR levels which are solved in a particular order to mirror the reuse pattern found in real-world scenarios. Figure 4 shows the order in which different AMR levels are accessed to perform the multigrid solve. The following pseudocode describes a typical AMR advance function (MGSolve stands for “Multigrid Solve”).
advance(AMR_level) {
  1 elliptic projection MGSolve
  N (independent) diffusion MGSolves
  1 elliptic nodal projection MGSolve
  if (AMR_level < finest_AMR_level) {
    advance(AMR_level+1)
    advance(AMR_level+1)
    // now sync coarse and fine AMR levels
    averageDown(AMR_level,AMR_level+1) // fine to coarse
    1 elliptic correction projection MGSolve
    N diffusion correction MGSolves
    // recursively interpolate corrections to finer levels
    1 elliptic nodal projection solve (AMR_level, AMR_level+1)
  }
}
In the 4-level example of Figure 4 the sequence in which we access the levels is: 0 1 2 3 3 2 3 3 2 1 2 3 3 2 3 3 2 1 0. Note that depending on the AMR level size it is possible to keep one or more levels completely in GPU memory and perform enough computations on the GPU to amortize the data migration cost. This is a very important application characteristic that can help establish data locality and reuse in GPU memory. Many other applications with a similar high compute to memory ratio can efficiently stage data in and out of GPU memory without losing much performance.
Thanks to Unified Memory on Pascal our proxy application can easily run very large problems with total memory footprint exceeding GPU memory size. Absolutely no changes to the code are required! Figure 5 shows performance results for x86 CPU- and POWER8 CPU-based systems with a Tesla P100 using PCI-e and NVLINK CPU-GPU interconnect, respectively.
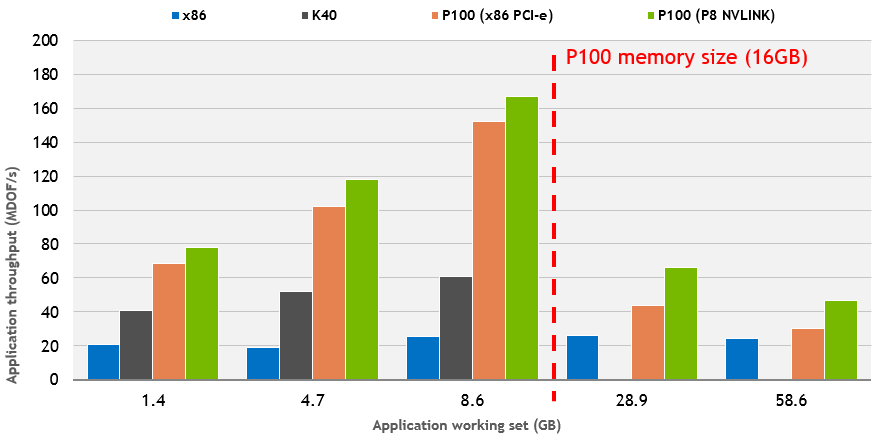
In the chart in Figure 5 I used 5 AMR levels and the level sizes were 128^3 (1.4GB), 192^3 (4.7GB), 256^3 (8.6GB), 384^3 (28.9GB) and 512^3 (58.6GB). For the first three datasets all 5 AMR levels can fit completely in GPU memory for both K40 and P100 so that the data migration takes only a small fraction of the overall time. Note that NVLINK speeds up the data migration for Tesla P100, and it slightly improves overall throughput as well up to 15%. Also, increasing data size improves GPU utilization which explains the performance boost going from 1.4GB to 8.6GB.
The fourth dataset (28.9GB) represents a true GPU memory oversubscription scenario where only two AMR levels can fit into GPU memory. This test case can only run on Pascal GPUs. With NVLINK the performance loss is only about 50% of the maximum throughput, and GPU performance is still about 3x faster than the CPU code. For the fifth dataset (58.6GB) only one level can fit completely into GPU memory, and communication overhead starts to dominate application performance. Nevertheless, the results are very encouraging considering that without Unified Memory we simply could not even run the last two datasets on the GPU!
Let’s dive into the NVLINK performance numbers. Our application has both CPU and GPU workloads, so it’s unclear whether the improvement on the P8 system comes from the added interconnect bandwidth or differences in the CPU architectures. To clarify this point I ran additional experiments by disabling individual links to limit available bandwidth to system memory. Figure 6 shows application throughput for 3 configurations of achievable interconnect bandwidth on the same system.
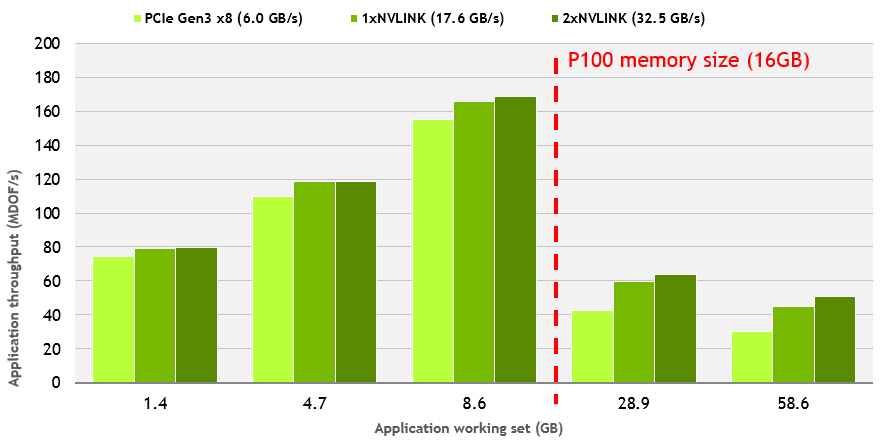
Analyzing the last two datasets (28.9GB and 58.6GB) shows that improvement in interconnect bandwidth alone from 6GB/s to 32.5GB/s results in a 1.7x net application speedup. Note that the speedup is not linear with respect to the bandwidth increase and clearly there are other factors contributing to the Unified Memory performance. Let’s see if we can improve performance using the new Unified Memory hints API in CUDA 8, after a brief diversion on how to profile the Unified Memory behavior.
Unified Memory Profiling
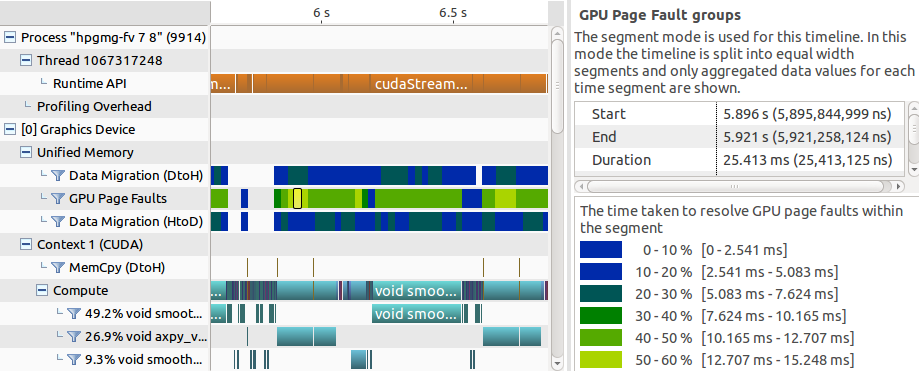
The NVIDIA Visual Profiler is one of the most important tools that every GPU developer who cares about performance should get familiar with. It can help you identify hot spots and performance problems in your application and guide you through the optimization process. CUDA 8 adds several new features related to Unified Memory profiling. First, a new segmented mode groups Unified Memory events on the timeline to present a high-level view (see Figure 7). The segments are colored according to their weight highlighting migrations and faults that take most of the time.
After you identify the region of interest, it is always possible to switch back to the standard mode with separate Unified Memory events to inspect them in detail. Figure 8 shows the timeline with page faults and migration events for the HPGMG AMR proxy: we can see the virtual address and reason for every migration event. In this particular case the 2MB page is evicted to free space for other data that is being accessed by the GPU.
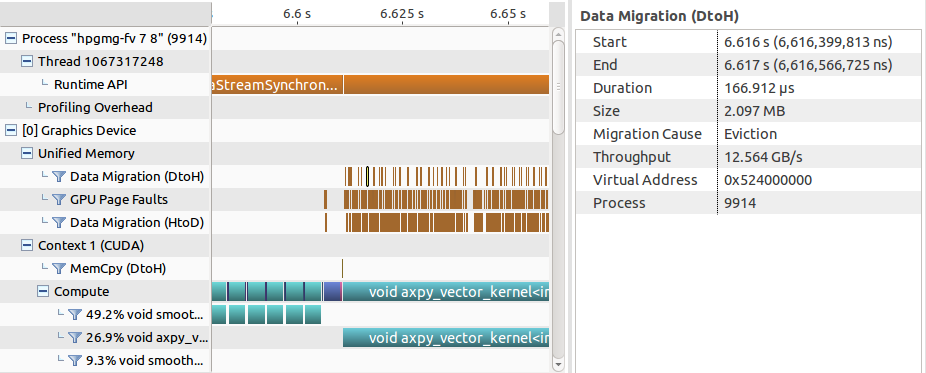
Although the timeline mode is useful to find which kernels generated GPU page faults, in CUDA 8 Unified Memory events do not correlate back to the application code. This is crucial for CPU page faults since you don’t have any information about CPU functions on the timeline without additional code instrumentation. Page faults are expensive and it is possible to get rid of them by using data prefetching hints. But how can we find which allocations are triggering the faults? By selecting a particular Unified Memory event you can inspect its properties like virtual address, type of fault, and reason for migration. Then you can print out the virtual addresses of your key data structures and figure out which ones caused the migrations. However, if you have hundreds or thousands of page faults in different parts of your application, inspecting them one by one on the timeline can be cumbersome. I will show two simple ways to automate this process.
The first approach is to load the nvprof output data through the `sqlite` module in Python. This option does not require any modifications to the code and you can even analyze an `nvprof` trace captured by someone else. After loading the `nvprof` database you can open the Unified Memory table `CUPTI_ACTIVITY_KIND_UNIFIED_MEMORY_COUNTER` to analyze the events and correlate page fault addresses back to your code.
Alternatively, one can use the CUPTI API to collect Unified Memory events during the application run. This option is great if you want more flexibility and filter events or to explore auto-tuning heuristics inside your application. For more details check out the examples provided with the CUDA toolkit and the Unified Memory counter reference in the CUDA programming guide. Using these tricks you can easily track down the remaining faults and eliminate them by prefetching data to the corresponding processor (more details on prefetching below).
More profiling features specifically targeting Unified Memory are in the works and coming in future CUDA releases to simplify profiling memory access performance. Meanwhile, I’d recommend to use all the information you can get from the profiler and create your own simple scripts around it to collect necessary statistics.
Optimizing Performance with Prefetching and Usage Hints
From analyzing the profiler timeline and page faults it’s clear that once we hit the GPU memory limit, the driver starts evicting old pages. It happens on-demand, creating additional overhead which is two-fold. First, the page fault processing takes a significant amount of time. Second, the migration latency is completely exposed. But don’t worry, we can fix it; this is why we have hints in CUDA 8.
In my proxy code I know the sequence in which the levels are processed, so I can inform the driver to prefetch necessary data structures in advance using cudaMemPrefetchAsync(), new in CUDA 8. Moreover, the prefetching operation can be issued in a separate CUDA stream and overlapped with some compute work executing on the GPU. Since HPGMG uses the default stream to launch kernels, we need to create a non-blocking stream to enable concurrent processing of the prefetches. You can learn more about non-blocking streams in a blog post covering stream functionality introduced in CUDA 7.
The next step is to figure out where in the code we should add the prefetching hints. It’s important to make sure prefetches are scheduled while GPU is working on the other AMR levels to avoid any conflicts. Figure 9 shows how compute kernels and prefetching operations can be executed in parallel to overlap computations and data movements. Note that the least-recently-used levels will be automatically evicted by the driver when there is not enough free memory available during prefetching.

Although `cudaMemPrefetchAsync()` is an asynchronous operation with respect to the GPU, note that the CPU could still be involved as it needs to initiate page migration and update page mappings. Therefore, for better overlap with GPU kernels we need to make sure enough GPU work is scheduled in advance. This is not a big problem for most applications running completely on the GPU. However, the HPGMG code uses a hybrid approach with coarse levels solved on the CPU. In this case a prefetching operation can be submitted to a separate stream after all GPU levels are scheduled but before we synchronize GPU work to start the coarse levels processing. This strategy enables the largest possible overlap and provides a significant performance boost.
Generally, Unified Memory maintains a single active copy of any page, and migrations are triggered by user hints or page faults. However, sometimes it is useful to create multiple copies of the data or pin pages to system memory and enable zero-copy access. CUDA 8 provides the new `cudaMemAdvise()` API which provides a set of memory usage hints that allow finer grain control over managed allocations.
In the hybrid multigrid code there are inter-communications between CPU and GPU levels, such as restriction and interpolation kernels. The same data is accessed by two processors many times within a single multigrid cycle. There is no reuse once the data is moved and the overhead of processing page faults outweighs any benefits from keeping the data local to the processor. To optimize this phase it is possible to pin regions to CPU memory and establish a direct mapping from the GPU by using a combination of `cudaMemAdviseSetPreferredLocation` and `cudaMemAdviseSetAccessedBy` usage hints respectively:
cudaMemAdvise(ptr, size, cudaMemAdviseSetPreferredLocation, cudaCpuDeviceId);
cudaMemAdvise(ptr, size, cudaMemAdviseSetAccessedBy, myGpuId);
A similar optimization is possible on pre-Pascal architectures, but it requires using the special `cudaMallocHost()` allocator for zero-copy memory.
Another useful hint is `cudaMemAdviseSetReadMostly` which automatically duplicates data on a specified processor. Writing to such memory is allowed and doing so will invalidate all the copies, so it’s a very expensive operation. This is why it’s called read-mostly which tells the CUDA driver that such memory region will be mostly read from and only occasionally written to. In HPGMG I used it for the block decomposition structure and for smoothing coefficients that are constant throughout the application execution and shared between the CPU and GPU. It helps to isolate and eliminate the remaining CPU page faults and keep the Unified Memory profile clean during GPU memory oversubscription.
Let’s look at the updated results using Unified Memory performance hints and prefetching (Figure 10).
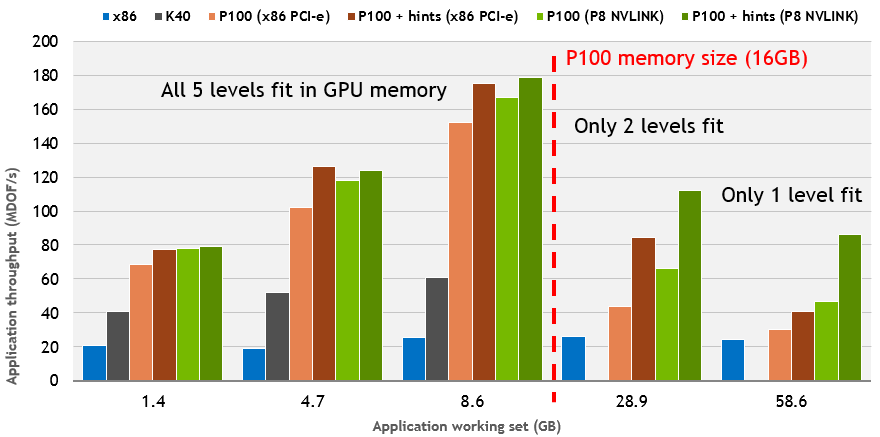
This is much better, especially with NVLINK between the CPU and GPU! The hints and prefetching even improved the 4.7GB and 8.6GB cases that can fit into GPU memory by staging data in advance and reducing the initial overhead from the first touch. In the oversubscription scenario with 28.9GB the code version with hints and prefetching almost doubled performance compared to the default mode for both PCIe and NVLINK. Overall, the throughput loss vs. the in-core cases is only about 30% for NVLINK. For the largest problem (58.6GB) only one level can be resident in GPU memory and prefetching the next level will accidentally evict current data that is being worked on. In this case the prefetching didn’t have significant impact on performance for the PCIe system, but proved to be still efficient for NVLINK due to better page migration rate. A more sophisticated prefetching solution that splits the grid into multiple parts can help improve performance even further, but this a good topic for another post.
OpenACC Applications Can Benefit Too!
So far I have only talked about GPU applications written in CUDA. But let’s take a step back and think about what Unified Memory on Pascal can enable for OpenACC applications. One of the biggest advantages of the compiler directives approach is that you don’t need to modify existing programs significantly or write new functions for accelerators. OpenACC compilers can analyze your hints and convert loops into GPU programs automatically. Unified Memory greatly expands these benefits by completely removing the burden of memory management from the developer. Check out my blog post about how to be more productive with OpenACC and Unified Memory.
With the new extended functionality of Pascal, OpenACC programs can become even more powerful. Similarly to the CUDA case, it is possible to run datasets that exceed GPU memory capacity without any modifications to the application. Figure 11 shows updated results for LULESH, a Lagrangian hydrodynamics mini application from Lawrence Livermore National Laboratory: Tesla P100 is almost 3 times faster than Tesla K40.
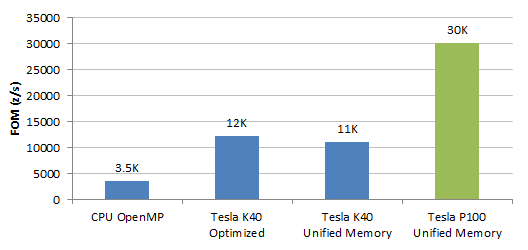
Currently it is not possible to specify hints to guide the OpenACC compiler to improve data locality in the Unified Memory mode. However, it is easy to see how OpenACC `data` region directives could evolve into prefetching hints in the future.
Conclusion
In this post I demonstrated how the new Unified Memory capabilities of Pascal GPUs can enable applications to go beyond the GPU memory limit and sustain high performance without much developer effort. If you want to go further and optimize the data movements, there are profiling tools that can help you pinpoint problematic regions, and with a little bit of manual work you can track down the data structures involved in migrations and faults. Use the new Unified Memory hints in CUDA 8 to establish direct access, duplicate memory regions or prefetch the data in advance to avoid page faults and increase performance. Finally, the compiler directives approach provides a great option for portability to various architectures, and OpenACC applications can also benefit from all the goodness of Unified Memory on Pascal.
