My previous introductory post, “An Even Easier Introduction to CUDA C++“, introduced the basics of CUDA programming by showing how to write a simple program that allocated two arrays of numbers in memory accessible to the GPU and then added them together on the GPU. To do this, I introduced you to Unified Memory, which makes it very easy to allocate and access data that can be used by code running on any processor in the system, CPU or GPU.
I finished that post with a few simple “exercises”, one of which encouraged you to run on a recent Pascal-based GPU to see what happens. (I was hoping that readers would try it and comment on the results, and some of you did!). I suggested this for two reasons. First, because Pascal GPUs such as the NVIDIA Titan X and the NVIDIA Tesla P100 are the first GPUs to include the Page Migration Engine, which is hardware support for Unified Memory page faulting and migration. The second reason is that it provides a great opportunity to learn more about Unified Memory.
Fast GPU, Fast Memory… Right?
Right! But let’s see. First, I’ll reprint the results of running on two NVIDIA Kepler GPUs (one in my laptop and one in a server).
| Laptop (GeForce GT 750M) | Server (Tesla K80) | |||
|---|---|---|---|---|
| Version | Time | Bandwidth | Time | Bandwidth |
| 1 CUDA Thread | 411ms | 30.6 MB/s | 463ms | 27.2 MB/s |
| 1 CUDA Block | 3.2ms | 3.9 GB/s | 2.7ms | 4.7 GB/s |
| Many CUDA Blocks | 0.68ms | 18.5 GB/s | 0.094ms | 134 GB/s |
Now let’s try running on a really fast Tesla P100 accelerator, based on the Pascal GP100 GPU.
> nvprof ./add_grid
...
Time(%)      Time     Calls       Avg       Min       Max  Name
100.00%  2.1192ms         1  2.1192ms  2.1192ms  2.1192ms  add(int, float*, float*)
Hmmmm, that’s under 6 GB/s: slower than running on my laptop’s Kepler-based GeForce GPU. Don’t be discouraged, though; we can fix this. To understand how, I’ll have to tell you a bit more about Unified Memory.
For reference in what follows, here’s the complete code to add_grid.cu from last time.
#include <iostream>
#include <math.h>

// CUDA kernel to add elements of two arrays
__global__
void add(int n, float *x, float *y)
{
  int index = blockIdx.x * blockDim.x + threadIdx.x;
  int stride = blockDim.x * gridDim.x;
  for (int i = index; i < n; i += stride)
    y[i] = x[i] + y[i];
}

int main(void)
{
  int N = 1<<20;
  float *x, *y;

  // Allocate Unified Memory -- accessible from CPU or GPU
  cudaMallocManaged(&x, N*sizeof(float));
  cudaMallocManaged(&y, N*sizeof(float));

  // initialize x and y arrays on the host
  for (int i = 0; i < N; i++) {
    x[i] = 1.0f;
    y[i] = 2.0f;
  }

  // Launch kernel on 1M elements on the GPU
  int blockSize = 256;
  int numBlocks = (N + blockSize - 1) / blockSize;
  add<<<numBlocks, blockSize>>>(N, x, y);

  // Wait for GPU to finish before accessing on host
  cudaDeviceSynchronize();

  // Check for errors (all values should be 3.0f)
  float maxError = 0.0f;
  for (int i = 0; i < N; i++)
    maxError = fmax(maxError, fabs(y[i]-3.0f));
  std::cout << "Max error: " << maxError << std::endl;

  // Free memory
  cudaFree(x);
  cudaFree(y);

  return 0;
}
The code that allocates and initializes the memory is on lines 19-27.
What is Unified Memory?
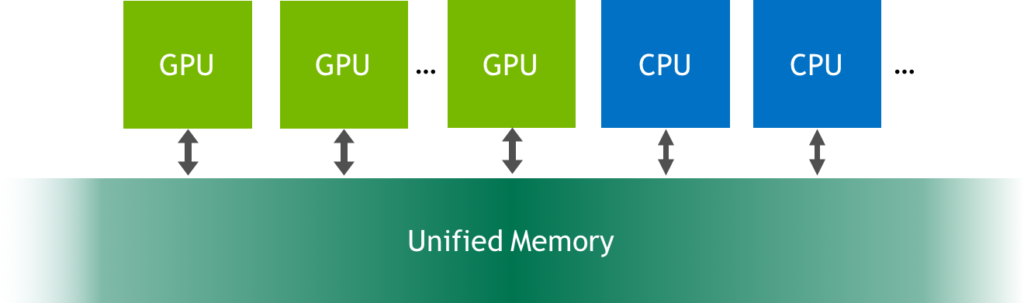
Unified Memory is a single memory address space accessible from any processor in a system (see Figure 1). This hardware/software technology allows applications to allocate data that can be read or written from code running on either CPUs or GPUs. Allocating Unified Memory is as simple as replacing calls to malloc() or new with calls to cudaMallocManaged(), an allocation function that returns a pointer accessible from any processor (ptr in the following).
cudaError_t cudaMallocManaged(void** ptr, size_t size);
When code running on a CPU or GPU accesses data allocated this way (often called CUDA managed data), the CUDA system software and/or the hardware takes care of migrating memory pages to the memory of the accessing processor. The important point here is that the Pascal GPU architecture is the first with hardware support for virtual memory page faulting and migration, via its Page Migration Engine. Older GPUs based on the Kepler and Maxwell architectures also support a more limited form of Unified Memory.
What Happens on Kepler When I call cudaMallocManaged()?
On systems with pre-Pascal GPUs like the Tesla K80, calling cudaMallocManaged() allocates size bytes of managed memory on the GPU device that is active when the call is made1. Internally, the driver also sets up page table entries for all pages covered by the allocation, so that the system knows that the pages are resident on that GPU.
So, in our example, running on a Tesla K80 GPU (Kepler architecture), x and y are both initially fully resident in GPU memory. Then in the loop starting on line 6, the CPU steps through both arrays, initializing their elements to 1.0f and 2.0f, respectively. Since the pages are initially resident in device memory, a page fault occurs on the CPU for each array page to which it writes, and the GPU driver migrates the page from device memory to CPU memory. After the loop, all pages of the two arrays are resident in CPU memory.
After initializing the data on the CPU, the program launches the add() kernel to add the elements of x to the elements of y.
add<<<1, 256>>>(N, x, y);
On pre-Pascal GPUs, upon launching a kernel, the CUDA runtime must migrate all pages previously migrated to host memory or to another GPU back to the device memory of the device running the kernel2. Since these older GPUs can’t page fault, all data must be resident on the GPU just in case the kernel accesses it (even if it won’t). This means there is potentially migration overhead on each kernel launch.
That’s what happens in my program when I run it on K80 or my Macbook Pro. Note, however, that the profiler shows the kernel run time separate from the migration time, since the migrations happen before the kernel runs.
==15638== Profiling application: ./add_grid
==15638== Profiling result:
Time(%)      Time     Calls       Avg       Min       Max  Name
100.00%  93.471us         1  93.471us  93.471us  93.471us  add(int, float*, float*)

==15638== Unified Memory profiling result:
Device "Tesla K80 (0)"
   Count  Avg Size  Min Size  Max Size  Total Size  Total Time  Name
       6  1.3333MB  896.00KB  2.0000MB  8.000000MB  1.154720ms  Host To Device
     102  120.47KB  4.0000KB  0.9961MB  12.00000MB  1.895040ms  Device To Host
Total CPU Page faults: 51
What Happens on Pascal When I call cudaMallocManaged()?
On Pascal and later GPUs, managed memory may not be physically allocated when cudaMallocManaged() returns; it may only be populated on access (or prefetching). In other words, pages and page table entries may not be created until they are accessed by the GPU or the CPU. The pages can migrate to any processor’s memory at any time, and the driver employs heuristics to maintain data locality and prevent excessive page faults3. (Note: Applications can guide the driver using cudaMemAdvise(), and explicitly migrate memory using cudaMemPrefetchAsync(), as this blog post describes).
Unlike the pre-Pascal GPUs, the Tesla P100 supports hardware page faulting and migration. So in this case the runtime doesn’t automatically copy all the pages back to the GPU before running the kernel. The kernel launches without any migration overhead, and when it accesses any absent pages, the GPU stalls execution of the accessing threads, and the Page Migration Engine migrates the pages to the device before resuming the threads.
This means that the cost of the migrations is included in the kernel run time when I run my program on the Tesla P100 (2.1192 ms). In this kernel, every page in the arrays is written by the CPU, and then accessed by the CUDA kernel on the GPU, causing the kernel to wait on a lot of page migrations. That’s why the kernel time measured by the profiler is longer on a Pascal GPU like Tesla P100. Let’s look at the full nvprof output for the program on P100.
==19278== Profiling application: ./add_grid
==19278== Profiling result:
Time(%)      Time     Calls       Avg       Min       Max  Name
100.00%  2.1192ms         1  2.1192ms  2.1192ms  2.1192ms  add(int, float*, float*)

==19278== Unified Memory profiling result:
Device "Tesla P100-PCIE-16GB (0)"
   Count  Avg Size  Min Size  Max Size  Total Size  Total Time  Name
     146  56.109KB  4.0000KB  988.00KB  8.000000MB  860.5760us  Host To Device
      24  170.67KB  4.0000KB  0.9961MB  4.000000MB  339.5520us  Device To Host
      12         -         -         -           -  1.067526ms  GPU Page fault groups
Total CPU Page faults: 36
As you can see, there are many host-to-device page faults, reducing the throughput achieved by the CUDA kernel.
What Should I Do About This?
In a real application, the GPU is likely to perform a lot more computation on data (perhaps many times) without the CPU touching it. The migration overhead in this simple code is caused by the fact that the CPU initializes the data and the GPU only uses it once. There are a few different ways that I can eliminate or change the migration overhead to get a more accurate measurement of the vector add kernel performance.
- Move the data initialization to the GPU in another CUDA kernel.
- Run the kernel many times and look at the average and minimum run times.
- Prefetch the data to GPU memory before running the kernel.
Let’s look at each of these three approaches.
Initialize the Data in a Kernel
If we move initialization from the CPU to the GPU, the add kernel won’t page fault. Here’s a simple CUDA C++ kernel to initialize the data. We can just replace the host code that initializes x and y with a launch of this kernel.
__global__ void init(int n, float *x, float *y) {
  int index = threadIdx.x + blockIdx.x * blockDim.x;
  int stride = blockDim.x * gridDim.x;
  for (int i = index; i < n; i += stride) {
    x[i] = 1.0f;
    y[i] = 2.0f;
  }
}
When I do this, I see both kernels in the profile on the Tesla P100 GPU:
==44292== Profiling application: ./add_grid_init
==44292== Profiling result:
Time(%)      Time     Calls       Avg       Min       Max  Name
 98.06%  1.3018ms         1  1.3018ms  1.3018ms  1.3018ms  init(int, float*, float*)
  1.94%  25.792us         1  25.792us  25.792us  25.792us  add(int, float*, float*)

==44292== Unified Memory profiling result:
Device "Tesla P100-PCIE-16GB (0)"
   Count  Avg Size  Min Size  Max Size  Total Size  Total Time  Name
      24  170.67KB  4.0000KB  0.9961MB  4.000000MB  344.2880us  Device To Host
      16         -         -         -           -  551.9940us  GPU Page fault groups
Total CPU Page faults: 12
The add kernel now runs much faster: 25.8us, which equates to nearly 500 GB/s. Here’s how to calculate that bandwidth.
Bandwidth = Bytes / Seconds = (3 * 4,194,304 bytes * 1e-9 bytes/GB) / 25.8e-6s = 488 GB/s
(To learn about calculating theoretical and achieved bandwidth, see this post.) There are still device-to-host page faults, but this is due to the loop at the end of the program that checks the results on the CPU.
Run It Many Times
Another approach is to just run the kernel many times and look at the average time in the profiler. To do this I need to modify my error checking code so that the results are reported correctly. Here are the results of running the kernel 100 times on a Tesla P100:
==48760== Profiling application: ./add_grid_many
==48760== Profiling result:
Time(%)      Time     Calls       Avg       Min       Max  Name
100.00%  4.5526ms       100  45.526us  24.479us  2.0616ms  add(int, float*, float*)

==48760== Unified Memory profiling result:
Device "Tesla P100-PCIE-16GB (0)"
   Count  Avg Size  Min Size  Max Size  Total Size  Total Time  Name
     174  47.080KB  4.0000KB  0.9844MB  8.000000MB  829.2480us  Host To Device
      24  170.67KB  4.0000KB  0.9961MB  4.000000MB  339.7760us  Device To Host
      14         -         -         -           -  1.008684ms  GPU Page fault groups
Total CPU Page faults: 36
The minimum kernel run time was just 24.5 microseconds, which means it is achieving over 500GB/s of memory bandwidth. I also included the Unified Memory profiling output from nvprof, which shows a total of 8MB of page faults from host to device, corresponding to the two 4MB arrays (x and y) copied to the device via page faults the first time add runs.
Prefetching
The third approach is to use Unified Memory prefetching to move the data to the GPU after initializing it. CUDA provides cudaMemPrefetchAsync() for this purpose. I can add the following code just before the kernel launch.
  // Prefetch the data to the GPU
  int device = -1;
  cudaGetDevice(&device);
  cudaMemPrefetchAsync(x, N*sizeof(float), device, NULL);
  cudaMemPrefetchAsync(y, N*sizeof(float), device, NULL);

  // Run kernel on 1M elements on the GPU
  int blockSize = 256;
  int numBlocks = (N + blockSize - 1) / blockSize;
  saxpy<<<numBlocks, blockSize>>>(N, 1.0f, x, y);
Now when I profile on the Tesla P100, I get the following output.
==50360== Profiling application: ./add_grid_prefetch
==50360== Profiling result:
Time(%)      Time     Calls       Avg       Min       Max  Name
100.00%  26.112us         1  26.112us  26.112us  26.112us  add(int, float*, float*)

==50360== Unified Memory profiling result:
Device "Tesla P100-PCIE-16GB (0)"
   Count  Avg Size  Min Size  Max Size  Total Size  Total Time  Name
       4  2.0000MB  2.0000MB  2.0000MB  8.000000MB  689.0560us  Host To Device
      24  170.67KB  4.0000KB  0.9961MB  4.000000MB  346.5600us  Device To Host
Total CPU Page faults: 36
Here you can see that the kernel ran just once, taking 26.1us—similar to the fastest of 100 runs shown before. You can also see that there are no longer any GPU page faults reported, and the Host to Device transfers are shown as just four 2MB transfers, thanks to prefetching.
Now that we have it running fast on P100, let’s add it to the results table from last time.
| Laptop (GeForce GT 750M) | Server (Tesla K80) | Server (Tesla P100) | ||||
|---|---|---|---|---|---|---|
| Version | Time | Bandwidth | Time | Bandwidth | Time | Bandwidth |
| 1 CUDA Thread | 411ms | 30.6 MB/s | 463ms | 27.2 MB/s | NA | NA |
| 1 CUDA Block | 3.2ms | 3.9 GB/s | 2.7ms | 4.7 GB/s | NA | NA |
| Many CUDA Blocks | 0.68ms | 18.5 GB/s | 0.094ms | 134 GB/s | 0.025ms | 503 GB/s |
A Note on Concurrency
Keep in mind that your system has multiple processors running parts of your CUDA application concurrently: one or more CPUs and one or more GPUs. Even in our simple example, there is a CPU thread and one GPU execution context. Therefore, we have to be careful when accessing the managed allocations on either processor, to ensure there are no race conditions.
Simultaneous access to managed memory from the CPU and GPUs of compute capability lower than 6.0 is not possible. This is because pre-Pascal GPUs lack hardware page faulting, so coherence can’t be guaranteed. On these GPUs, an access from the CPU while a kernel is running will cause a segmentation fault.
On Pascal and later GPUs, the CPU and the GPU can simultaneously access managed memory, since they can both handle page faults; however, it is up to the application developer to ensure there are no race conditions caused by simultaneous accesses.
In our simple example, we have a call to cudaDeviceSynchronize() after the kernel launch. This ensures that the kernel runs to completion before the CPU tries to read the results from the managed memory pointer. Otherwise, the CPU may read invalid data (on Pascal and later), or get a segmentation fault (on pre-Pascal GPUs).
The Benefits of Unified Memory on Pascal and Later GPUs
Starting with the Pascal GPU architecture, Unified Memory functionality is significantly improved with 49-bit virtual addressing and on-demand page migration. 49-bit virtual addresses are sufficient to enable GPUs to access the entire system memory plus the memory of all GPUs in the system. The Page Migration engine allows GPU threads to fault on non-resident memory accesses so the system can migrate pages on demand from anywhere in the system to the GPU’s memory for efficient processing.
In other words, Unified Memory transparently enables oversubscribing GPU memory, enabling out-of-core computations for any code that is using Unified Memory for allocations (e.g. cudaMallocManaged()). It “just works” without any modifications to the application, whether running on one GPU or multiple GPUs.
Also, Pascal and Volta GPUs support system-wide atomic memory operations. That means you can atomically operate on values anywhere in the system from multiple GPUs. This is useful in writing efficient multi-GPU cooperative algorithms.
Demand paging can be particularly beneficial to applications that access data with a sparse pattern. In some applications, it’s not known ahead of time which specific memory addresses a particular processor will access. Without hardware page faulting, applications can only pre-load whole arrays, or suffer the cost of high-latency off-device accesses (also known as “Zero Copy”). But page faulting means that only the pages the kernel accesses need to be migrated.
Where To From Here?
I hope that this post has helped you continue learning CUDA programming and that you are interested in learning more and applying CUDA C++ in your own computations. If you have questions or comments, don’t hesitate to reach out using the comments section below.
For more on Unified Memory prefetching and also usage hints (cudaMemAdvise()), see the post
Beyond GPU Memory Limits with Unified Memory on Pascal. If you’d like to learn about explicit memory management in CUDA using cudaMalloc and cudaMemcpy, see the old post An Easy Introduction to CUDA C/C++.
We plan to follow up this post with more CUDA programming material, but to keep you busy for now, there is a whole series of older introductory posts that you can continue with.
- How to Implement Performance Metrics in CUDA C++
- How to Query Device Properties and Handle Errors in CUDA C++
- How to Optimize Data Transfers in CUDA C++
- How to Overlap Data Transfers in CUDA C++
- How to Access Global Memory Efficiently in CUDA C++
- Using Shared Memory in CUDA C++
- An Efficient Matrix Transpose in CUDA C++
- Finite Difference Methods in CUDA C++, Part 1
- Finite Difference Methods in CUDA C++, Part 2
There is also a series of CUDA Fortran posts mirroring the above, starting with An Easy Introduction to CUDA Fortran.
You might also be interested in the DLI course on CUDA C/C++ programming or the prior Udacity course, Intro to Parallel Programming (CS344) (now available as a playlist on YouTube).
There is a wealth of other content on CUDA C++ and other GPU computing topics here on the NVIDIA Developer Blog, so look around!
1 Technically, this is a simplification. On multi-GPU systems with pre-Pascal GPUs, if some of the GPUs have peer-to-peer access disabled, the memory will be allocated so it is initially resident on the CPU.
2 Strictly speaking, you can restrict visibility of an allocation to a specific CUDA stream by using cudaStreamAttachMemAsync(). This allows the driver to migrate only pages attached to the stream the kernel is launched on. By default, managed allocations are attached to all streams so any kernel launch will trigger migrations. Read more in the CUDA programming guide.
3 The device attribute concurrentManagedAccess tells whether the GPU supports hardware page migration and the concurrent access functionality it enables. A value of 1 indicates support. At this time it is only supported on Pascal and newer GPUs running on 64-bit Linux.