Game development is complicated, and even the most mature pipelines can hit snags that will bring performance to a crawl. ‘Nsight Graphics: GPU Trace’ helps developers identify GPU inefficiencies as they crop up, taking the guesswork out of the process.
NVIDIA’s Louis Bavoil provides a useful tip to consider when using Nsight Graphics: GPU Trace with DX12 apps: “If you’re in a state where GPU active is great – maybe 99 or 100% – look at the GPU side, and measure the top throughput metrics per GPU unit. If the top one is greater than 80%, then you know that you are throughput limited by that unit. The first thing to do is remove work from that unit, and you will see a speed up.”

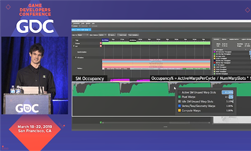
The video below explains the P3 (peak-perf%) method of assessing GPU limitations. It’s a seven-minute excerpt from a full GDC 19 talk, entitled Optimizing DX12/DXR GPU Workloads using ‘Nsight Graphics: GPU Trace’ and the Peak-Performance-Percentage Method. The full talk can be found on NVIDIA Developer Zone here.
In the full GDC presentation, Louis explains how ‘Nsight Graphics: GPU Trace’ can be used to determine the performance limiters of any DX12 workload on NVIDIA Turing GPUs, and improve performance by applying architecture-aware optimizations. Because the tool captures all of its metrics in a single pass (no frame replay), it can be used on DX12 frames that use asynchronous compute or copy queues. After recapping what the Peak-Performance-Percentage Method is, the talk shows how it can be applied to unlock perf speedups on various workloads, including: compute shaders with large thread-group sizes, pixel shaders with out-of-order completion, ray-tracing BVH updates and ray-tracing denoisers.
If you are working on Ray Traced games, Nsight Graphics has a number of great GPU debugging and profiling features which support both DXR and NVIDIA VKRay. Download the latest version for free here: Nsight Graphics 2019.3.