
In our previous exploration of graph analytics, we uncovered the transformative power of GPU-CPU fusion using NVIDIA cuGraph. Building upon those insights, we now introduce a revolutionary new architecture that redefines the boundaries of graph processing.
The evolution of graph processing
During our earlier foray into graph analytics, we faced various challenges with the architecture we utilized. While effective, this architecture posed barriers that impeded both setup and performance.

Challenges with the previous architecture
- Dependency on disk: We are using disk-based data transfer between TigerGraph and cuGraph, which poses limitations on scalability and performance. Data transfer between components relies on temporary disk, introducing latency and potential bottlenecks.
- Python dependency: Utilizing Python for cuGraph introduces overhead and complexity, impacting performance, especially in compute-intensive tasks like graph processing.
- Thrift layer: Thrift communication adds complexity and overhead, potentially affecting system reliability.
Implications for setup and performance
These dependencies not only complicated the setup process, but also posed challenges for achieving optimal performance. The need for shared disk infrastructure, coupled with Python-based services and Thrift communication, created a system that was difficult to configure and scale efficiently.
In our quest for accelerated graph analytics, it became apparent that a paradigm shift was necessary. Enter the next-generation architecture, a revolutionary approach designed to overcome the limitations of its predecessor and unlock new frontiers in graph processing. Let’s explore this groundbreaking architecture in detail.
Introducing the next-gen architecture
In our quest to revolutionize graph analytics, we crafted a next-generation architecture that represents a paradigm shift in graph processing. Built entirely in C++, this architecture leverages cutting-edge technologies to achieve unprecedented levels of performance and scalability.
Understanding the GSQL Query Execution Process in TigerGraph
Before delving into the intricacies of our new architecture, it’s crucial to understand how GSQL queries are traditionally executed within the TigerGraph cluster:
Step 1: Compilation
GSQL queries undergo compilation, where they are transformed into C++ code. This code is then compiled and linked with proprietary TigerGraph libraries, preparing it for execution.
Step 2: Execution
Once compiled, the query is executed on the TigerGraph cluster using the Graph Processing Engine (GPE). The GPE manages cluster communication and orchestrates the execution of algorithms across the distributed environment.
Upgrades in the next-gen architecture
In our next-generation architecture, we’ve implemented significant upgrades to both the compilation and execution phases, harnessing the power of GPU acceleration and streamlining the processing pipeline:
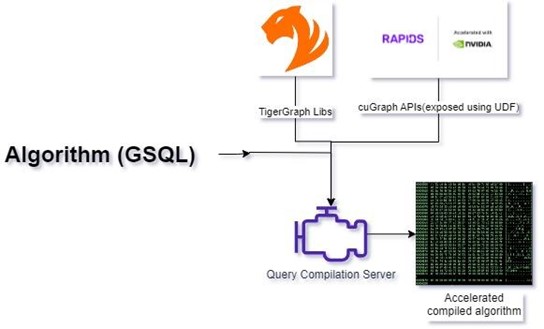
Step 1: Query compilation with enhanced acceleration
We integrated cuGraph CUDA libraries directly into TigerGraph, enabling seamless access to GPU-accelerated graph processing capabilities. On top of the cuGraph libraries, we developed ZettaAccel, a custom C++ library that exposes functions usable as User Defined Functions (UDFs) within GSQL queries. Now, during query compilation, GSQL queries are compiled and linked with TigerGraph, CUDA cuGraph, and ZettaAccel libraries, unlocking accelerated graph processing at its core.
Step 2: Streamlined execution with GPU resource management
Upon execution, our architecture dynamically allocates GPU resources using the RAPIDS ecosystem libraries, ensuring optimal utilization of available hardware. Graph data is efficiently transferred from TigerGraph to GPU memory via ZettaAccel libraries, where it is seamlessly transformed into a graph structure ready for processing. Using ZettaAccel, algorithms execute directly on the GPU, leveraging its parallel processing capabilities for unparalleled performance gains. Resultant data is seamlessly transferred back to CPU and TigerGraph for further analysis and integration.

Advantages of the next-gen architecture
The next-gen architecture represents a quantum leap forward in graph processing efficiency and scalability with:
- Unprecedented performance: By leveraging GPU acceleration and streamlining the processing pipeline, our architecture delivers unparalleled performance gains, enabling rapid execution of complex graph algorithms.
- Simplified setup: The integration of cuGraph and ZettaAccel into TigerGraph simplifies the setup process, eliminating the need for complex dependencies and reducing configuration overhead.
- Scalability and flexibility: With dynamic GPU resource management and streamlined data transfer mechanisms, our architecture scales effortlessly to handle large-scale graph datasets and diverse processing workloads.
Utilizing accelerated GSQL constructs for graph processing
To harness the power of accelerated GSQL constructs for efficient graph processing, users can follow a structured approach divided into three phases: streaming graph construction, algorithm execution, and result retrieval.
Let’s take a look at all three phases using pagerank example:-
1. Streaming graph construction:
In this phase, users define the streaming graph by specifying the relationships and accumulators required for data processing.
SELECT s FROM Start:s -(friend:f)- :t ACCUM
int graph_obj=@@graph_per_server.get(server_id)
udf_stream_edges(graph_obj,getvid(s),getvid(t),store_transposed);
Here, users establish the initial graph structure and accumulate relevant information such as graph objects and custom-defined streaming functions. The udf_stream_edges function aids in efficiently processing edge streams and updating the graph structure.
2. Executing algorithm:
Once the streaming graph is constructed, users proceed to execute their desired algorithms efficiently using GSQL constructs.
V = SELECT s FROM vertex_per_server:s
 ACCUM
udf_prank_execute(@@graph_per_server.get(s.@server_id),@@vertices_per_server.get(s.@server_id));
In this phase, users execute algorithms like PageRank, utilizing accelerated GSQL constructs. The udf_prank_execute function efficiently computes PageRank scores for vertices distributed across servers, optimizing algorithm execution time.
3. Retrieving results:
After executing the algorithm, users retrieve the computed results back from the graph for further analysis or visualization.
V = SELECT s FROM Start:s
ACCUM s.@score=udf_pagerank_score(@@graph_per_server.get(server_id),getvid(s));
Here, users retrieve the PageRank scores calculated during algorithm execution and store them as vertex attributes for subsequent analysis or visualization.
By following these three phases, users can effectively utilize accelerated GSQL constructs to streamline graph processing tasks, optimize algorithm execution, and retrieve valuable insights from their graph data efficiently.
Performance benchmarking and results
Graph algorithm performance comparison
This benchmark is conducted on a 2-node cluster, with each node featuring 4xNVIDIA A100 40GB GPUs, an AMD EPYC 7713 64-Core Processor, and 512GB of RAM.
Benchmark dataset
Graphalytics, developed by the Linked Data Benchmark Council (LDBC), is a comprehensive benchmark suite designed for evaluating the performance of graph database management systems (GDBMSs) and graph processing frameworks. It offers real-world datasets, diverse workloads, and a range of graph algorithms to help researchers and organizations assess system efficiency and scalability. For more information, see LDBC Graphalytics Benchmark.
| Graph | Vertices | Edges | TigerGraph Cluster (Sec) | cuGraph + TigerGraph (python)(Sec) | cuGraph + TigerGraph (Native)(Sec) |
| Graph 22 | 2.39M | 64M | 311.162 | 12.14 (25X) | 6.91 (45X) |
| Graph 23 | 4.6M | 129M | 617.82 | 14.44 (42X) | 9.04 (68X) |
| Graph 24 | 8.87M | 260M | 1205.34 | 24.63 (48X) | 14.69 (82X) |
| Graph 25 | 17.06M | 523M | 2888.74 | 42.5 (67X) | 21.09 (137X) |
| Graph 26 | 32.8M | 1.05B | 4842.4 | 73.84 (65X) | 41.01 (118X) |
Optimizing graph processing: A cost analysis of integrating cuGraph in TigerGraph
In the pursuit of enhancing graph processing capabilities, the integration of cuGraph with TigerGraph has proven to be a game-changer. By leveraging cuGraph’s GPU-accelerated capabilities within the TigerGraph framework, we not only achieve remarkable speed improvements but also significantly reduce overall costs.
Machine information:
- Instance name: m7a.32xlarge
- Total Nodes: 2
- On-Demand Hourly Rate: $7.41888
- vCPU: 128
- Memory: 512 GiB
- Instance name: p4d.24xlarge
- Total Nodes: 1
- On-Demand Hourly Rate: $32.77
- vCPU: 96
- Memory: 1152 GiB
GPU information:
- Specifications: NVIDIA A100 GPU
- Count : 8
- Memory: 320 GB HBM2
| Graph | TigerGraph Cluster (Sec) | cuGraph + TigerGraph (Native)(Sec) | CPU Cost | GPU Cost | Benefit(X) |
| Graph 22 | 311.162 | 6.91 (45X) | $1.28 | $0.06 | 20 |
| Graph 23 | 617.82 | 9.04 (68X) | $2.55 | $0.08 | 31 |
| Graph 24 | 1205.34 | 14.69 (82X) | $4.97 | $0.13 | 37 |
| Graph 25 | 2888.74 | 21.09 (137X) | $11.91 | $0.19 | 62 |
| Graph 26 | 4842.4 | 41.01 (118X) | $19.96 | $0.37 | 53 |
These results demonstrate a remarkable 100x speed improvement in graph processing when integrating cuGraph with TigerGraph. Simultaneously, the cost analysis reveals a substantial 50x reduction in overall costs, showcasing the efficiency and cost-effectiveness of this integration. This optimization ensures not only superior performance but also a more economical solution for graph analytics workloads.
Summary
In this comprehensive exploration of graph analytics, we’ve embarked on a journey to revolutionize the way we process and analyze complex graph data. From the challenges of traditional architectures to the unveiling of our next-gen solution, this article has covered a vast array of topics, showcasing the transformative power of advanced technologies and innovative approaches.
Evolution of graph processing:
We began by dissecting the limitations of traditional graph processing architectures, highlighting dependencies on shared disk infrastructure, Python, and Thrift communication layers. These challenges underscored the need for a fresh approach to graph analytics—one that could unlock new levels of performance, scalability, and efficiency.
Introducing the next-gen architecture:
Enter our next-generation architecture—a game-changing paradigm shift in graph processing. Built entirely in C++, our architecture leverages a stack of cutting-edge technologies, including cuGraph, Raft, NCCL, and ZettaAccel, to accelerate graph analytics to unprecedented heights.
Key advancements and innovations:
With our new architecture, we’ve revolutionized both the compilation and execution phases of graph processing. By integrating cuGraph and ZettaAccel directly into TigerGraph, we’ve streamlined the compilation process, eliminating complex dependencies and unlocking GPU-accelerated graph processing at its core. Our architecture’s dynamic GPU resource management and streamlined data transfer mechanisms ensure optimal performance and scalability for a wide range of graph processing tasks.
Unprecedented performance and scalability:
The results speak for themselves—our next-gen architecture delivers unparalleled performance gains, enabling rapid execution of complex graph algorithms and seamless scalability to handle large-scale datasets. By harnessing the power of GPU acceleration and innovative C++ technologies, we’ve redefined the boundaries of graph analytics, empowering organizations to unlock new insights and drive innovation in diverse domains.
Future directions and opportunities:
As we look to the future, the possibilities are limitless. With ongoing advancements in GPU technology, algorithm optimization, and integration with emerging frameworks, our architecture is poised to continue evolving, pushing the boundaries of what’s possible in graph analytics.
Get started
If you’re eager to harness the power of accelerated graph processing, here’s how you can embark on your journey:
- Check Your Requirements: Ensure you have TigerGraph version 3.9.X and NVIDIA GPUs equipped with RAPIDS support. These prerequisites are essential for unlocking the potential of accelerated graph processing.
- Express Your Interest: Reach out to TigerGraph or Zettabolt to express your interest in exploring accelerated graph processing. Whether you’re a seasoned data scientist or a newcomer to graph analytics, their teams are ready to assist you every step of the way.
- Guidance and Support: Once you’ve expressed your interest, the experts at TigerGraph or Zettabolt will guide you through the initial steps, providing you with all the necessary information to kickstart your accelerated graph processing journey. From setting up the infrastructure to fine-tuning performance, their support ensures a smooth and successful implementation.
