
NVIDIA announced the latest Nsight Compute 2021.3 with new features for measuring and modeling occupancy, source and assembly code correlation, and a hierarchical roofline model to identify bottlenecks caused by accessing cache memory.
Occupancy Calculator
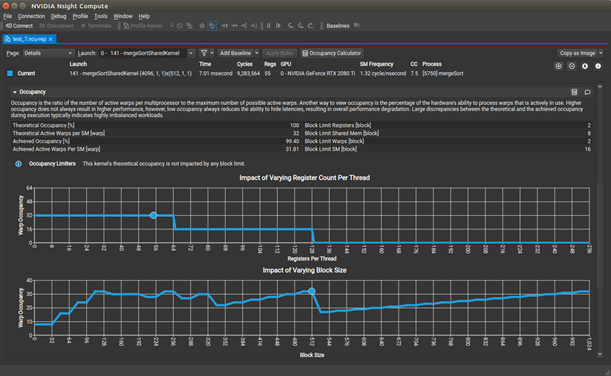
Nsight Compute 2021.3 adds a new Occupancy Calculator activity that helps you understand the hardware resource utilization of their kernels and model how adjustments could impact occupancy.
Occupancy is a ratio of active warps per SM to the theoretical maximum number of active warps. Low occupancy may represent kernels that are too small, unbalanced workloads, or resource contention. All of which can limit the performance of a kernel on a GPU with a specific set of available resources.
Command line source page
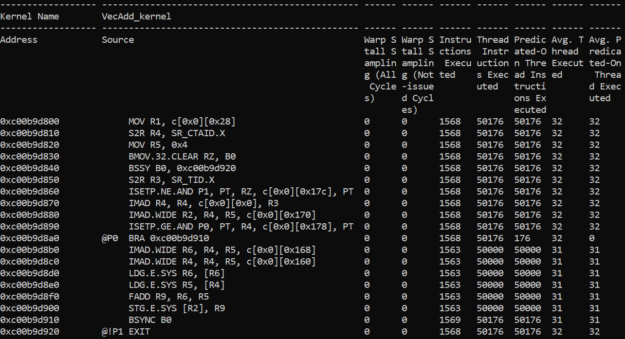
This release adds a highly requested feature that enables accessing the information from the Source page in the GUI directly from the command line. By using the --page source flag, users can see the lines of source, PTX, or assembly and the collected metrics for those lines output on the command line.
This feature gives additional flexibility when it comes to analyzing the collected data as well as scripting and post-processing results for further reporting and analysis.
Hierarchical roofline
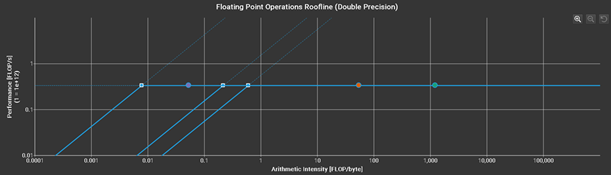
The Roofline chart now has support for a hierarchical roofline, which adds rooflines for the L1 and L2 caches in addition to device memory. You can see how close their kernels are to the bandwidth limits of each memory level to determine whether their kernels have bottlenecks related to accessing memory.
Additional enhancements
Further capabilities include more configurable baseline comparisons, direct access to source-level information from the CLI, and additional SSH functionality.
For more information about debugging and profiling tools, register to join this NVIDIA GTC technical session: Understanding CUDA Application Behavior, Performance, and Optimization Just Got Easier with the Latest Developer Tools.
For more information, see the following resources:
- NVIDIA Nsight Compute product page
- NVIDIA Nsight Compute documentation
- Nsight Compute Developer Tools forum
- Arm DevSummit Session: Simplify HPC Development for CUDA on Arm with the Latest Nsight Developer Tools
- Previous GTC sessions:
To view the latest tutorial information, see Nsight Compute videos and Nsight Compute posts.
