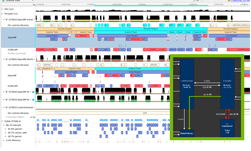
To help unleash the performance advantages of the NVIDIA Ampere Architecture, the CUDA Toolkit 11 and Nsight Systems 2020.3 and Nsight Compute 2020.1 developer tools have been enhanced and scheduled for general availability at the end of May.
The Nsight suite of developer tools provides insightful tracing, debugging, profiling, and other analyses to optimize your high-performance applications across NVIDIA GPUs, and CPUs including the x86, Arm, and Power architectures.
This post details the support additions and enhancements to the following tools:
- Nsight Systems
- Including support for MPI, OpenACC (see the example later in this post), and OpenMP, as well as improvement in the CLI, and complex data mining capabilities
- Nsight Compute
- Visualizations for Roofline Analysis (see example below), A100 memory system, and data compression, as well as theoretical peak (speed of light) metrics
- cuda-gdb
- Improved load times, debug information, and parallel cuda-gdb sessions
- New Compute Sanitizer
- A functional correctness checking tool that helps you identify memory and threading errors in your CUDA code
- IDE integrations
- NVIDIA Nsight Visual Studio Edition and NVIDIA Nsight Eclipse Edition
In addition to the expanding device support, these introductions improve usability and productivity, making it easier for you to find and fix the bugs and bottlenecks that impact their applications.
Learn more about NVIDIA developer tools by checking out our GTC Digital sessions content as we release on-demand sessions online. You can access product information including downloads at the end of May with CUDA 11 at our Nsight overview site, and connect with us directly via our user forums.
Don’t forget to check-out updates to our Nsight Graphics 2020.2 tool update as well.
