Wouldn’t it be amazing if you could create beautiful and immersive scientific visualizations of large and dynamic simulations like Folding@Home’s simulation of COVID-19 spikes? In this post, we share our recipe to show that you can use NVIDIA Omniverse to create powerful cinematic visualizations from scientific data.
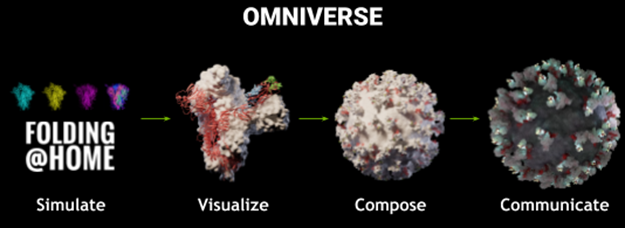
The beginning of any such project starts with trajectory data. To describe where to go from there, we use the approach to visualize Folding@Home’s exascale results from 1.2 ms of molecular dynamics simulations of SARS-CoV-2 spike assembly. The worldwide distributed compute effort used over 700,000 GPUs and had an overall compute time around three months. The results, while beautiful, are also scientifically informative–spike assembly dynamics expose mechanics for viral attachment and cellular infection.
Three-dimensional molecular structures change over time and are easily visualized by VMD, a commonly used software application for exploring large biomolecular systems. It is packed with advanced visualization techniques and analysis methods for complex molecular systems. VMD has a broad range of renderers, including NVIDIA GPU-accelerated ray tracing through NVIDIA OptiX.
Adding Omniverse to the visualization workflow simplifies the setup of complex visualizations. There is the obvious benefit of NVIDIA GPU accelerated rendering, but additional power comes from the seamless use of your data assets across specialized animation applications, like Autodesk Maya or Autodesk 3ds Max. You may even choose to bring your own software or tools or Python scripts into your workflows.
Workflow for simulation data to visualization
Figure 2 shows the overview of the primary components needed. We took a “simpler is better” approach and we don’t cover most of Omniverse’s capabilities and components. However, the essential parts hopefully make your task more approachable.

Primary animation
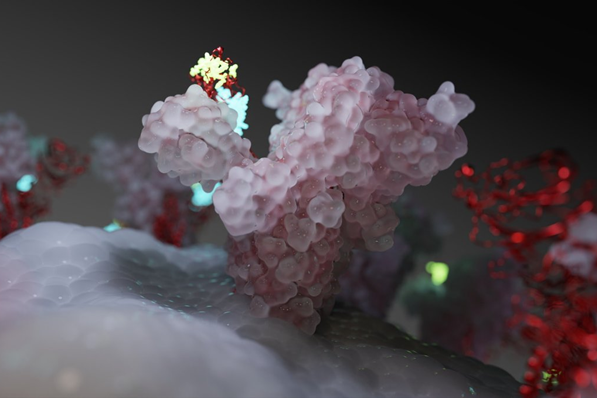
To prepare the simplified and filtered spike protein assembly trajectories for visualization, we used VMD to create objects. The trajectory files from the Folding@Home simulation of the spike trimer do not have a particular visual representation. VMD allowed us to represent two of the three copies of the spike protein as a density surface using quicksurf and the third protein represented as a ribbon. These choices provide effective visual context for docking sites, highlighted in yellow and blue in Figure 3.
The outputs of VMD were OBJ files. This is a portable but large and verbose format. Quite a bit needs to happen to take each frame of the simulation data, over 700 in this case. Omniverse is designed to use USD format, as it is efficient and most portable. Several important steps were taken to create the primary animation. First was conversion to USD and storage with Omniverse Nucleus. The remaining steps all interact with Omniverse Connect, like optimized geometries, joining frames, object positioning, and animation looping.
Supplementary objects, materials, and camera path
Not all the biomolecules were simulated in Folding@Home like the lipid bilayer membrane that serves as the “footing” for the spike complex. To show the science results in context, we mocked the membrane as an object. Sphere instances were distributed with a noise model to emulate lipid packing about a radius matching the scale of the virus. The finalized object created through a custom tool ingests and outputs data through Omniverse Nucleus.
Camera paths, lighting, and materials are common visualization needs. Omniverse Create makes it straightforward to generate these using widely used applications without needing to move the data. For example, we made the camera path using Autodesk Maya directly connected to Omniverse. Similar processes were used for object materials and scene lighting.
Interactive visualization
The majority of the work already completed in previous steps, the finalized visualization is composited and viewed through Omniverse Kit. The beautiful effects of NVIDIA RTX ray tracing rendering is enabled by Omniverse RTX.
Conclusion
There are many variations on the described approach that you may want to try for your own scientific visualizations. We encourage you to experiment. The first step to take is installing Omniverse on your workstation. For more information, see the Omniverse Installation Guide and Installing Omniverse (Video). For more information about becoming an Omniverse user and creator, see the Developer Program.
Learn more about simulation results from Folding@Home and visualization of the virus with the following resources:
