
Mixed precision combines different numerical precisions in a computational method. The Volta and Turing generation of GPUs introduced Tensor Cores, which provide significant throughput speedups over single precision math pipelines. Deep learning networks can be trained with lower precision for high throughput, by halving storage requirements and memory traffic on gradient and activation tensors. The following NVIDIA tools can enable you to analyze your model and maximize Tensor Cores utilization.
Nsight Systems
NVIDIA Nsight Systems provides developers with a system-wide performance analysis tool, offering a complete and unified view of how their applications utilize a computer’s CPUs and GPUs. The tool enables developers to visualize an application’s algorithms in order to identify the largest opportunities for optimizing and tuning algorithms.
Developers can annotate source code with NVTX (NVIDIA Tools Extensions Library), highlighting interesting function calls easily in the timeline viewer of Nsight Systems. After identifying the bottlenecks, individual kernels could be profiled with Nsight Compute.
Nsight Compute
Nsight Compute is the next generation interactive kernel profiler for CUDA applications, available with the Cuda 10.0 Toolkit. It provides detailed performance metrics and API debugging for kernels via a user interface and command line tool.
You can collect low level statistics about each individual kernel executed and compare multiple runs. It can print the results directly on the command line or store them in a report file.
You can use the command line interface to launch a training script directly with the profiler, which lets you find out whether Tensor cores were used. Table 1 shows the key parameters.
| Command Line Option | Description |
| –csv | Specifies comma separated values for output |
| –nvtx | Enables NVTX support (which means that if python code is instrumented with the NVTX annotations, the profiler supports data collection in the ranges specified |
| -o | Specifies the output file which is the kernel protobuf report |
| –metrics | Specifies the metrics to be collected |
The sm__inst_executed_pipe_tensor_op_hmma.sum metric shows HMMA instructions were executed, capturing the NVTX stack with each kernel launch. Non-zero value indicates some usage of the Tensor Cores occurred. (Use the sm__inst_executed_pipe_hmmafp32_sum metric if you are using a version of Nsight Compute older than 2019.1 (build 25827221)).
Examples:
./nv-nsight-cu-cli --csv --nvtx -f -o ./volta.fp16.nsight-cuprof-report  --metrics sm__inst_executed_pipe_tensor_op_hmma.sum app_name

./nv-nsight-cu-cli --csv --nvtx -f -o ./volta.fp32.nsight-cuprof-report --metrics sm__inst_executed_pipe_hmmafp32_sum app_name
Nvprof and NVVP
The Nvprof and NVVP profiling tools have been widely used for profiling by Cuda developers.
You can profile the application in Visual Profiler. The profiler Initially shows the timeline. You then use the menu option “Run->Collect Metrics and Events” to select the “Tensor-Precision Function Unit Utilization” metric under “Metrics->Multiprocessor” as shown in figure 1 below.
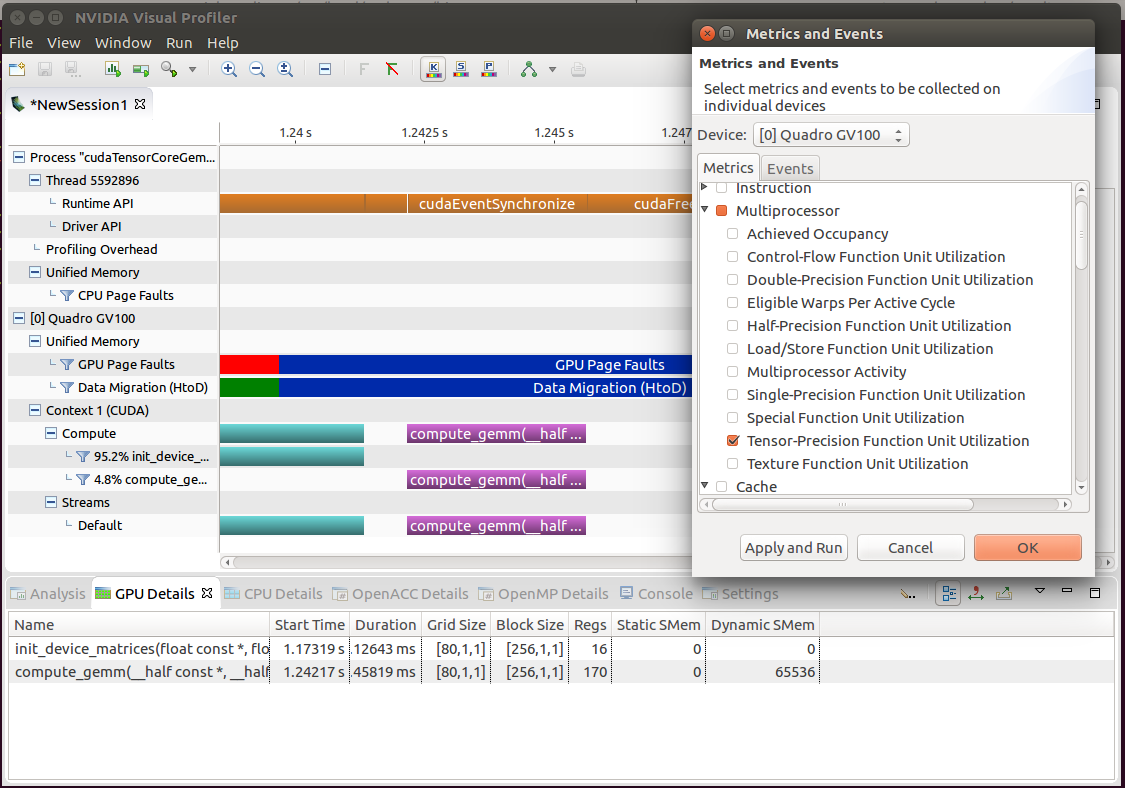
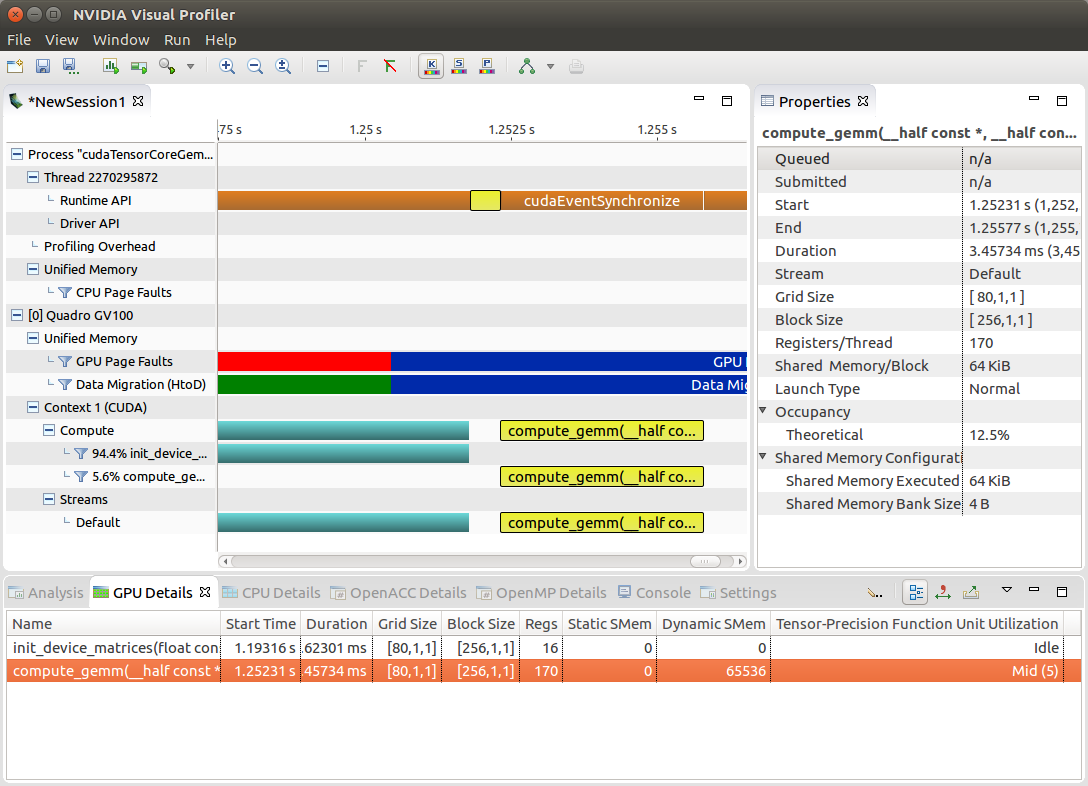
Figure 2 below shows kernels using Tensor cores in Visual Profiler.
In addition, Nvprof supports the tensor_precision_fu_utilization metric which reveals the utilization level of Tensor Cores in each kernel of your model. This metric first appeared in the version 9.0 cuda toolkit.
Tensor_precision_fu_utilization: The utilization level of the multiprocessor function units that execute tensor core instructions on a scale of 0 to 10
If you want to see which kernel is using Tensor Cores then use the following command line option:
./nvprof -m tensor_precision_fu_utilization ./app_name
This returns the utilization level of the multiprocessor function units executing Tensor cores instructions on a scale of 0 to 10. Any kernel showing a non-zero value is using Tensor cores.
Note that profiling of metric and event is only supported up to the Volta architecture through Nvprof. The Turing architecture Nvprof only supports tracing functionality. Use Nsight Compute instead to show profiling metrics on Turing.
How to Obtain Nvprof and Nsight Compute
Nvprof and Nsight Compute are available as part of the CUDA Toolkit.
Runtime components for deploying CUDA-based applications, as well as deep learning, machine learning, and HPC applications, are also available in ready-to-use containers from NGC.