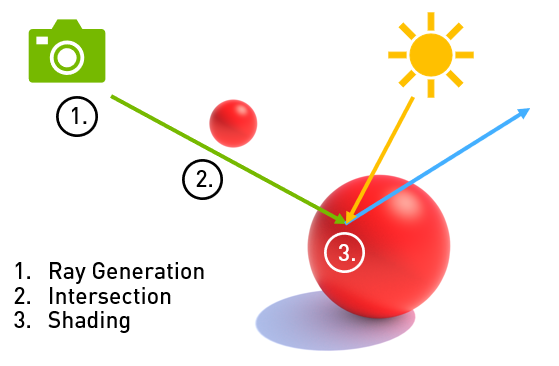
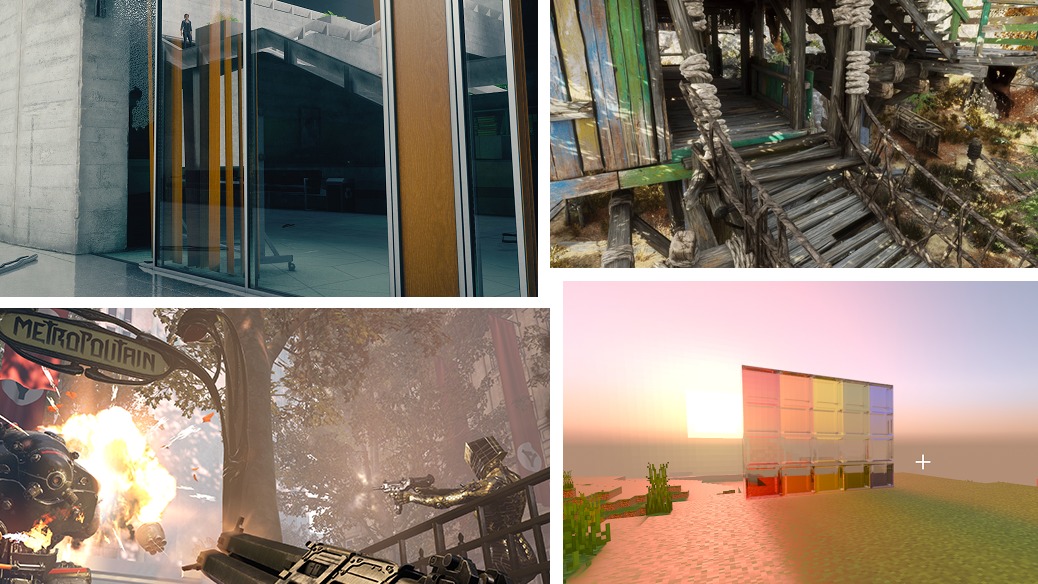
 This post presents best practices for implementing ray tracing in games and other real-time graphics applications. We present these as briefly as possible to help you quickly find key ideas. This is based on a presentation made at the 2019 GDC by NVIDIA engineers.
Main Points
- Optimize your acceleration structure (BLAS/TLAS) build/update to take at most 2ms via pruning and selective updates
- Denoising RT effects is essential. We’ve packaged up best in class denoisers with the NVIDIA RTX Denoiser SDK)
- Overlap the acceleration structure (BLAS/TLAS) build/update and denoising with other regimes (G-Buffer, shadow buffer, physical simulation) using asynchronous compute queues
- Leverage HW acceleration for traversal whenever possible
- Minimum number of rays cast should be billed as “RT On” and should deliver noticeably better image quality than rasterization. Increasing quality levels should increase image quality and perf at a fair rate. See table below:
Performance Best Practices
1.0 Acceleration Structure Management
1.1 General Practices
Move AS management (build/update) to an async compute queue. Using an async compute queue pairs well with graphics workloads and in many cases hides the cost almost completely. Similarly, any AS dependency (such as skinning) can also be moved to async compute and hidden well.
Build the Top-Level Acceleration Structure (TLAS) rather than Update. It’s just easier to manage in most circumstances, and the cost savings to refit likely aren’t worth sacrificing quality of TLAS.
Ensure descriptors for GetRaytracingAccelerationStructurePrebuildInfo and BuildRaytracingAccelerationStructure match. Otherwise the allocated buffers may be too small to hold the AS or scratch memory, potentially generating a subtle bug!
Don’t include the skybox/skysphere in your TLAS. Having sky geometry in your scene only serves to increase raytracing times. Implement your sky shading in the Miss Shader instead.
Implement a single barrier between BLAS and TLAS build. Generally speaking, no more should be required for correctness. Overlap between BLAS builds can occur naturally on the hardware but adding unnecessary barriers can serialize execution of that work.
1.2 Bottom-Level Acceleration Structures (BLAS)
Use triangles over AABBs . RTX GPUs excel in accelerating traversal of AS created from triangle geometry.
Mark geometry as OPAQUE whenever possible. If the geometry doesn’t require any-hit shader code to execute (e.g. for alpha testing), then always make sure it’s marked as OPAQUE in order to use the HW as effectively as possible. It doesn’t matter whether the OPAQUE flag comes from the geometry descriptor (D3D12_RAYTRACING_GEOMETRY_FLAG_OPAQUE / VK_GEOMETRY_OPAQUE_BIT), the instance descriptor (D3D12_RAYTRACING_INSTANCE_FLAG_FORCE_OPAQUE / VK_GEOMETRY_INSTANCE_FORCE_OPAQUE_BIT), or through a ray flag (RAY_FLAG_FORCE_OPAQUE / gl_RayFlagsOpaqueNV).
Batching/Merging of build/update calls and geometries is important. Ultimately, the GPU will be under-occupied in situations where AS manipulation is performed on small batches of primitives. Take advantage of the fact that a build can accept more than one geometry descriptor and transform the geometry while building. This generally leads to the most efficient data structures, especially when objects’ AABBs overlap each other. Grouping things into BLAS/instances should follow spatial locality. Do not “throw everything with the same material into the same BLAS no matter where it ends up in space”.
Know when to update, versus, (re)build. Continually updating a BLAS degrades its effectiveness as a spatial data structure, making traversal/intersection queries much slower relative to one freshly built. As a general rule, only dynamic objects should be considered for update. If parts of the mesh change position wildly relative to their local neighborhood, then traversal quality will decrease quickly on update. If things are just “bending but not breaking”, then update will work quite well. Example: tree waving in wind: update=good; mesh exploding: update=bad. Deciding to update or rebuild a skinned character: it depends. Say the original build was done in t-pose, then every update will assume that the feet are close together. During a walking/running animation, this could impact trace efficiency. One solution here is to build acceleration structures for a few key poses upfront, then use the closest match as a source for refit. An experiment guided flow/process is recommended.
Use compaction with all static geometry. Compaction is fast and can often reclaim significant amounts of memory. There is no performance downside when tracing rays against compacted acceleration structures. See the item on build flags below for more detail.
Use the right build flags.
Start by choosing a combination from the table below…
|
PREFER_FAST_TRACE |
PREFER_FAST_BUILD |
ALLOW_UPDATE |
Properties |
Example |
|
|
1 |
no |
yes |
no |
Fastest possible build. Slower trace than #3 and #4. |
Fully dynamic geometry like particles, destruction, changing prim counts or moving wildly (explosions etc), where per-frame rebuild is required. |
|
2 |
no |
yes |
yes |
Slightly slower build than #1, but allows very fast update. |
Lower LOD dynamic objects, unlikely to be hit by too many rays but still need to be refitted per frame to be correct. |
|
3 |
yes |
no |
no |
Fastest possible trace. Slower build than #1 and #2. |
Default choice for static level geometry. |
|
4 |
yes |
no |
yes |
Fastest trace against updateable AS. Updates slightly slower than #2. Trace a bit slower than #3. |
Hero character, high-LOD dynamic objects that are expected to be hit by a significant number of rays. |
Then consider adding these flags:
ALLOW_COMPACTION. It’s generally a good idea to do this on all static geometry to reclaim (potentially significant) amounts of memory.
For updateable geometry, it makes sense to compact those BLASs that have a long lifetime, so the extra step is worth it (compaction and update are not mutually exclusive!).
For fully dynamic geometry that’s rebuilt every frame (as opposed to updated), there’s generally no benefit from using compaction.
One potential reason to NOT use compaction is to exploit the guarantee of BLAS storage requirements increasing monotonically with primitive count — this does not hold true in the context of compaction.
MINIMIZE_MEMORY (DXR) / LOW_MEMORY_BIT (VK). Use only when the application is under so much memory pressure that a ray tracing path isn’t feasible without optimizing for memory consumption as much as possible. This flag usually sacrifices build and trace performance. This isn’t the case in all situations, but beware that future driver versions might behave differently, so don’t rely on experimental data “confirming” that the flag doesn’t cost perf.
2.0 – Ray-Tracing
2.1 – Pipeline Management
Avoid State Object creation on the critical path. Collections and pipelines can take tens to hundreds of milliseconds to compile. An application should therefore either create all PSOs upfront (e.g. at level load), or asynchronously create state objects on background threads and hot-swap them when ready.
Consider using more than one ray tracing pipeline (State Object). This especially applies when you trace several types of rays, such as shadows and reflections where one type (shadows) has a few simple shaders, small payloads, and/or low register pressure, while the other type (reflections) involves many complex shaders and/or larger payloads. Separating these cases into different pipelines helps the driver schedule shader execution more efficiently and run workloads at higher occupancy.
Set your payload and attribute sizes to the minimum possible. The values configured for MaxPayloadSizeInBytes and MaxAttributeSizeInBytes have a direct effect on register pressure, so don’t set them higher than what your application/pipeline absolutely needs.
Set your max trace recursion depth to the minimum possible. Trace recursion depth affects how much stack memory is allocated for a DispatchRays launch. This can have a large effect on memory consumption and overall performance.
2.2 – Shaders
2.2.1 – General
Keep the ray payload small. Payload size translates to register count, so directly effects occupancy. It’s often worth a bit of math to pack the payload similar to how you’d pack a gbuffer. Large payloads will spill to memory.
Keep attribute count low. Similar to payload data, attributes for custom intersection shaders translate to register count and should therefore be kept to a minimum. Fixed-function triangle intersection uses two attributes, which serves as a good guideline.
Use RAY_FLAG_ACCEPT_FIRST_HIT_AND_END_SEARCH / gl_RayFlagsTerminateOnFirstHitNV wherever possible. This usually applies to shadow and ambient occlusion rays, for example. Note that using this flag is more efficient than using an any-hit shader that calls AcceptHitAndEndSearch() / terminateRayNV() explicitly.
Avoid live state across trace calls. Generally, variables computed before a TraceRay call and used after TraceRay will have to be spilled to the stack. The compiler can avoid this in certain cases, such as using rematerialization, but more often than not the spill is necessary. So the more a shader can avoid them in the first place, the better. In some cases, when shading complexity is very low and there are no recursive TraceRay calls, it makes sense to put some of the live state into the payload in order to avoid the spill. However, this conflicts with the desire to keep the payload small, so use this trick very judiciously.
Avoid too many trace calls in a shader. Many TraceRay calls in a shader may result in suboptimal performance and shader compile times. Try structuring your code so multiple trace calls collapse into one.
Use loop unrolling judiciously. This is especially true if said loop contains a trace call (a corollary to the previous point). Complex shaders may suffer from unrolled loops more than they benefit. Experiment with the [loop] attribute in HLSL or explicit unrolling in GLSL.
Try to execute TraceRay calls unconditionally. Keeping TraceRay calls out of ‘if’ statements can help the compiler streamline the generated code and improve performance. Instead of using a conditional, experiment with setting a ray’s tmin and tmax values to 0 in order to trigger a miss, and (if required for correct behavior) use a no-op miss shader to avoid unintended side effects.
Use RAY_FLAG_CULL_BACK_FACING_TRIANGLES / gl_RayFlagsCullBackFacingTrianglesNV judiciously. Unlike rasterization, backface culling in ray tracing is usually not a performance optimization and can result in more work being done rather than less.
2.2.2 – Ray-Generation Shaders
Ensure each ray-gen thread produces a ray. Dispatching/allocating threads in ray-generation shaders that ultimately don’t produce any rays can harm scheduling. Manual compaction may be necessary here.
2.2.3 – Any Hit Shaders
Keep any-hit shaders minimalistic. Any-hit shaders execute many times per TraceRay (compared to closest-hit or miss shaders, for example, which execute once), making them expensive. In addition, any-hit executes at the point in the call graph where register pressure is highest. So keep them as trivial as you possibly can for best performance.
2.2.4 – Shading Execution Divergence
Start with a straightforward shading implementation. Chances are, when implementing a technique that requires lots of material shading (e.g. reflections or GI), performance may be limited by shading divergence. There are many reasons for this, commonly, but not limited to: instruction cache thrashing and/or divergent memory accesses. Employ the following strategies to combat these problems:
Optimize for instruction divergence using simplified shaders:
- Use lower quality, or simplified shaders (relative to rasterization) for ray-tracing.
- In some extreme cases (for example: diffuse GI or rough specular) it can be visually acceptable to fall all the way back to vertex level shading (which also has the added benefit of reducing noise).
Optimize for divergent memory access by:
- Reduce resolution of texture accesses – or bias mip-map levels
- Defer lighting calculations in ray-tracing shaders, until a later point in the frame
Manual scheduling (sorting/binning) of shades may be necessary in extreme circumstances. When the above optimization strategy isn’t enough, shading can be scheduled manually by the application. However this prevents the driver/HW-based scheduling from being effective. Improvements to our scheduling are constantly being made by NVIDIA.
2.3 – Resources
Use the global root signature (DXR) or global resource bindings (VK) for scene-global resources. This avoids replication in the local per-geometry root tables and should result in better caching behavior.
Avoid resource temporaries. This often results in unintuitive code duplication. For example, holding a texture in a temporary and assigning it based on some condition will result in the duplication of all sample operations for each possible texture assignment. Possible workaround: Use a resource array and index into it dynamically.
Accessing 64 or 128 bits of aligned local root table data together enables vectorized loads.
Prefer StructuredBuffer over ByteAddressBuffer for aligned raw data.
3.0 – Denoisers
Use the RTX Denoiser SDK for high quality, fast denoising of ray traced effects. You can find more details at the GameWorks Ray Tracing page.
4.0 – Memory Management
For DXR, Consider budget reported by QueryVideoMemory API as a soft hint. The actual segment size is ~20% larger.
Isolate Command Allocators to Command Lists of different types. Don’t mix and match non-DXR CAs with DXR CAs if you can avoid it.
Command Allocator Reset will not free up associated memory. Those allocations can be freed with destroy/create, but this must be done off the critical path to avoid long stalls
Watch the pipeline’s stack size. Stack size increases with the amount of live state kept across TraceRay calls and with control flow complexity around TraceRay calls. The maximum trace depth is essentially a direct multiplier on the stack size – keep it as low as possible.
Manually manage the stack if applicable. Use the API’s query functions to determine the stack size required per shader, and apply app-side knowledge about the call graph to reduce memory consumption and increase performance. A good example is expensive reflection shaders at trace depth 1 shooting shadow rays (trace depth 2) which are known by the app to only hit trivial hit shaders with low stack requirements. The driver can’t know this call graph in advance, so the default conservative stack size computation will over-allocate memory.
Reuse transient resources. For example, reuse scratch memory resources for BVH builds for other (potentially non-raytracing) purposes. On DXR, make use of placed resources and resource heaps tier 2.
5.0 – Profiling and Debugging
Be aware of the following tools that include support for DirectX Raytracing and NVIDIA’s VKRay. They are evolving quickly, so make sure you use the latest versions.
- NVIDIA Nsight Graphics. Provides excellent debugging and profiling tools for ray tracing developers (Shader Table & Resource Inspector, Acceleration Structure Viewer, Range profiling, Warp Occupancy & GPU Metrics, Crash Debugging via Nsight Aftermath, C++ Frame capture).
- NVIDIA Nsight Systems. Provides system wide profiling capabilities and stutter analysis functionality.
- Microsoft PIX
FAQ
Q. What’s the relationship between number of primitives and cost (time) of acceleration structure build/updates?
A. It’s mostly a linear relationship. Well, it starts getting linear beyond a certain primitive count, before that it’s bound by constant overhead. The exact numbers here are in flux and wouldn’t be reliable.
Q. Assuming maximum occupancy, what’s the GPU throughput SOL for acceleration structure build/updates?
A. An order-of-magnitude guideline is O(100 million) primitives/sec for full builds and O(1 billion) primitive/sec for update.
Q. What’s the relationship between number of unique shaders and compilation cost (time) for RT PSOs?
A. It is roughly linear.
Q. What’s the typical cost of RT PSO compilation in games today?
A. Anywhere from, 20ms → 300ms, per pipeline.
Q. Is there guidance for how much alpha/transparency should be used? What’s the cost of anyhit vs closest hit?
A. Any-hit is expensive and should be used minimally. Preferably mark geometry (or instances) as OPAQUE, which will allow ray traversal to happen in fixed-function hardware. When AH is needed (e.g. to evaluate transparency etc), keep it as simple as possible. Don’t evaluate huge shading networks just to execute what amounts to an alpha tex lookup and an if-statement.
Q. How should the developer manage shading divergence?
A. Start by shading in closest-hit shaders, in a straightforward implementation. Then analyze perf and decide how much of a problem divergence is and how it can be addressed. The solution may or may not include “manual scheduling”.
Q. How can the developer query the stack memory allocation?
A. The API has functionality to query per-thread stack requirements on pipelines/shaders. This is useful for tracking and analysis purposes, and an app should always strive to use as little shader stack as possible (one recommendation is to dump stack size histograms and flag outliers during development). Stack requirements are most directly influenced by live state across trace calls, which should be minimized (see Best Practices)..
Q. How much extra VRAM does a typical ray-tracing implementation consume?
A. Today, games implementing ray-tracing are typically using around 1 to 2 GB extra memory. The main contributing factors are acceleration structure resources, ray tracing specific screen-sized buffers (extended g-buffer data), and driver-internal allocations (mainly the shader stack).
Acknowledgements
The following people made significant contributions to this post: Patrick Neill, Pawel Kozlowski, Marc Blackstein, Nuno Subtil, Martin Stich, Ignacio Llamas, Zhen Yang, Eric Werness, Evan Hart, and Seth Schneider.
