You’ve built your deep learning inference models and deployed them to NVIDIA Triton Inference Server to maximize model performance. How can you speed up the running of your models further? Enter NVIDIA Model Analyzer, a tool for gathering the compute requirements of your models.
Without this information, there is a knowledge gap in understanding how many models to run on a GPU. By gathering the hot and cold storage requirements, you can use them to inform the scheduling of models to gain several benefits:
- Maximized model throughput—Ensure that the models placed on each GPU do not sum to above a certain threshold of available memory and GPU utilization, such as 100%. This maximizes throughput for your hardware.
- Optimized hardware usage—Examine GPU memory requirements to run more models on less hardware. Rather than optimizing for throughput, you can use this data to determine the maximum number of models that can be loaded per GPU, reducing the hardware needed, or weigh the trade-off with throughput.
- Increased reliability—Eliminate out-of-memory errors by knowing that the models you load on a GPU will not exceed its capabilities.
In addition, there are two critical non-scheduling benefits:
- Efficient models—Compare and contrast different models, using compute requirements as an additional datapoint into how well a model performs. This can help produce more lightweight models and reduce the amount of memory required for your inference needs.
- Better hardware sizing—Determine the exact amount of hardware needed to run your models, using the memory requirements.
In short, understanding the compute requirements of inference models provides a host of benefits from model creation and hardware sizing to reliable, efficient running of models. Here’s a look at Model Analyzer to see how it can contribute to a maximum-performance inference solution.
Getting the Model Analyzer Docker container
You must install some software such as Docker before using the inference server container. For more information, see the Installing Docker and NVIDIA Docker section in NVIDIA Docker: GPU Server Application Deployment Made Easy.
Model Analyzer runs as a Helm chart, Docker container, or standalone command-line interface. For this tutorial, you build the Docker container from the source, the triton-inference-server/model_analyzer GitHub repo.
git clone https://github.com/triton-inference-server/model_analyzer.git
cd model_analyzer
docker build -t memory-analyzer
To run the container for your models, make sure that ports 8000, 8001, and 8002 are available. Then, run the following command, replacing the capitalized arguments:
docker run -v /var/run/docker.sock:/var/run/docker.sock \
-v /ABSOLUTE/PATH/TO/MODELS:ABSOLUTE/PATH/TO/MODELS \
-v /ABSOLUTE/PATH/TO/EXPORT/DIRECTORY:/results --net=host \
memory-analyzer:ANALYZER-VERSION \
--batch BATCH-SIZES \
--concurrency CONCURRENCY-VALUES \
--model-names MODEL-NAMES \
--triton-version TRITON-VERSION \
--model-folder /ABSOLUTE/PATH/TO/MODELS \
--export --export-path /results/
Here’s an example command for reference:
docker run -v /var/run/docker.sock:/var/run/docker.sock \
-v /home/user/models: /home/user/models \
-v /home/user/results:/results --net=host \
memory-analyzer:latest \
--batch 1,2,4 \
--concurrency 1,2,4 \
--model-names chest_xray,covid19_xray\
--triton-version 20.02-py3 \
--model-folder /home/user/models \
--export --export-path /results/
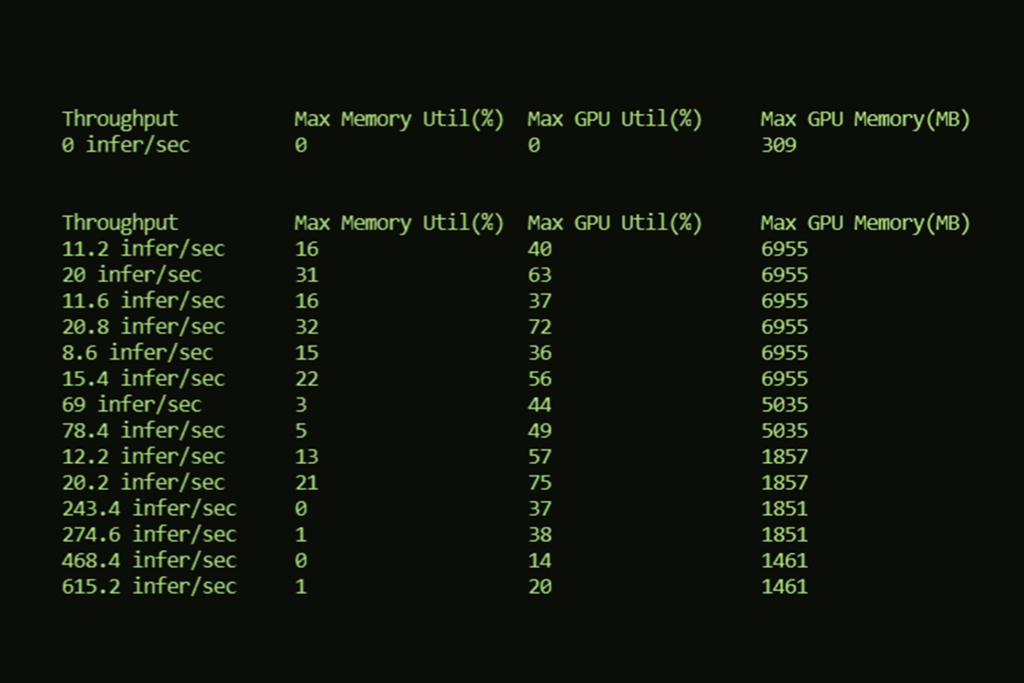
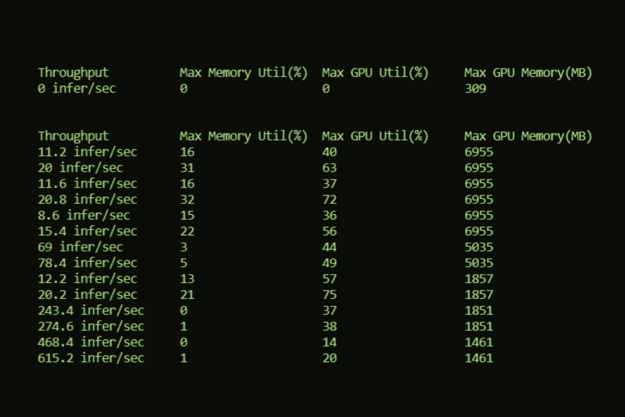
When the container completes, the metrics are exported to your chosen directory for every model, batch size, and concurrency value. The information is gathered by collecting metrics on your system as it runs, so it is ideal to run it on an isolated GPU or system only running Model Analyzer.
Using the compute requirements for optimization
Here’s how you can use these metrics to optimize your system performance. We discuss two case studies using medical inference models:
- The first case study explores minimizing hardware for a system that runs intermittently, such as a low-budget medical provider who needs to run many models on minimal hardware.
- The second case study explores maximizing throughput for these same models using the least hardware necessary to do so, such as a large emergency room running many models on a consistent basis.
Both case studies walk through these steps manually, so we end with a discussion on the next steps for incorporating model metadata into automated scheduling. For both studies, to simplify analysis, we use the data summarized, using a model batch size of 2 and concurrency of 4 for every model.
| Max Memory Utilization (%) | Max GPU Utilization (%) | Max GPU Memory (MB) |
| 0 | 9 | 309 |
| Model | Batch | Concurrency | Throughput | Max Memory Utilization (%) | Max GPU Utilization (%) | Max GPU Memory (MB) |
| classification_breast | 2 | 4 | 1381.6 infer/sec | 1 | 23 | 1461 |
| classification_chest | 2 | 4 | 172.4 infer/sec | 11 | 56 | 5035 |
| classification_malaria | 2 | 4 | 586 infer/sec | 2 | 43 | 1851 |
| segmentation_ct_colon_tumor | 2 | 4 | 33.6 infer/sec | 60 | 60 | 6955 |
| segmentation_ct_ pancreas | 2 | 4 | 29.6 infer/sec | 51 | 79 | 6955 |
| segmentation_ct_ spleen | 2 | 4 | 32 infer/sec | 54 | 54 | 6955 |
| segmentation_liver | 2 | 4 | 28 infer/sec | 53 | 76 | 11051 |
| segmentation_mri_ brain_tumor | 2 | 4 | 4 infer/sec | 48 | 48 | 8579 |
| segmentation_mri_ hippocampus | 2 | 4 | 30.8 infer/sec | 52 | 52 | 6955 |
Typically, there are several potential approaches:
- Place one model per GPU. That translates to nine GPUs for these nine models. If these were to be run on DGXs, for example, this approach would require two DGXs that would not fully be utilized.
- Place all the models on one GPU. This would only require one GPU but would result in an “Out Of Memory” error.
- Place an arbitrary number of models on each GPU. This runs into the problems of the previous approaches. If you put even two models per GPU, you only require five GPUs. However, memory errors are still a risk, for example, if you put the liver segmentation and brain tumor segmentation models on one GPU. At the same time, other GPUs are not fully or optimally utilized, such as when you put breast and chest x-ray classifications on one GPU.
What is the alternative?
Case study: Minimizing hardware for intermittent systems
Imagine that you have a system that you know will only be up intermittently, so you want to fit as many models as possible on the least amount of hardware. In this case, GPU memory is the bottleneck. You can subtract the 309 MB of memory for Triton Server to get the GPU memory of the model alone, then see how many models can fit on one server on a GPU.
Table 3 shows that the models can be matched to only use four 16-GB GPUs with the following configuration, which coordinates the fewest GPUs possible for these models that require 53 GB of memory.
| GPU # | Models | Total GPU Memory (MB) With Server |
| 1 | classification_chest, segmentation_ct_colon_tumor | 11681 |
| 2 | classification_breast, segmentation_liver | 12203 |
| 3 | classification_malaria, segmentation_mri_hippocampus, segmentation_ct_spleen | 15143 |
| 4 | segmentation_ct_pancreas , segmentation_mri_brain_tumor | 15225 |
With this configuration, you have the fewest number of GPUs while guaranteeing no memory errors. This is a good setup for running models intermittently, when throughput does not need to be maximal.
Case study: Maximizing performance for consistent, critical systems
For this setup, maximal throughput is the priority, so you must make sure that throughput does not drop due to a concurrent load on all your modes. Look at all the metrics to make sure that memory utilization, GPU utilization, and total GPU memory do not exceed compute resources for your machine.
As total GPU utilization adds up to 491% and would therefore require a minimum of five GPUs, compared to total memory utilization (332%, or four GPUs) or total GPU memory (52 GB, or four GPUs), GPU utilization is the bottleneck and a great place to start.
Table 4 assumes a GPU utilization threshold of 100% and shows an example configuration with only six 16-GB GPUs.
| GPU # | Models | Memory Utilization (%) | GPU Utilization (%) | Total GPU Memory (MB) With Server |
| 1 | segmentation_ct_colon_tumor | 60 | 60 | 6955 |
| 2 | segmentation_liver | 54 | 76 | 11051 |
| 3 | classification_chest, classification_breast | 12 | 79 | 2939 |
| 4 | segmentation_ct_pancreas | 51 | 79 | 6955 |
| 5 | classification_malaria, segmentation_ct_spleen | 56 | 97 | 8497 |
| 6 | segmentation_mri_hippocampus, segmentation_mri_brain_tumor | 100 | 100 | 15225 |
This is with the same batch size and concurrency value for every model. With tweaking to maximize throughput using different batch sizes and concurrency values, there would be higher variation in memory and GPU utilization, allowing even greater savings. Moreover, if your systems can sacrifice some throughput, you can go just over 100% of memory or GPU utilization to use less hardware.
Further use case: Automated scheduling
While the two case studies show a manual effort for optimizing the running of systems, the most likely use case is incorporating this data into scheduling automatically. Scheduling rules would be placed on top of compute requirements, such as never using more than 80% of the GPU or 80% of the GPU memory when models are running. Such rules are yours to mold, as are the uses of the model compute metadata gathered.
With the compute requirements at your disposal, you can determine what matters most to you and get the most performance out of your hardware.
Conclusion
With the Triton Server tool, Model Analyzer, you can characterize your models easily and efficiently, allowing you to maximize the performance of your hardware. Whether you use the command-line interface, Docker container, or Helm chart, Model Analyzer gathers the compute requirements of your models, allowing you to maximize performance and minimize the hardware required to run your models.
As the case studies of reducing nine GPUs to four or six GPUs showed, incorporating this data into your scheduling is powerful. Further exploration into the data provides insight into how batch size and concurrency also affect your models, enabling you to use Triton Server to run your models with maximal performance.
Model Analyzer is open source and available on GitHub.
