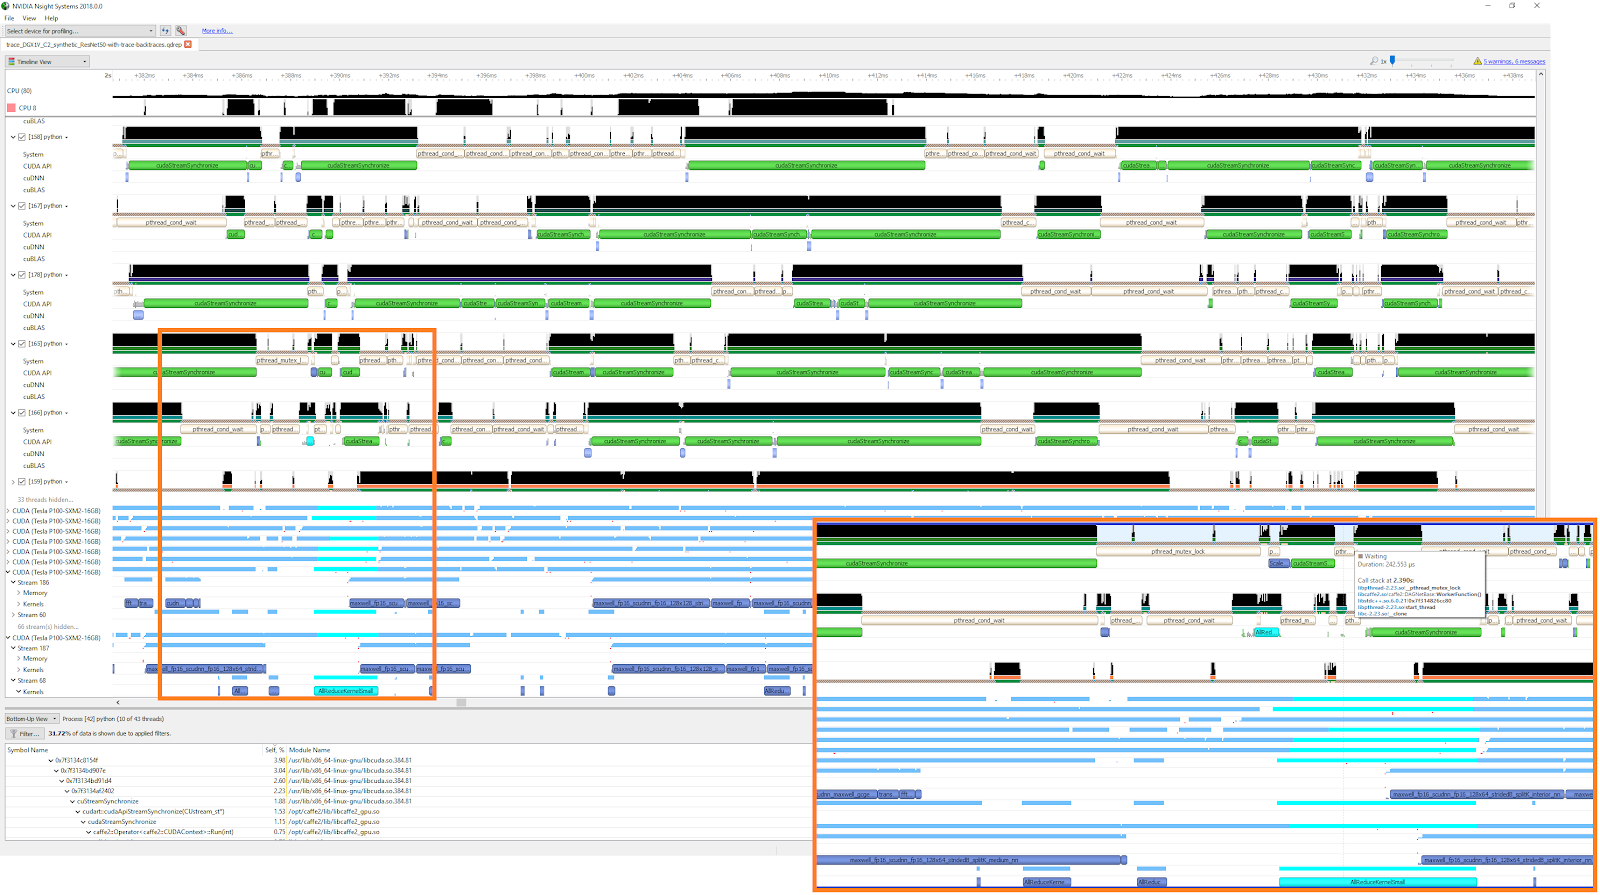
The last time you used the timeline feature in the NVIDIA Visual Profiler, Nsight VSE or the new Nsight Systems to analyze a complex application, you might have wished to see a bit more than just CUDA API calls and GPU kernels.
In this post I will show you how you can use the NVIDIA Tools Extension (NVTX) to annotate the time line with useful information. I will demonstrate how to add time ranges by calling the NVTX API from your application or library. This can be a tedious task for complex applications with deeply nested call-graphs, so I will also explain how to use compiler instrumentation to automate this task.
Update: Although quite some time has passed since the original version of this post has been published, the core of its content is still valid. Two important changes happened:
- NVIDIA Visual Profiler is deprecated and replaced by Nsight Systems
- The NVTX3 header only library was introduced
The first changes how profiles are captured and visualized the example in the Parallel Forall GitHub repository has been updated to use Nsight Systems and NVTX3. The second has two small, but important implications on the content of this blog post:
- One need to include “
nvtx3/nvToolsExt.h” instead of “nvToolsExt.h” - NVTX3 is a header only library so it is no longer necessary to link nvToolsExt. Instead, it is required to link the dynamic linking library dl.
To minimize the changes to this blog post while keeping the content valid the following changes have been made:
- Link to the NVTX documentation has been updated
- Includes paths in code samples have been updated from “
nvToolsExt.h” to “nvtx3/nvToolsExt.h” - Instruction to link with
nvToolsExthas been replaced by the need to link with-dl
What is the NVIDIA Tools Extension (NVTX)?
The NVIDIA Tools Extension (NVTX) is an application interface to the NVIDIA Profiling tools, including the NVIDIA Visual Profiler, NSight Eclipse Editions, NSight Visual Studio Edition, and the new Nsight Systems. NVTX allows you to annotate the profiler time line with events and ranges and to customize their appearance and assign names to resources such as CPU threads and devices.
Let’s use the following source code as the basis for our example. (This code is incomplete, but complete examples are available in the Parallel Forall Github repository.)
__global__ void init_data_kernel( int n, double* x) {
    //do work
}

__global__ void daxpy_kernel(int n, double a, double * x, double * y){
    //do work
}

__global__ void check_results_kernel( int n, double correctvalue, double * x ) {
    //do work
}

void init_host_data( int n, double * x ) {
    //initialize x on host
    ...
}

void init_data(int n, double* x, double* x_d, double* y_d) {
    //create streams, ...
    ...
    cudaMemcpyAsync( x_d, x, n*sizeof(double), cudaMemcpyDefault, copy_stream );
    init_data_kernel<<<numblocks, numthreads,0,compute_stream="">>>(n, y_d);
    //sync streams, clean up, ...
    ...
}

void daxpy(int n, double a, double* x_d, double* y_d) {
    daxpy_kernel<<<numblocks, numthreads="">>>(n,a,x_d,y_d);
    cudaDeviceSynchronize();
}

void check_results( int n, double correctvalue, double* x_d ){
    check_results_kernel<<<numblocks, numthreads="">>>(n,correctvalue,x_d);
}

void run_test(int n) {
    //set device, allocate data, ...
    ...
    init_host_data(n, x);
    init_data(n,x,x_d,y_d);
    daxpy(n,1.0,x_d,y_d);
    check_results(n, n, y_d);
    //clean up
    ...
}

int main() {
    int n = 1<<22;
    run_test(n);
    return 0;
}
When we run this application in the NVIDIA Visual Profiler we get a timeline like the following image.
This timeline shows CUDA memory copies, Kernels and CUDA API calls. To also see (for example) the duration of the host function init_host_data in this time line we can use an NVTX range. In this post I will explain one way to use ranges. A description of all NVTX features is available in the NVTX documentation.
How to use NVTX
Use NVTX like any other C library: include the header "nvtx3/nvToolsExt.h", call the API functions from your source and link the dynamic linking library dl on the compiler command line with -ldl.
To see the duration of init_host_data you can use nvtxRangePushA and nvtxRangePop:
#include "nvtx3/nvToolsExt.h"
...
void init_host_data( int n, double * x ) {
    nvtxRangePushA("init_host_data");
    //initialize x on host
    ...
    nvtxRangePop();
}
...
All ranges created with nvtxRangePushA will be colored green. In an application which defines many ranges this default color can quickly become confusing, so NVTX offers the nvtxRangePushEx function, which allows you to customize the color and appearance of a range in the time line. For convenience in my own applications, I use the following macros to insert calls to nvtxRangePushEx and nvtxRangePop.
#ifdef USE_NVTX
#include "nvtx3/nvToolsExt.h"

const uint32_t colors[] = { 0xff00ff00, 0xff0000ff, 0xffffff00, 0xffff00ff, 0xff00ffff, 0xffff0000, 0xffffffff };
const int num_colors = sizeof(colors)/sizeof(uint32_t);

#define PUSH_RANGE(name,cid) { \
    int color_id = cid; \
    color_id = color_id%num_colors;\
    nvtxEventAttributes_t eventAttrib = {0}; \
    eventAttrib.version = NVTX_VERSION; \
    eventAttrib.size = NVTX_EVENT_ATTRIB_STRUCT_SIZE; \
    eventAttrib.colorType = NVTX_COLOR_ARGB; \
    eventAttrib.color = colors[color_id]; \
    eventAttrib.messageType = NVTX_MESSAGE_TYPE_ASCII; \
    eventAttrib.message.ascii = name; \
    nvtxRangePushEx(&eventAttrib); \
}
#define POP_RANGE nvtxRangePop();
#else
#define PUSH_RANGE(name,cid)
#define POP_RANGE
#endif
Update: In the original version of this code snippet, the alpha channels have been set to 00. This caused all NVTX ranges to be rendered grey in the new Nsight Systems.
To eliminate profiling overhead during production runs and remove the dependency on NVTX for release builds, the macros PUSH_RANGE and POP_RANGE only have an effect if USE_NVTX is defined. The macros can be used as in the following excerpt.
...
void init_host_data( int n, double * x ) {
    PUSH_RANGE("init_host_data",1)
    //initialize x on host
    ...
    POP_RANGE
}
...
Using the macros for all host functions generates a timeline like the following image.
In a C++ application the easy-to-forget call to nvtxRangePop can be automatically inserted by the destructor of a “tracer” class following the RAII idiom, as in the following code.
#ifdef USE_NVTX
class Tracer {
public:
    Tracer(const char* name) {
        nvtxRangePushA(name);
    }
    ~Tracer() {
        nvtxRangePop();
    }
};
#define RANGE(name) Tracer uniq_name_using_macros(name);
#else
#define RANGE(name)
#endif
This can be used as in the following excerpt in which nvtxRangePop is called automatically by the destructor of the Tracer object when it goes out of scope at the end of init_host_data.
...
void init_host_data( int n, double * x ) {
    RANGE("init_host_data")
    //initialize x on host
    ...
}
...
Using compiler instrumentation with NVTX
Instrumenting all functions in a large-scale application using the manual approach described above is not feasible. Fortunately most compilers offer a way to automatically instrument the functions in your application or library. When compiler instrumentation is enabled, the compiler generates calls to user-defined functions at the beginning and end of each function. I’ll demonstrate How this works with GCC and NVTX. You can find more details about GCC function instrumentation in this post.
To use compiler instrumentation with GCC you need to do two things:
- Compile your objects with -finstrument-functions
- Provide definitions of the functions void __cyg_profile_func_enter(void *this_fn, void *call_site) and void __cyg_profile_func_exit(void *this_fn, void *call_site) at link time; these functions are called at each function’s entrance and exit, respectively.
GCC also provides the attribute __attribute__((no_instrument_function)), which you can use to disable instrumentation of specific functions. This attribute must be present on the declaration of __cyg_profile_func_enter and __cyg_profile_func_exit to avoid endless recursion. The following code shows a simple implementation of __cyg_profile_func_enter and __cyg_profile_func_exit to generate NVTX timeline ranges.
extern "C" void __cyg_profile_func_enter(void *this_fn, void *call_site) __attribute__((no_instrument_function));
extern "C" void __cyg_profile_func_exit(void *this_fn, void *call_site) __attribute__((no_instrument_function));

extern "C" void __cyg_profile_func_enter(void *this_fn, void *call_site)
{
    nvtxRangePushA("unknown-function");
} /* __cyg_profile_func_enter */

extern "C" void __cyg_profile_func_exit(void *this_fn, void *call_site)
{
    nvtxRangePop();
} /* __cyg_profile_func_enter */
This implementation does not provide the function name in the timeline, so it is not very useful. One way to obtain the name of the called function is to compile with -fPIC and -export-dynamic and then call dladdr on the this_fn pointer passed to __cyg_profile_func_enter. To obtain function names we need to add some code like the following.
...
    Dl_info this_fn_info;
    if ( dladdr( this_fn, &this_fn_info ) ) {
        int status = 0;
        nvtxRangePushA(this_fn_info.dli_sname);
    }
...
To support function overloading, C++ compilers use “name mangling” to encode function argument types into the names of generated functions, producing somewhat unreadable name strings. We therefore need to call __cxa_demangle on the string this_fn_info.dli_sname returned by dladdr to get back the original human-readable function declaration.
...
    int status = 0;
    abi::__cxa_demangle(this_fn_info.dli_sname,0, 0, &status);
...
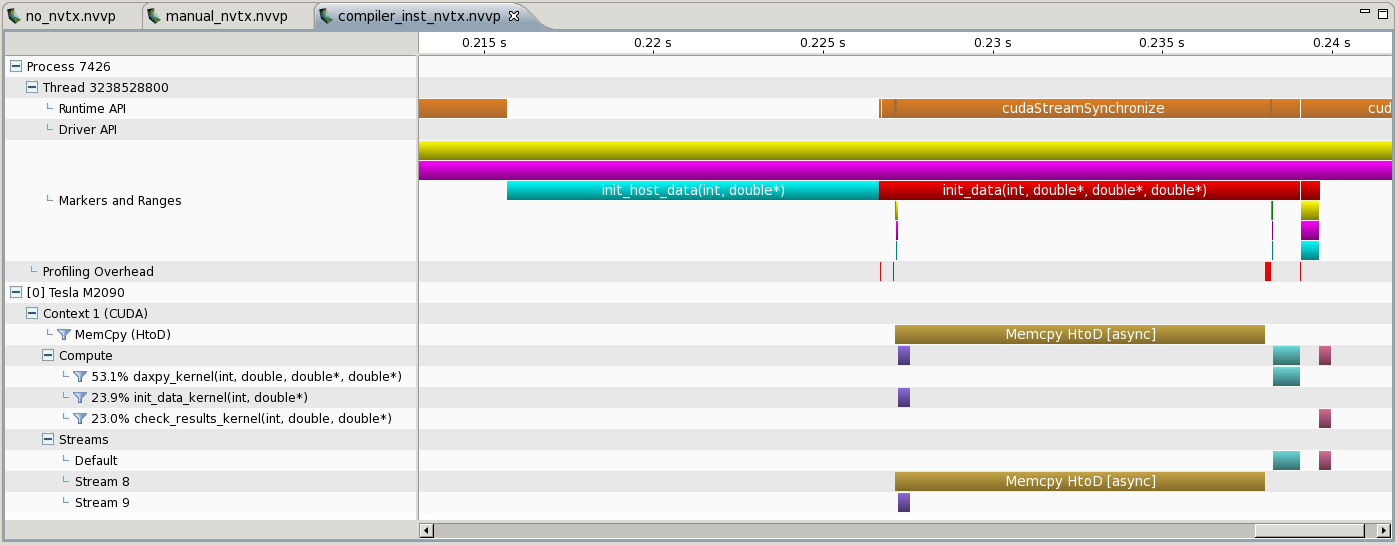
A complete example using compiler instrumentation and coloring is available on the Parallel Forall github repository. Using compiler instrumentation with the NVIDIA Visual Profiler gives us a timeline which also includes some function calls automatically generated by nvcc, as in the following screenshot.
You should be aware that using compiler instrumentation for profiling can have a significant impact on the performance of your application. Besides the overhead of the additional calls to __cyg_profile_func_enter, __cyg_profile_func_exit and NVTX many compilers disable function inlining if compiler instrumentation is used (gcc does this). This is especially important for C++ codes because many STL containers among other things require inlining to achieve good performance. For that reason you should always compare the run time of a non-instrumented build with an instrumented build. If the difference in run times is larger than 10% you need to reduce the profiling overhead to get reliable results. For gcc you can use the options -finstrument-functions-exclude-function-list or -finstrument-functions-exclude-file-list to filter frequently called functions with short run times and decrease the profiling overhead.
Other Tools
The approach described here can be extended to also collect GPU and CPU hardware counters (using CUPTI and PAPI) and to support MPI applications. A tool with built-in support for MPI, OpenMP, hardware counters and CUDA is Score-P. It can be used for profiling and tracing applications in order to determine bottlenecks. You can use Vampir to create a visualization of Score-P traces similar to the NVIDIA Visual Profiler.


