
Most modern digital chips integrate large numbers of macros in the form of memory blocks or analog blocks, like clock generators. These macros are often much larger than standard cells, which are the fundamental building blocks of digital designs.
Macro placement has a tremendous impact on the landscape of the chip, directly affecting many design metrics, such as area and power consumption. Thus, improving the placement of these macros is critical to optimizing each chip’s performance and efficiency.
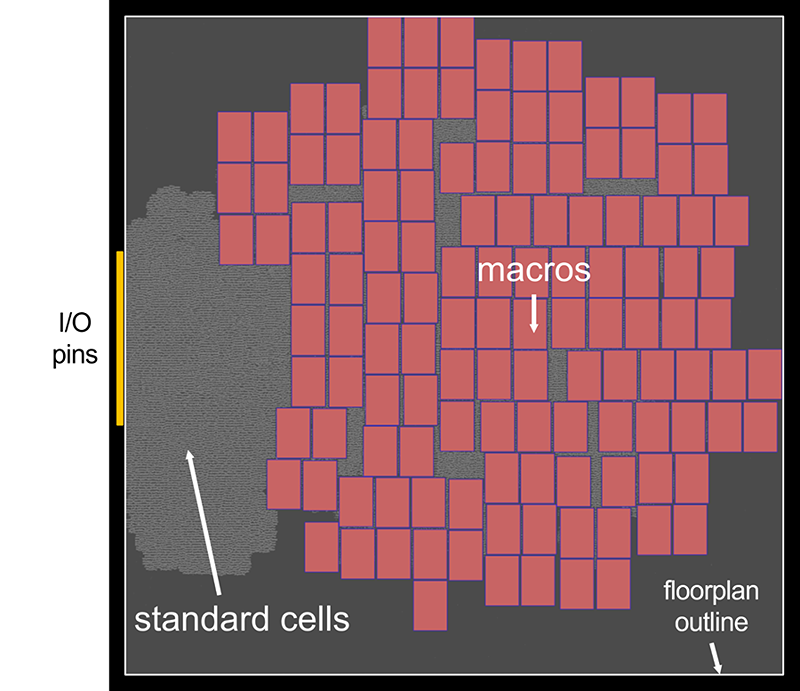
Traditionally, designers manually place macros based on time-honored practices. They may appear on the periphery of the floor plan outline, for example. However, finding optimal macro placements manually is very time-consuming. The process can be improved, given modern complex relationships between macro placement, standard cell placement, and resulting power, performance, and area (PPA).
Two recent efforts in improving macro placement are reinforcement learning (RL)-based macro placement and concurrent placement of macros and standard cells.
Reinforcement learning method
The RL method formulates the macro placement problem as a game. The actions of the game agent correspond to possible locations for the macros. By sampling many placement examples, the agent learns to optimize its policy (usually represented by a neural network) to improve the macro placement quality. This quality is estimated based on surrogate objectives such as wire length, congestion, and density.
These surrogate objectives are not evaluated on actual placements, but on approximated placements of standard cell clusters obtained from a fast but straightforward placement algorithm to keep runtime manageable. The RL method requires considerable computing resources. For example, 20 GPUs and 200 CPUs are used in training and fine-tuning the neural network model of the agent, running for 10+ hours.
Concurrent placement method
Alternatively, the concurrent cell and macro placement method takes the mixed-size placement approach that simultaneously places macros and standard cells. State-of-the-art mixed-size placement tools leverage numerical algorithms to efficiently optimize selected objectives, such as wire length and density. These can also include congestion and timing considerations in the objective function with numerical optimization. This method has been implemented in commercial EDA tools.
Although the concurrent cell and macro placement method achieves promising results, we believe it can be further improved. Numerical algorithms have many algorithm parameters, constituting a large design space. The final quality of the placement depends on which parameter configuration is chosen. Expanding this design space with concurrent cell and macro placement can further increase the suboptimality gap.
In addition, conventional placement algorithms combine multiple design objectives into a single objective for optimization. A multi-objective optimization framework could extend the search space and reduce the optimality gap.
This work aims to demonstrate that a vast design space can be efficiently searched to find better macro placement solutions using ML-based multi-objective optimization and GPU-accelerated numerical placement tools.
DREAMPlace for macro placement
This post showcases how to use the state-of-the-art open-source analytical placer DREAMPlace as the placement engine for concurrent macro and cell placement. DREAMPlace formulates the placement problem as a wire length optimization problem under a placement density constraint and solves it numerically.
Both wire length objectives and density constraints can be formulated as differentiable functions. The wire length objective is approximated with a smooth log-sum-exp function. The density constraint is seen as an electrostatic system, solved by the Poisson equation with a fast Fourier transform.
DREAMPlace computes both wire length and density gradients numerically using GPU-accelerated algorithms enabled by the PyTorch framework. It achieves over 30x speedup on global placement alone. Further work also accelerated precise placement with GPUs, achieving over 16x speedup on industrial benchmarks over CPU implementations. To learn more, see ABCDPlace: Accelerated Batch-Based Concurrent Detailed Placement on Multithreaded CPUs and GPUs.
DREAMPlace supports mixed-size placement, which simultaneously places macros and standard cells. For example, Figure 2 shows the placement process of an open-source design MemPool.
Placement parameters
We chose a set of 16 parameters in DREAMPlace to define the design space. These parameters are determined based on the observation that they significantly impact the placement quality. We included optimization-related parameters (such as the gradient-based numerical optimizer and its learning rate) and physical parameters (such as the number of bins for the density evaluation and the density target).
In addition to the original DREAMPlace parameters, we added the parameters listed below to expand further the design space of macro placement.
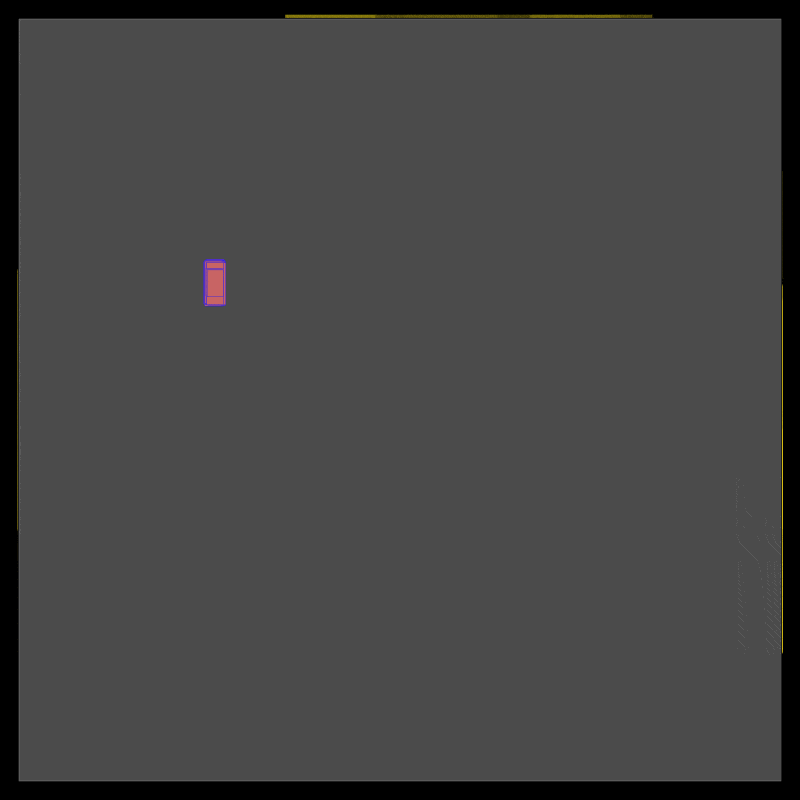
Initial Positions: DREAMPlace originally sets all initial positions of cells and macros at the center of the floor plan. As shown in Figure 3, adjusting these initial positions can significantly influence the final placement quality.
Macro Halos: To ease macro legalization, two parameters were added to enforce a minimum vertical/horizontal spacing between macros. The spacing constraint is translated as padding added around the macros.
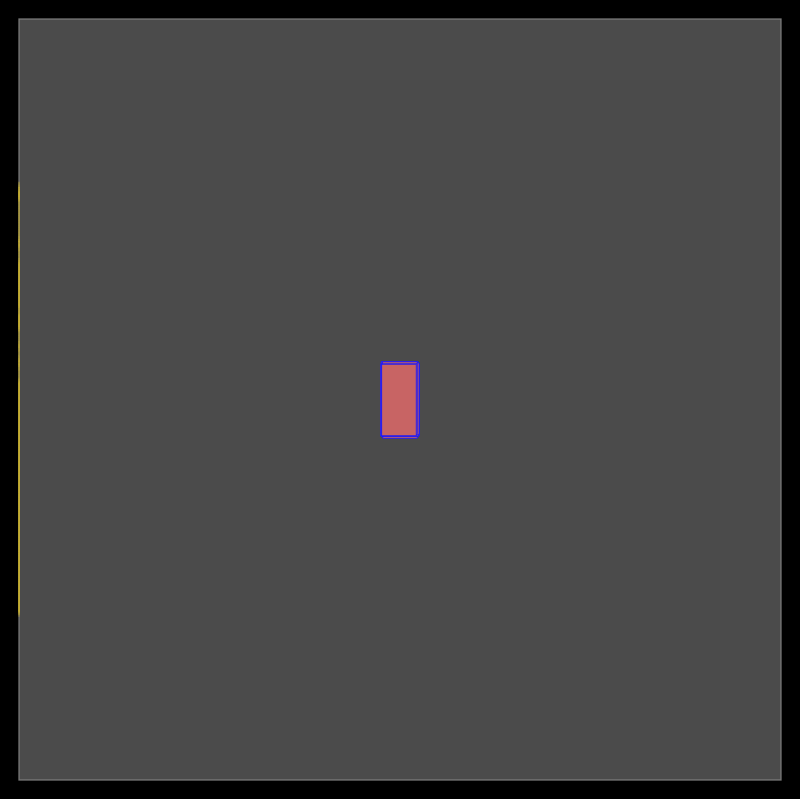
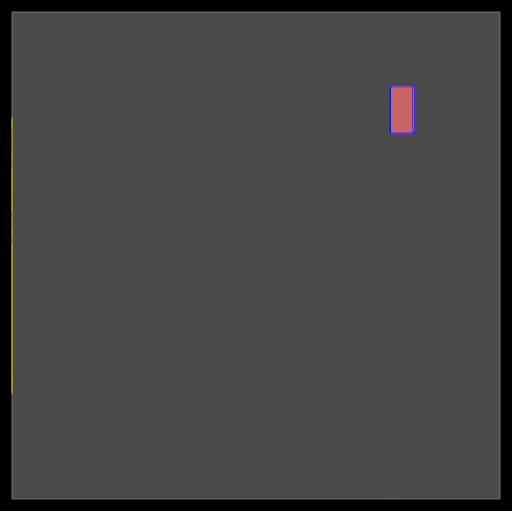
Figure 3. Modifying the initial location of the cells from the center to the upper right results in two very different final placement landscapes
Multi-objective optimization
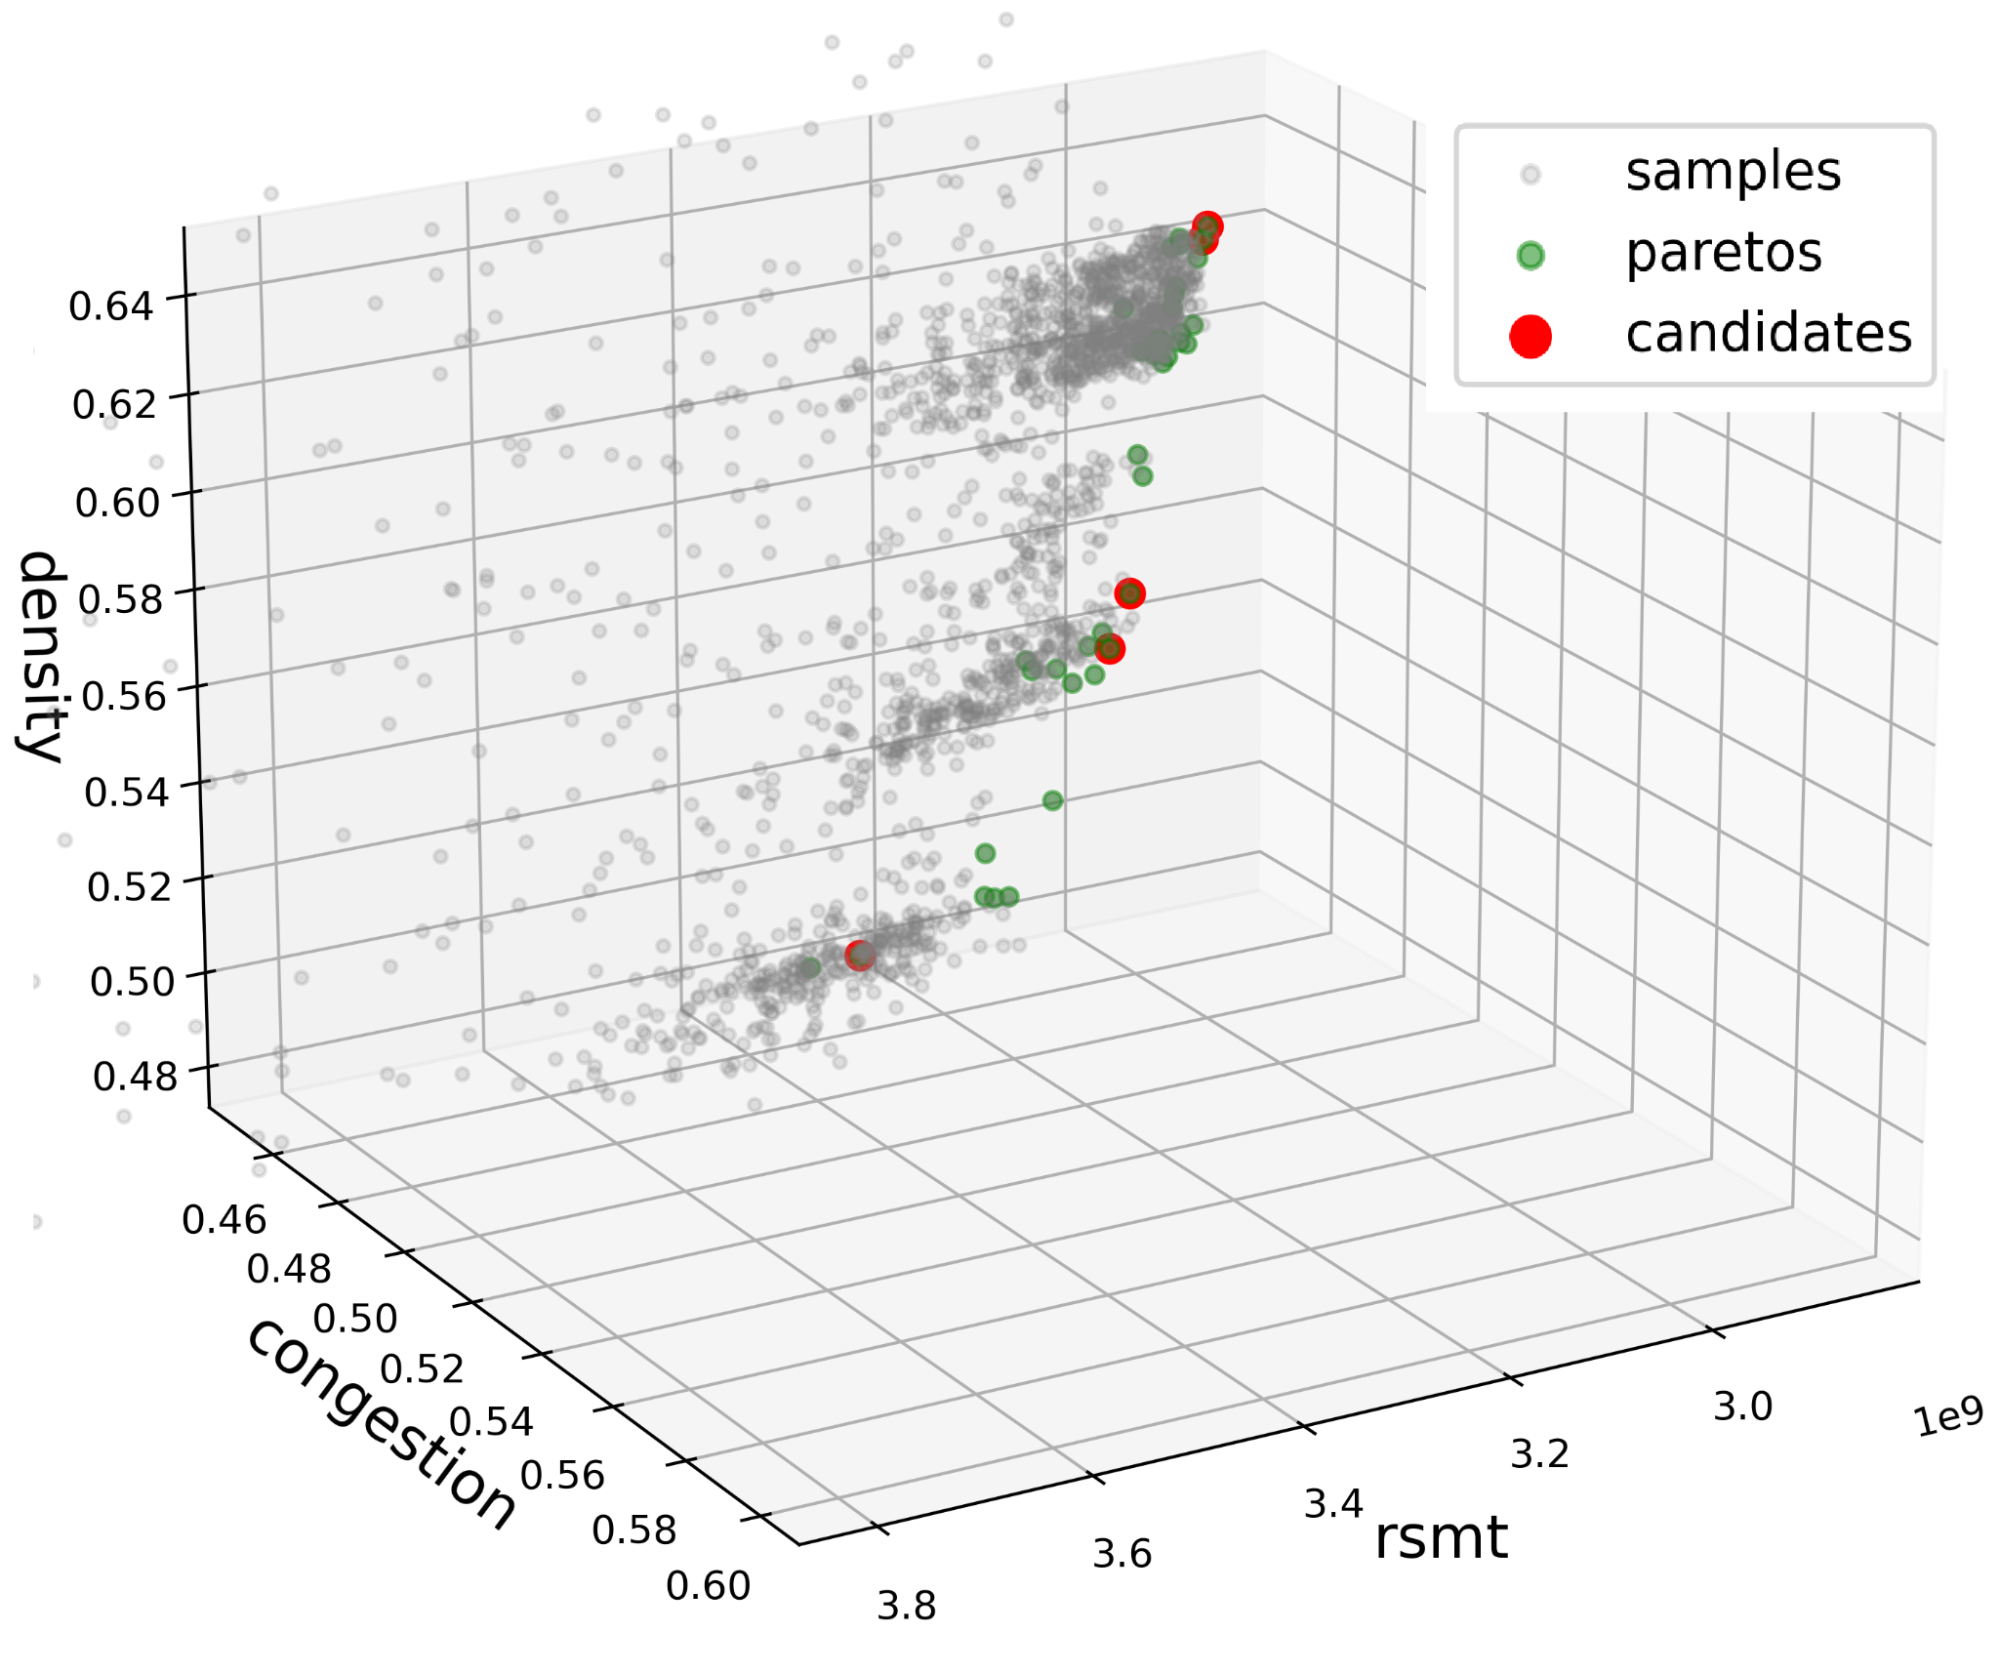
We propose to use multi-objective optimization rather than single-objective optimization in the parameter space. The objectives are wire length, density, and congestion. All three objectives are evaluated from the DREAMPlace detailed placement. The wire length is approximated with the rectilinear Steiner minimum tree (RSMT) length. The density is the target cell density used in DREAMPlace. Finally, the congestion is estimated with the RUDY algorithm.
Multi-objective optimization seeks to find the Pareto front, as shown in Figure 4. This is the set of nondominated objective-space points, where no objective can be improved without degrading at least one other objective.
Efficiently search for the Pareto front using the multi-objective tree-structured Parzen estimator (MOTPE). It is based on the Bayesian optimization algorithm, an intelligent search technique that learns an internal model as its guide.
The model approximates the relationship between the parameter configurations and the objectives from previously sampled data, which helps find better search configurations for future samples. The particularity of the MOTPE is to model the conditional distribution of parameters given the objectives by partitioning the parameter space based on the objective values.
The optimization process is illustrated in Figure 5. On the left (a), regions are defined by an imaginary Pareto front (Y*) with three sample points in a 2D objective space. The green region is worse than the Pareto front, and the blue regions include points on par or better than the current Pareto front. On the right (b), the two probability density functions l and g learned for the data sampled within blue and green regions, respectively. The new samples of the parameter will be drawn such that they are likely under distribution l instead of g.
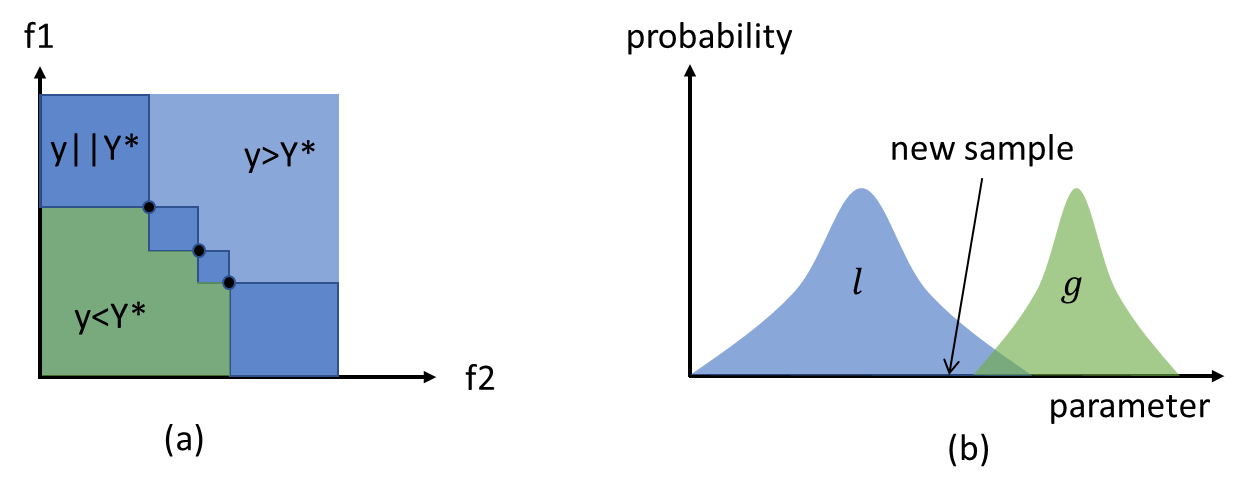
MOTPE supports a discrete search space well compared to other single-objective optimization algorithms. Also, each parameter has its conditional density, which tends to find good settings less dependent on parameter interactions.
Many Pareto-optimal points may have been found after the search—a positive fact showing the diversity of the placement solutions. However, it is impractical to evaluate all these points in a commercial Electronic Design Automation (EDA) tool due to feedback latency requirements and shared resource constraints (servers, tool licenses, and so on).
Instead, the 3D points are clustered to reduce the Pareto points to a much smaller set of candidates. The postulate is that points close to each other in the objective space correspond to similar-looking placements. Figure 4 shows such methodology, where red points correspond to the placements used in the EDA tool.
Two-level PPA evaluation
We propose a two-step PPA evaluation methodology to reduce the correlation gap between placement quality estimators and end-of-flow PPA results (Figure 6).
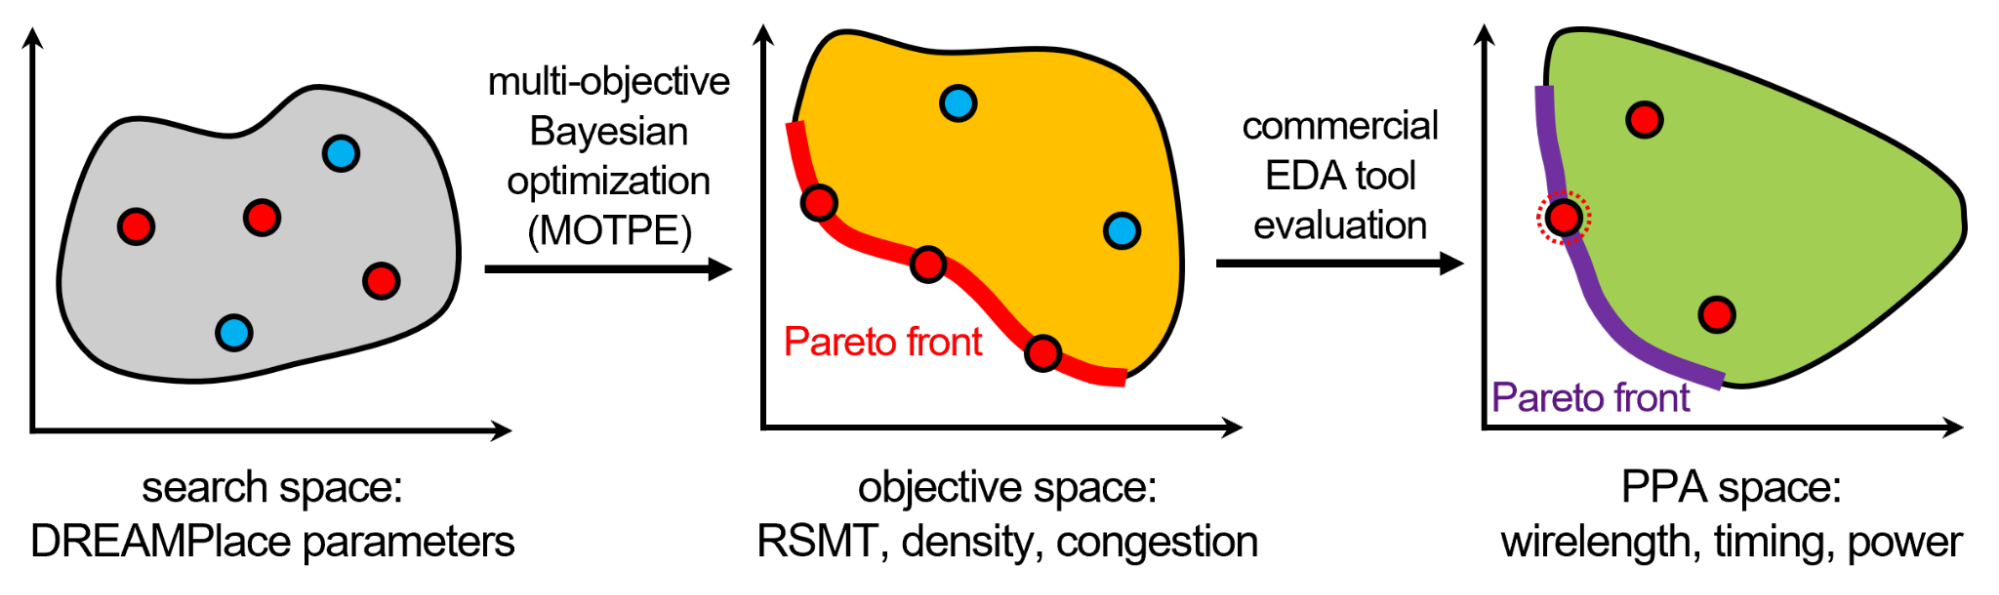
First, the AutoDMP multi-objective parameter optimization finds a set of placements whose estimated wire length, congestion, and density lie on the Pareto front. This step essentially maps the design space of the AutoDMP parameters to the objective proxy space.
Then, map the macro placements on the objective space Pareto front to the EDA tool’s real PPA space. The two Pareto fronts likely will not match since the EDA tool conducts numerous optimizations of the placement, many of which are heuristic-driven and therefore very difficult to predict.
Consequently, run the EDA tool on all the macro placements from the Pareto front of the objective proxy space and evaluate real PPA metrics, such as routed wire length, timing, and power obtained from the EDA tool flow execution. To reduce the unnecessary use of computing resources, stop the flow, evaluate PPA early (at the place-opt stage, for example), and discard unpromising macro placements.
Results
AutoDMP is evaluated on a macro placement benchmark provided by the TILOS AI-Institute. This benchmark includes a set of CPU and AI accelerator designs that have a large number of macros. It was originally proposed to fairly evaluate the performance of the Google Circuit Training method.
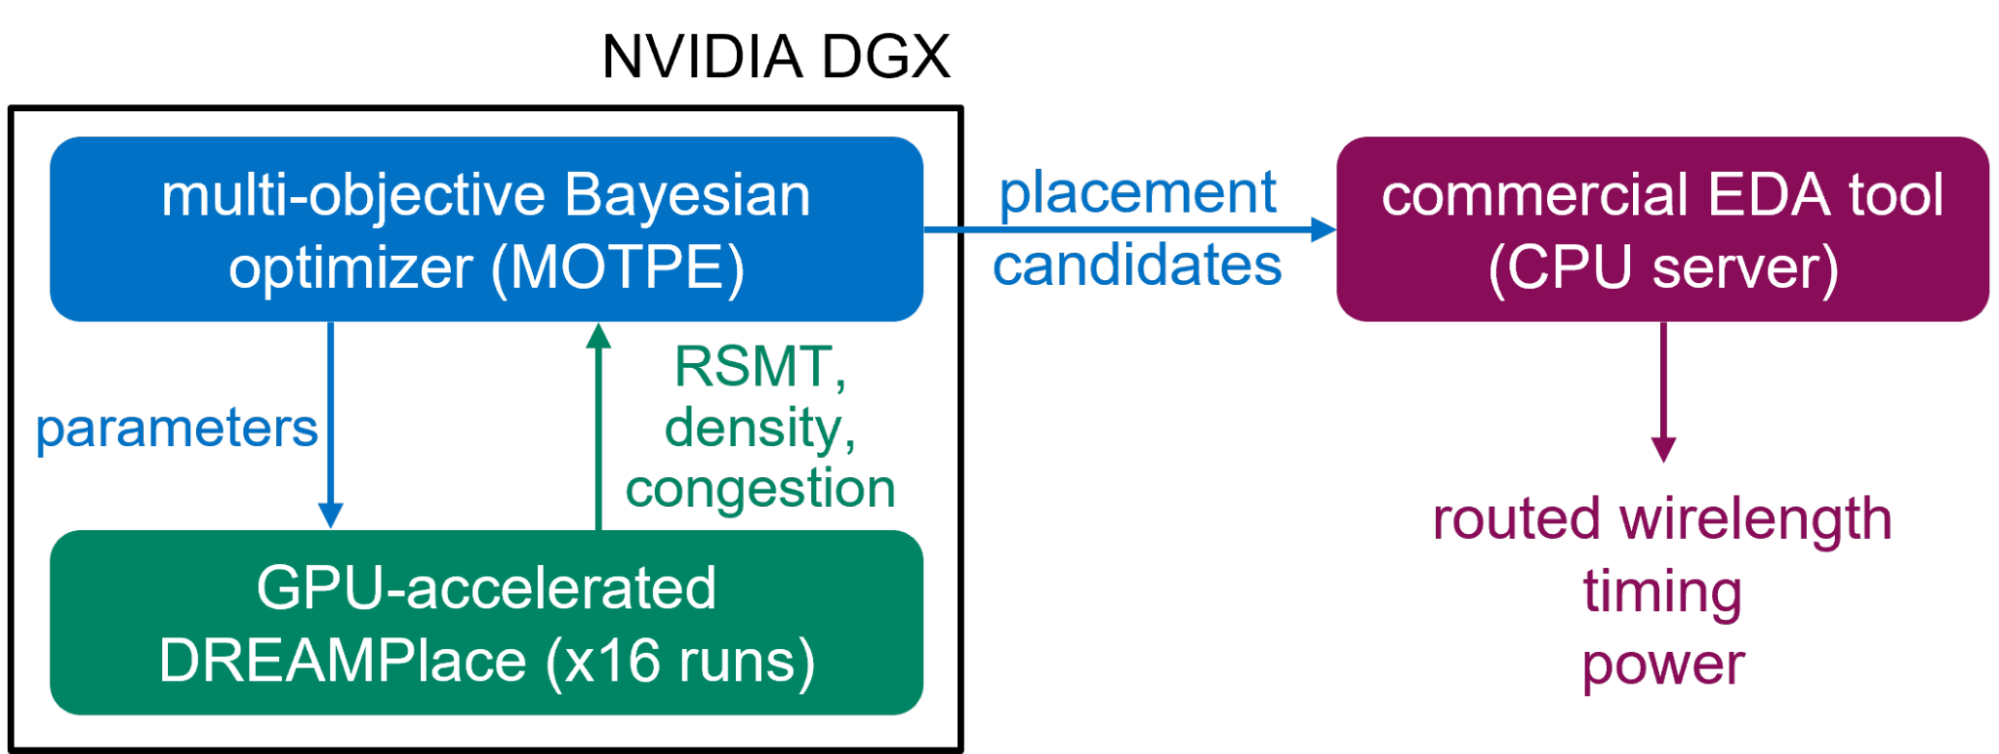
For evaluation, AutoDMP is integrated with a commercial EDA tool, as shown in Figure 7. First, run the multi-objective Bayesian optimization on an NVIDIA DGX system. This system has four A100 GPUs, each equipped with 80 GB of HBM memory. Sixteen parallel processes are spawned to sample parameters and run DREAMPlace during optimization. The selected macro placements from the Pareto front are then fed to the EDA flow provided by TILOS, which runs on a CPU server.
The TILOS benchmark includes several designs, some of which only differ in their timing and density targets. The multi-objective optimization samples 1,000 design points for each design. The search run on a single DGX System takes only a few hours.
Five macro placements are selected from the Pareto front to be processed by the EDA flow. The PPA metrics are collected at the end of the flow (post-routing). The best PPAs of those five macro placements for each design are reported in Figure 8. All metrics are normalized with the default commercial macro placement flow results.
On most designs, the PPA metrics results of AutoDMP—wire length, power, worst negative slack (WNS), and total negative slack (TNS)—are equal to or better than the commercial flow.
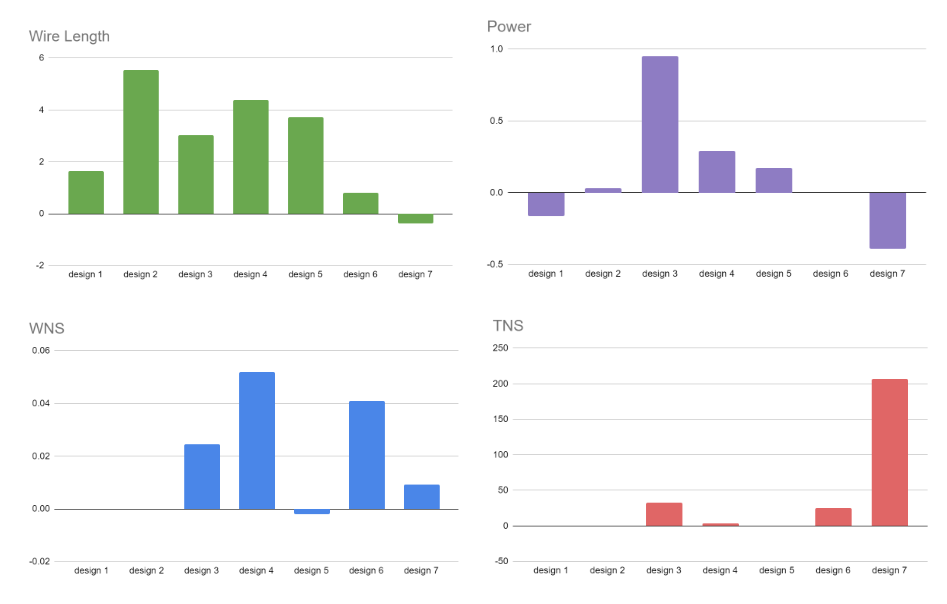
We also observed that the best parameter achieved with AutoDMP on a design in one technology node, such as NanGate45, can be applied to another technology node, such as ASAP7. This suggests that the optimal parameters found by AutoDMP might be transferable across minor design changes.
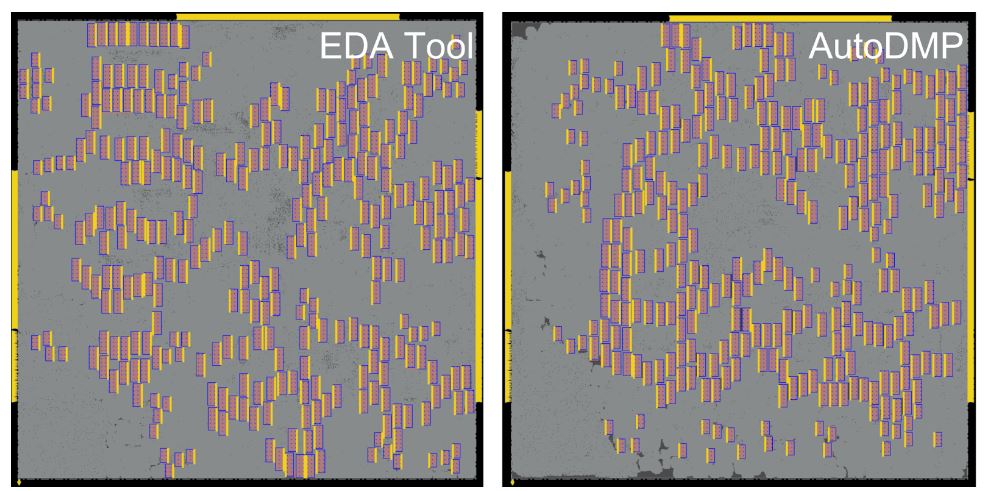
Figure 9 shows the placement of the largest design MemPool in the benchmark, which integrates 256 RISC-V cores accounting for 2.7 million standard cells and 320 memory macros. AutoDMP produces a set of macro placement candidates after a 3.5-hour search.
Conclusion
This work demonstrates the effectiveness of combining GPU-accelerated placers with AI/ML multi-objective parameter optimization. Furthermore, given the importance of scalability in modern chip design flows, we hope this methodology can unlock new prospective design space exploration techniques.
For more information and experimental results, see AutoDMP: Automated DREAMPlace-based Macro Placement. This paper will be presented at the ISPD 2023 conference, along with other NVIDIA Research work, including:
