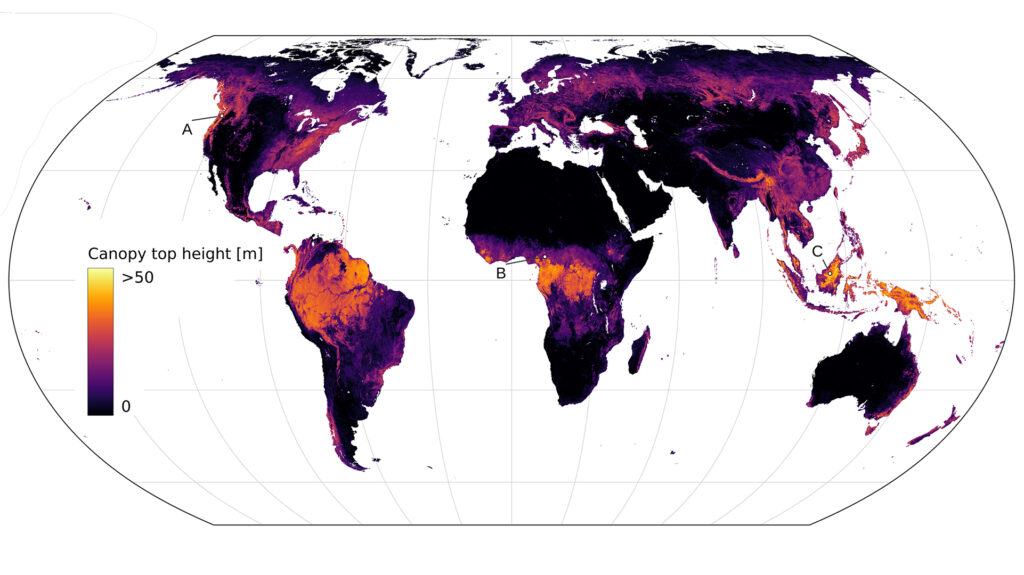
A recent study from researchers at ETH Zurich’s EcoVision Lab is the first to produce an interactive Global Canopy Height map. Using a newly developed deep learning algorithm that processes publicly available satellite images, the study could help scientists identify areas of ecosystem degradation and deforestation. The work could also guide sustainable forest management by identifying areas for prime carbon storage—a cornerstone in mitigating climate change.
“Global high-resolution data on vegetation characteristics are needed to sustainably manage terrestrial ecosystems, mitigate climate change, and prevent biodiversity loss. With this project, we aim to fill the missing data gaps by merging data from two space missions with the help of deep learning,” said Konrad Schindler, a Professor in the Department of Civil, Environmental, and Geomatic Engineering at ETH Zurich.
From rainforests to boreal woodland, forests play a key role in climate mitigation, absorbing up to 2 billion tons of carbon dioxide every year. Aboveground biomass, which includes all parts of the tree such as the trunk, bark, or branches, correlates with the amount of carbon stored in a forest.
Tree height is often an indicator of biomass, meaning accurate measurements could help with more precise carbon sequestration data and climate science models. This information could also guide forest management by identifying areas in need of conservation, restoration, and reforestation.
There have been many studies using AI-powered remote sensing models for forest monitoring. However, these typically work regionally and pose a compute challenge due to vast amounts of data. Models have also been unsuccessful in measuring heights over 30 meters, leading to an underestimation of tall canopies.
A handful of current studies are deploying satellites for capturing and measuring vegetation from space. One such mission, NASA’s Global Ecosystem Dynamics Investigation (GEDI), aims to monitor the structure of forests worldwide using a space-borne laser scanner. However, it captures only sparse samples that cover less than 4% of the global landmass.
Other global remote sensing missions offer complete coverage. The Copernicus Sentinel-2 satellites capture images at a resolution of 10×10 meters per pixel and the entire globe is captured every 5 days. However, it only sees a bird’s-eye view of the vegetation and does not measure height.
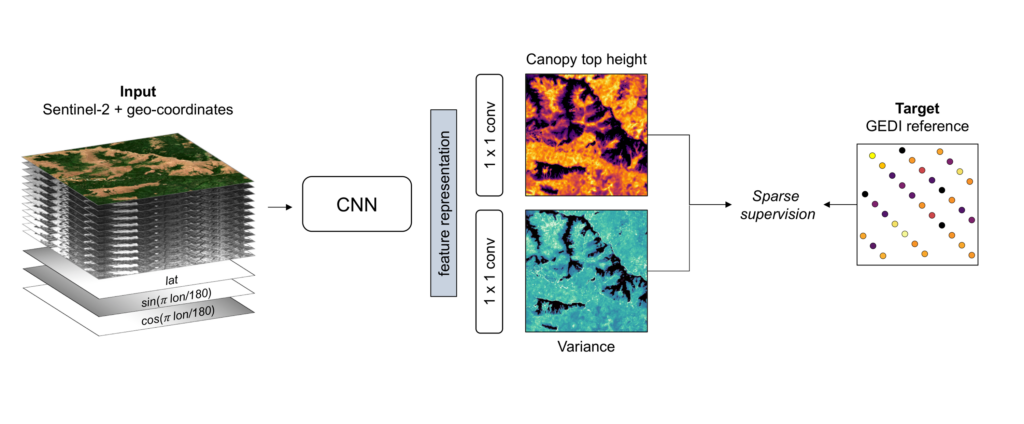
The researchers developed, trained, and deployed deep learning algorithms using data from these separate remote sensing missions to create the first global vegetation height map. The team trained an ensemble of fully convolutional neural networks (CNNs) on canopy top height from the GEDI data. Using a dataset of 600 million GEDI footprints, along with the corresponding Sentinel-2 image patches, the algorithm learns to extract canopy height from spectral and textural image patterns.
When the models are up and running, they automatically process over 250,000 images and estimate canopy height for the map at a 10-meter ground-sampling distance. It takes 10 days to cover the globe using a high-performance cluster equipped with NVIDIA RTX 2080 GPUs. According to Schindler, ETH Zurich’s high-performance computing system Euler, contains a variety of GPUs running over 1,500 graphics cards.
By modeling the uncertainty in the data and using an ensemble of five separately trained CNNs the models have a level of transparency not often seen in deep learning algorithms. Uncertainty is quantified for every single pixel estimate, which could give researchers and forest managers confidence when making decisions based on the information.
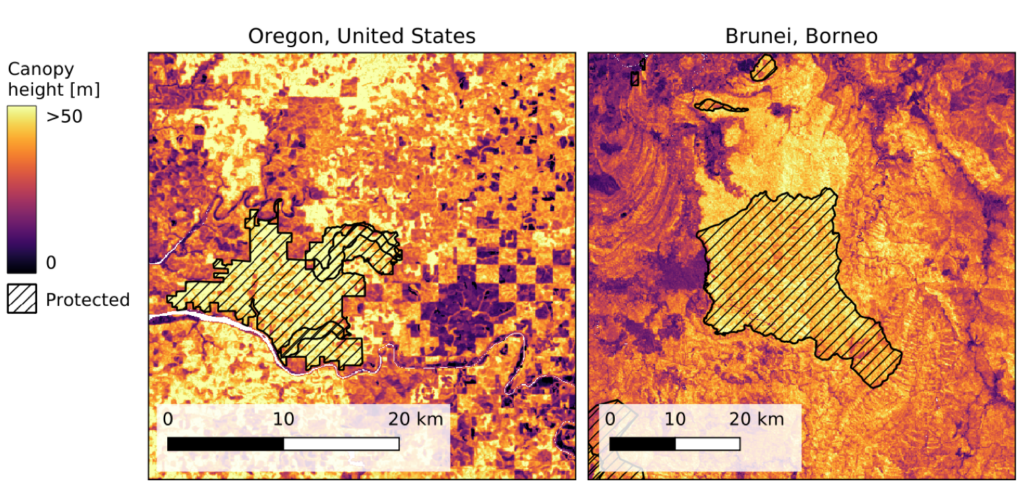
The researchers found that protected areas, such as the Oregon Coast Range and the Ulu Temburong National Park in Borneo often contained higher vegetation. About 34% of canopies taller than 30 meters grow in these areas.
According to the study, the model can be deployed annually to track canopy height change over time. The researchers also point out that the maps could be used to evaluate regions where wildfires have occurred, giving a more accurate map of damage.
“We hope that this work will advance future research in climate, carbon, and biodiversity modeling. We also hope that our freely available map can support the work of conservationists in practice. In the future, we would like to expand our approach to mapping biomass as well as temporal changes on a global scale,” said lead author Nico Lang, a PhD student in the EcoVision Lab, part of the Photogrammetry and Remote Sensing group at ETH Zürich.
EcoVision also plans to make the code available soon. The lab, founded by ETH Zurich Professor Konrad Schindler and University of Zurich Professor Jan Dirk Wegner in 2017, is dedicated to developing machine learning algorithms for large-scale environmental data analysis. For more information refer to their project page, A high-resolution canopy height model of the Earth.
Read the study. >>
Read more. >>
