
 Understanding GPU usage provides important insights for IT administrators managing a data center. Trends in GPU metrics correlate with workload behavior and make it possible to optimize resource allocation, diagnose anomalies, and increase overall data center efficiency. NVIDIA Data Center GPU Manager (DCGM) offers a comprehensive tool suite to simplify administration and monitoring of NVIDIA Tesla-accelerated data centers.
One key capability provided by DCGM is GPU telemetry. DCGM includes sample code for integrating GPU metrics with open source telemetry frameworks such as collectd and Prometheus. The DCGM API can also be used to write custom code that can integrate with site specific telemetry frameworks.
Let’s look at how to integrate DCGM with collectd on a CentOS system, making GPU telemetry data available alongside your existing telemetry data.
Integrating DCGM with collectd
Prerequisites
First you need to install and configure collectd and DCGM.
If collectd is not already present on the system, you can install it from the EPEL repository. (Unless otherwise specified, all command line examples need to be run as a superuser.)
# yum install -y epel-release
# yum install -y collectd
DCGM is available free-of-charge from the NVIDIA website. Download the x86_64 RPM package and install it.
# rpm --install datacenter-gpu-manager-1.5.6-1.x86_64.rpm
The DCGM host engine service (nv-hostengine) needs to be running in order to collect the GPU telemetry data.
# nv-hostengine
Verify the DCGM host engine service is running by using it to query the current temperature of the GPUs. Note, this command can be run as a non-superuser.
$ dcgmi dmon -e 150 -c 1
If you want to automatically start the host engine when the system starts, configure a DCGM systemd service. Otherwise the host engine will need to be started manually whenever the system restarts.
[Unit]
Description=DCGM service

[Service]
User=root
PrivateTmp=false
ExecStart=/usr/bin/nv-hostengine -n
Restart=on-abort

[Install]
WantedBy=multi-user.target
Setting up the DCGM collectd plugin
Now that you’ve successfully installed collectd and DCGM, the real work to integrate the two begins. The DCGM package includes a sample collectd plugin implemented using the DCGM Python binding. The plugin needs to be installed and configured to use it with collectd.
First, copy the DCGM Python binding and collectd plugin to the collectd plugin directory. The DCGM collectd plugin installs into a subdirectory to separate it from other collectd plugins.
# mkdir /usr/lib64/collectd/dcgm
# cp /usr/src/dcgm/bindings/*.py /usr/lib64/collectd/dcgm
# cp /usr/src/dcgm/samples/scripts/dcgm_collectd_plugin.py /usr/lib64/collectd/dcgm
Next, verify that the plugin is configured with the correct location of the DCGM library (libdcgm.so) on this system. The DCGM library is installed in /usr/lib64 on CentOS systems by default. Edit /usr/lib64/collectd/dcgm/dcgm_collectd_plugin.py so that the variable g_dcgmLibPath is set to /usr/lib64.
# sed -i -e 's|\(g_dcgmLibPath =\) '"'"'/usr/lib'"'"'|\1 '"'"'/usr/lib64'"'"'|g' /usr/lib64/collectd/dcgm/dcgm_collectd_plugin.py
The DCGM plugin is initially configured to collect a number of generally useful GPU metrics. You can customize the list of metrics by modifying the g_publishFieldIds variable. You’ll find the names and meaning of the available fields in /usr/src/dcgm/bindings/dcgm_fields.py.
Configuring collectd
Once the DCGM collect plugin has been set up, collectd still needs to be configured to recognize the new metrics.
First, configure collectd to recognize the DCGM plugin by adding dcgm.conf to /etc/collectd.d.
LoadPlugin python
<Plugin python>
      ModulePath "/usr/lib64/collectd/dcgm"
      LogTraces true
      Interactive false
      Import "dcgm_collectd_plugin"
</Plugin>
Second, add a corresponding collectd type for each of the GPU fields defined in /usr/lib64/collectd/dcgm/dcgm_collectd_plugin.py. Assuming no additional fields were defined, append the following type information to /usr/share/collectd/types.db.
### DCGM types
ecc_dbe_aggregate_total                  value:GAUGE:0:U
ecc_sbe_aggregate_total                  value:GAUGE:0:U
ecc_dbe_volatile_total                   value:GAUGE:0:U
ecc_sbe_volatile_total                   value:GAUGE:0:U
fb_free                                  value:GAUGE:0:U
fb_total                                 value:GAUGE:0:U
fb_used                                  value:GAUGE:0:U
gpu_temp                                 value:GAUGE:U:U
gpu_utilization                          value:GAUGE:0:100
mem_copy_utilization                     value:GAUGE:0:100
memory_clock                             value:GAUGE:0:U
memory_temp                              value:GAUGE:U:U
nvlink_bandwidth_total                   value:GAUGE:0:U
nvlink_recovery_error_count_total        value:GAUGE:0:U
nvlink_replay_error_count_total          value:GAUGE:0:U
pcie_replay_counter                      value:GAUGE:0:U
pcie_rx_throughput                       value:GAUGE:0:U
pcie_tx_throughput                       value:GAUGE:0:U
power_usage                              value:GAUGE:0:U
power_violation                          value:GAUGE:0:U
retired_pages_dbe                        value:GAUGE:0:U
retired_pages_pending                    value:GAUGE:0:U
retired_pages_sbe                        value:GAUGE:0:U
sm_clock                                 value:GAUGE:0:U
thermal_violation                        value:GAUGE:0:U
total_energy_consumption                 value:GAUGE:0:U
xid_errors                               value:GAUGE:0:U
If you defined additional GPU fields when installing the DCGM collectd plugin, then a corresponding collectd type needs to be manually added to the list above. The Python field name in /usr/lib64/collectd/dcgm/dcgm_collectd_plugin.py and the collectd type in /usr/share/collectd/types.db are related, but different. To correlate the two variants of a metric name, use the field ID defined in /usr/src/dcgm/bindings/dcgm_fields.py to correlate the two variants of a metric name. For example, DCGM_FI_DEV_GPU_TEMP represents the GPU temperature in /usr/lib64/collectd/dcgm/dcgm_collectd_plugin.py. Looking up this field in /usr/src/dcgm/bindings/dcgm_fields.py shows that it corresponds to fieldID 150. The list of collectd visible field names can be obtained from the command dcgmi dmon -l; the collectd type name corresponding to field ID 150 is gpu_temp.
(Re-)Start collectd
When DCGM is successfully integrated with collectd, output similar to what is shown below should be reported by collectd when it starts.
collectd[25]: plugin_load: plugin "python" successfully loaded.
…
collectd[25]: uc_update: Value too old: name = f707be0c326d/dcgm_collectd-GPU-ace28880-3f61-dbc4-1f8c-0dc7916f3108/gpu_temp-0; value time = 1539719060.000; last cache update = 1539719060.000;
collectd[25]: uc_update: Value too old: name = f707be0c326d/dcgm_collectd-GPU-ace28880-3f61-dbc4-1f8c-0dc7916f3108/power_usage-0; value time = 1539719060.000; last cache update = 1539719060.000;
collectd[25]: uc_update: Value too old: name = f707be0c326d/dcgm_collectd-GPU-ace28880-3f61-dbc4-1f8c-0dc7916f3108/ecc_sbe_volatile_total-0; value time = 1539719060.000; last cache update = 1539719060.000;
collectd[25]: uc_update: Value too old: name = f707be0c326d/dcgm_collectd-GPU-ace28880-3f61-dbc4-1f8c-0dc7916f3108/ecc_dbe_volatile_total-0; value time = 1539719060.000; last cache update = 1539719060.000;
collectd[25]: uc_update: Value too old: name = f707be0c326d/dcgm_collectd-GPU-ace28880-3f61-dbc4-1f8c-0dc7916f3108/ecc_sbe_aggregate_total-0; value time = 1539719060.000; last cache update = 1539719060.000;
...
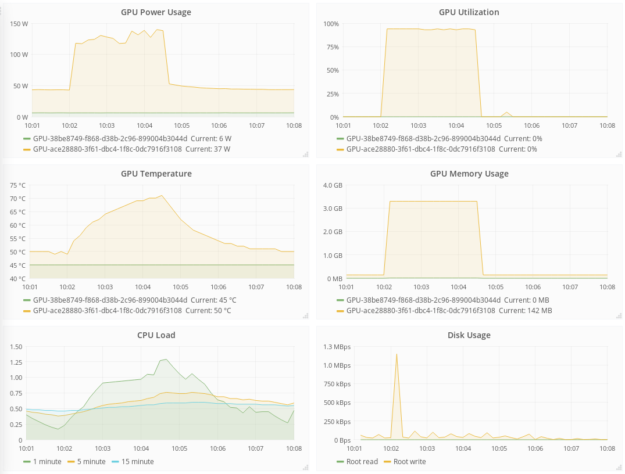
The GPU data provided by DCGM can be visualized along side the rest of your monitoring data, as shown in figure 1.
Summary
Integrating DCGM with the collectd telemetry framework provides IT administrators with a comprehensive view of GPU usage. If you are already using collectd, the information in this blog post will enable you to include GPU monitoring on the same pane of glass as the rest of your telemetry data. If you are using another telemetry framework, please see Chapter 4 of the DCGM User’s Guide for more information on how to integrate GPU metrics into your solution.
GPU telemetry is just scratching the surface of the full feature set of DCGM. DCGM also includes active health checks, diagnostics, as well as management and accounting capabilities.