Monitoring GPUs is critical for infrastructure or site reliability engineering (SRE) teams who manage large-scale GPU clusters for AI or HPC workloads. GPU metrics allow teams to understand workload behavior and thus optimize resource allocation and utilization, diagnose anomalies, and increase overall data center efficiency. Apart from infrastructure teams, you might also be interested in metrics whether you are a researcher working on GPU-accelerated ML workflows or a datacenter designer who like to understand GPU utilization and saturation for capacity planning.
These trends become even more important as AI/ML workloads are containerized and scaled using container management platforms such as Kubernetes. In this post, we provide an overview of NVIDIA Data Center GPU Manager (DCGM) and how it can be integrated into open-source tools such as Prometheus and Grafana to form the building blocks of a GPU monitoring solution for Kubernetes.
NVIDIA DCGM
NVIDIA DCGM is a set of tools for managing and monitoring NVIDIA GPUs in large-scale, Linux-based cluster environments. It’s a low overhead tool that can perform a variety of functions including active health monitoring, diagnostics, system validation, policies, power and clock management, group configuration, and accounting. For more information, see the DCGM User Guide.
DCGM includes APIs for gathering GPU telemetry. Of particular interest are GPU utilization metrics (for monitoring Tensor Cores, FP64 units, and so on), memory metrics, and interconnect traffic metrics. DCGM offers bindings for various languages such as C and Python and these are included in the installer packages. For integration with the container ecosystem where Go is popular as a programming language, there are Go bindings based on the DCGM APIs. The repository includes samples and a REST API to demonstrate how to use the Go API for monitoring GPUs. Go check out the NVIDIA/gpu-monitoring-tools repo!
DCGM exporter
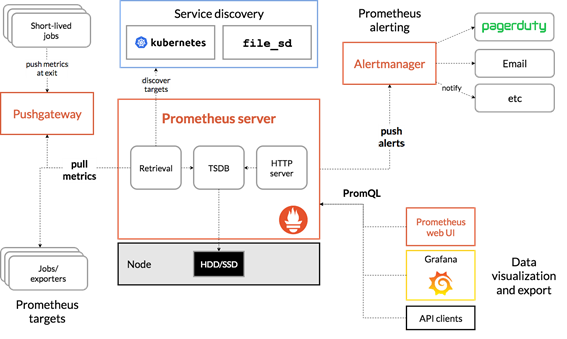
Monitoring stacks usually consist of a collector, a time-series database to store metrics, and a visualization layer. A popular open-source stack is Prometheus, used along with Grafana as the visualization tool to create rich dashboards. Prometheus also includes Alertmanager to create and manage alerts. Prometheus is deployed along with kube-state-metrics and node_exporter to expose cluster-level metrics for Kubernetes API objects and node-level metrics such as CPU utilization. Figure 1 shows a sample architecture of Prometheus.
Building on the Go API described earlier, you can use DCGM to expose GPU metrics to Prometheus. We built a project called dcgm-exporter for this purpose.
dcgm-exporter uses the Go bindings to collect GPU telemetry data from DCGM and then exposes the metrics for Prometheus to pull from using an http endpoint (/metrics).
dcgm-exporter is also configurable. You can customize the GPU metrics to be collected by DCGM by using an input configuration file in the .csv format.
Per-pod GPU metrics in a Kubernetes cluster
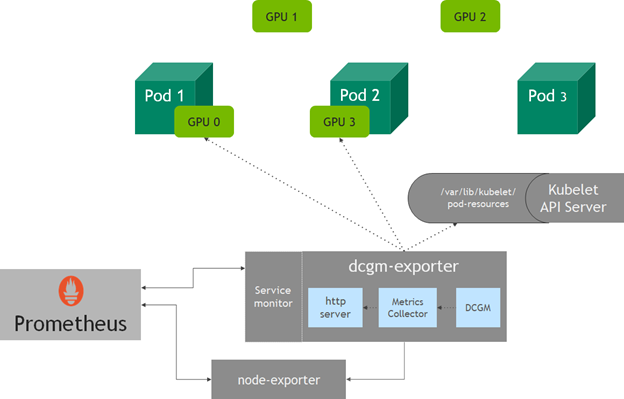
dcgm-exporter collects metrics for all available GPUs on a node. However, in Kubernetes, you might not necessarily know which GPUs in a node would be assigned to a pod when it requests GPU resources. Starting in v1.13, kubelet has added a device monitoring feature that lets you find out the assigned devices to the pod—pod name, pod namespace, and device ID—using a pod-resources socket.
The http server in dcgm-exporter connects to the kubelet pod-resources server (/var/lib/kubelet/pod-resources) to identify the GPU devices running on a pod and appends the GPU devices pod information to the metrics collected.
Setting up a GPU monitoring solution
Here are some examples of setting up dcgm-exporter. If you use the NVIDIA GPU Operator, then dcgm-exporter is one of the components deployed as part of the operator.
The documentation includes steps for setting up a Kubernetes cluster. For the purposes of brevity, fast forward to the steps where you would have a Kubernetes cluster running with the NVIDIA software components, for example, drivers, container runtime, and Kubernetes device plugin. You deploy Prometheus using the Prometheus Operator, which also conveniently deploys a Grafana dashboard. In this post, you use a single-node Kubernetes cluster for simplicity.
When setting up Prometheus Operator currently provided by the community Helm chart, it’s important to follow the steps in Integrating GPU Telemetry into Kubernetes. You must expose Grafana for external access, and prometheusSpec.serviceMonitorSelectorNilUsesHelmValues must be set to false.
Briefly, setting up monitoring consists of running the following commands:
$ helm repo add prometheus-community \
https://prometheus-community.github.io/helm-charts

$ helm repo update
$ helm inspect values prometheus-community/kube-prometheus-stack > /tmp/kube-prometheus-stack.values
# Edit /tmp/kube-prometheus-stack.values in your favorite editor
# according to the documentation
# This exposes the service via NodePort so that Prometheus/Grafana
# are accessible outside the cluster with a browser
$ helm install prometheus-community/kube-prometheus-stack \
--create-namespace --namespace prometheus \
--generate-name \
--set prometheus.service.type=NodePort \
--set prometheus.prometheusSpec.serviceMonitorSelectorNilUsesHelmValues=false
At this point, your cluster should look something like the following, where all the Prometheus pods and services are running:
$ kubectl get pods -A
NAMESPACE     NAME                                                              READY   STATUS    RESTARTS   AGE
kube-system   calico-kube-controllers-8f59968d4-zrsdt                           1/1     Running   0          18m
kube-system   calico-node-c257f                                                 1/1     Running   0          18m
kube-system   coredns-f9fd979d6-c52hz                                           1/1     Running   0          19m
kube-system   coredns-f9fd979d6-ncbdp                                           1/1     Running   0          19m
kube-system   etcd-ip-172-31-27-93                                              1/1     Running   1          19m
kube-system   kube-apiserver-ip-172-31-27-93                                    1/1     Running   1          19m
kube-system   kube-controller-manager-ip-172-31-27-93                           1/1     Running   1          19m
kube-system   kube-proxy-b9szp                                                  1/1     Running   1          19m
kube-system   kube-scheduler-ip-172-31-27-93                                    1/1     Running   1          19m
kube-system   nvidia-device-plugin-1602308324-jg842                             1/1     Running   0          17m
prometheus    alertmanager-kube-prometheus-stack-1602-alertmanager-0            2/2     Running   0          92s
prometheus    kube-prometheus-stack-1602-operator-c4bc5c4d5-f5vzc               2/2     Running   0          98s
prometheus    kube-prometheus-stack-1602309230-grafana-6b4fc97f8f-66kdv         2/2     Running   0          98s
prometheus    kube-prometheus-stack-1602309230-kube-state-metrics-76887bqzv2b   1/1     Running   0          98s
prometheus    kube-prometheus-stack-1602309230-prometheus-node-exporter-rrk9l   1/1     Running   0          98s
prometheus    prometheus-kube-prometheus-stack-1602-prometheus-0                3/3     Running   1          92s


$ kubectl get svc -A
NAMESPACE     NAME                                                        TYPE        CLUSTER-IP       EXTERNAL-IP   PORT(S)                        AGE
default       kubernetes                                                  ClusterIP   10.96.0.1        <none>        443/TCP                        20m
kube-system   kube-dns                                                    ClusterIP   10.96.0.10       <none>        53/UDP,53/TCP,9153/TCP         20m
kube-system   kube-prometheus-stack-1602-coredns                          ClusterIP   None             <none>        9153/TCP                       2m18s
kube-system   kube-prometheus-stack-1602-kube-controller-manager          ClusterIP   None             <none>        10252/TCP                      2m18s
kube-system   kube-prometheus-stack-1602-kube-etcd                        ClusterIP   None             <none>        2379/TCP                       2m18s
kube-system   kube-prometheus-stack-1602-kube-proxy                       ClusterIP   None             <none>        10249/TCP                      2m18s
kube-system   kube-prometheus-stack-1602-kube-scheduler                   ClusterIP   None             <none>        10251/TCP                      2m18s
kube-system   kube-prometheus-stack-1602-kubelet                          ClusterIP   None             <none>        10250/TCP,10255/TCP,4194/TCP   2m12s
prometheus    alertmanager-operated                                       ClusterIP   None             <none>        9093/TCP,9094/TCP,9094/UDP     2m12s
prometheus    kube-prometheus-stack-1602-alertmanager                     ClusterIP   10.104.106.174   <none>        9093/TCP                       2m18s
prometheus    kube-prometheus-stack-1602-operator                         ClusterIP   10.98.165.148    <none>        8080/TCP,443/TCP               2m18s
prometheus    kube-prometheus-stack-1602-prometheus                       NodePort    10.105.3.19      <none>        9090:30090/TCP                 2m18s
prometheus    kube-prometheus-stack-1602309230-grafana                    ClusterIP   10.100.178.41    <none>        80/TCP                         2m18s
prometheus    kube-prometheus-stack-1602309230-kube-state-metrics         ClusterIP   10.100.119.13    <none>        8080/TCP                       2m18s
prometheus    kube-prometheus-stack-1602309230-prometheus-node-exporter   ClusterIP   10.100.56.74     <none>        9100/TCP                       2m18s
prometheus    prometheus-operated                                         ClusterIP   None             <none>        9090/TCP                       2m12s
Installing dcgm-exporter
Here’s how to get started installing dcgm-exporter to monitor GPU performance and utilization. You use the Helm chart for setting up dcgm-exporter. First, add the Helm repo:
$ helm repo add gpu-helm-charts \
https://nvidia.github.io/gpu-monitoring-tools/helm-charts
$ helm repo update
Then, install the chart using Helm:
$ helm install \
   --generate-name \
   gpu-helm-charts/dcgm-exporter
You can observe the deployment using the following command:
$ helm ls
NAME                            NAMESPACE       REVISION        APP VERSION
dcgm-exporter-1-1601677302      default         1               dcgm-exporter-1.1.0             2.0.10
nvidia-device-plugin-1601662841 default         1          nvidia-device-plugin-0.7.0      0.7.0
The Prometheus and Grafana services should be exposed as follows:
$ kubectl get svc -A
NAMESPACE     NAME                                                      TYPE        CLUSTER-IP       EXTERNAL-IP   PORT(S)                        AGE
default       dcgm-exporter                                             ClusterIP   10.99.34.128     <none>        9400/TCP                       43d
default       kubernetes                                                  ClusterIP   10.96.0.1        <none>        443/TCP                        20m
kube-system   kube-dns                                                    ClusterIP   10.96.0.10       <none>        53/UDP,53/TCP,9153/TCP         20m
kube-system   kube-prometheus-stack-1602-coredns                          ClusterIP   None             <none>        9153/TCP                       2m18s
kube-system   kube-prometheus-stack-1602-kube-controller-manager          ClusterIP   None             <none>        10252/TCP                      2m18s
kube-system   kube-prometheus-stack-1602-kube-etcd                        ClusterIP   None             <none>        2379/TCP                       2m18s
kube-system   kube-prometheus-stack-1602-kube-proxy                       ClusterIP   None             <none>        10249/TCP                      2m18s
kube-system   kube-prometheus-stack-1602-kube-scheduler                   ClusterIP   None             <none>        10251/TCP                      2m18s
kube-system   kube-prometheus-stack-1602-kubelet                          ClusterIP   None             <none>        10250/TCP,10255/TCP,4194/TCP   2m12s
prometheus    alertmanager-operated                                       ClusterIP   None             <none>        9093/TCP,9094/TCP,9094/UDP     2m12s
prometheus    kube-prometheus-stack-1602-alertmanager                     ClusterIP   10.104.106.174   <none>        9093/TCP                       2m18s
prometheus    kube-prometheus-stack-1602-operator                         ClusterIP   10.98.165.148    <none>        8080/TCP,443/TCP               2m18s
prometheus    kube-prometheus-stack-1602-prometheus                       NodePort    10.105.3.19      <none>        9090:30090/TCP                 2m18s
prometheus    kube-prometheus-stack-1602309230-grafana                    ClusterIP   10.100.178.41    <none>        80:32032/TCP                   2m18s
prometheus    kube-prometheus-stack-1602309230-kube-state-metrics         ClusterIP   10.100.119.13    <none>        8080/TCP                       2m18s
prometheus    kube-prometheus-stack-1602309230-prometheus-node-exporter   ClusterIP   10.100.56.74     <none>        9100/TCP                       2m18s
prometheus    prometheus-operated                                         ClusterIP   None             <none>        9090/TCP                       2m12s
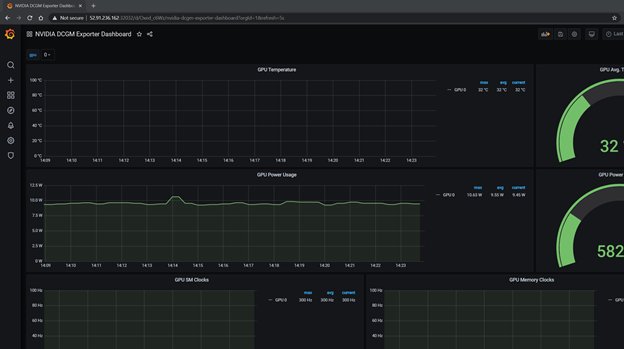
Using the Grafana service exposed at port 32032, access the Grafana homepage. Log in to the dashboard using the credentials available in the Prometheus chart: the adminPassword field in prometheus.values.
To now start a Grafana dashboard for GPU metrics, import the reference NVIDIA dashboard from Grafana Dashboards.
Using the DCGM dashboard
Now run some GPU workloads. For this purpose, DCGM includes a CUDA load generator called dcgmproftester. It can be used to generate deterministic CUDA workloads for reading and validating GPU metrics. We have a containerized dcgmproftester that you can use, run on the Docker command line. This example generates a half precision (FP16) matrix-multiply (GEMM) and uses the Tensor Cores on the GPU.
Generating a load
To generate a load, you must first download DCGM and containerize it. The following script creates a container that can be used to run dcgmproftester. This container is available on the NVIDIA DockerHub repository.
#!/usr/bin/env bash
set -exo pipefail

mkdir -p /tmp/dcgm-docker
pushd /tmp/dcgm-docker

cat > Dockerfile <<EOF
ARG BASE_DIST
ARG CUDA_VER
FROM nvidia/cuda:\${CUDA_VER}-base-\${BASE_DIST}
LABEL io.k8s.display-name="NVIDIA dcgmproftester"

ARG DCGM_VERSION

WORKDIR /dcgm
RUN apt-get update && apt-get install -y --no-install-recommends \
    libgomp1 \
    wget && \
    rm -rf /var/lib/apt/lists/* && \
    wget --no-check-certificate https://developer.download.nvidia.com/compute/redist/dcgm/\${DCGM_VERSION}/DEBS/datacenter-gpu-manager_\${DCGM_VERSION}_amd64.deb && \
    dpkg -i datacenter-gpu-manager_*.deb && \
    rm -f datacenter-gpu-manager_*.deb

ENTRYPOINT ["/usr/bin/dcgmproftester11"]
EOF

DIR=.
DCGM_REL_VERSION=2.0.10
BASE_DIST=ubuntu18.04
CUDA_VER=11.0
IMAGE_NAME=nvidia/samples:dcgmproftester-$DCGM_REL_VERSION-cuda$CUDA_VER-$BASE_DIST


docker build --pull \
        -t "$IMAGE_NAME" \
        --build-arg DCGM_VERSION=$DCGM_REL_VERSION \
        --build-arg BASE_DIST=$BASE_DIST \
        --build-arg CUDA_VER=$CUDA_VER \
        --file Dockerfile \
        "$DIR"

popd
Try running it in Docker before deploying the container on the Kubernetes cluster. In this example, trigger FP16 matrix-multiply using the Tensor Cores by specifying -t 1004 and run the test for -d 45 (45 seconds). You can try running other workloads by modifying the -t parameter.
$ docker run --rm --gpus all --cap-add=SYS_ADMIN nvidia/samples:dcgmproftester-2.0.10-cuda11.0-ubuntu18.04 --no-dcgm-validation -t 1004 -d 45

Skipping CreateDcgmGroups() since DCGM validation is disabled
CU_DEVICE_ATTRIBUTE_MAX_THREADS_PER_MULTIPROCESSOR: 1024
CU_DEVICE_ATTRIBUTE_MULTIPROCESSOR_COUNT: 40
CU_DEVICE_ATTRIBUTE_MAX_SHARED_MEMORY_PER_MULTIPROCESSOR: 65536
CU_DEVICE_ATTRIBUTE_COMPUTE_CAPABILITY_MAJOR: 7
CU_DEVICE_ATTRIBUTE_COMPUTE_CAPABILITY_MINOR: 5
CU_DEVICE_ATTRIBUTE_GLOBAL_MEMORY_BUS_WIDTH: 256
CU_DEVICE_ATTRIBUTE_MEMORY_CLOCK_RATE: 5001000
Max Memory bandwidth: 320064000000 bytes (320.06 GiB)
CudaInit completed successfully.

Skipping WatchFields() since DCGM validation is disabled
TensorEngineActive: generated ???, dcgm 0.000 (27605.2 gflops)
TensorEngineActive: generated ???, dcgm 0.000 (28697.6 gflops)
TensorEngineActive: generated ???, dcgm 0.000 (28432.8 gflops)
TensorEngineActive: generated ???, dcgm 0.000 (28585.4 gflops)
TensorEngineActive: generated ???, dcgm 0.000 (28362.9 gflops)
TensorEngineActive: generated ???, dcgm 0.000 (28361.6 gflops)
TensorEngineActive: generated ???, dcgm 0.000 (28448.9 gflops)
TensorEngineActive: generated ???, dcgm 0.000 (28311.0 gflops)
TensorEngineActive: generated ???, dcgm 0.000 (28210.8 gflops)
TensorEngineActive: generated ???, dcgm 0.000 (28304.8 gflops)
Schedule this onto your Kubernetes cluster and see the appropriate metrics in the Grafana dashboard. The following code example constructs this podspec with the appropriate arguments to the container:
cat << EOF | kubectl create -f -
 apiVersion: v1
 kind: Pod
 metadata:
   name: dcgmproftester
 spec:
   restartPolicy: OnFailure
   containers:
   - name: dcgmproftester11
     image: nvidia/samples:dcgmproftester-2.0.10-cuda11.0-ubuntu18.04
     args: ["--no-dcgm-validation", "-t 1004", "-d 120"]
     resources:
       limits:
          nvidia.com/gpu: 1
     securityContext:
       capabilities:
          add: ["SYS_ADMIN"]

EOF
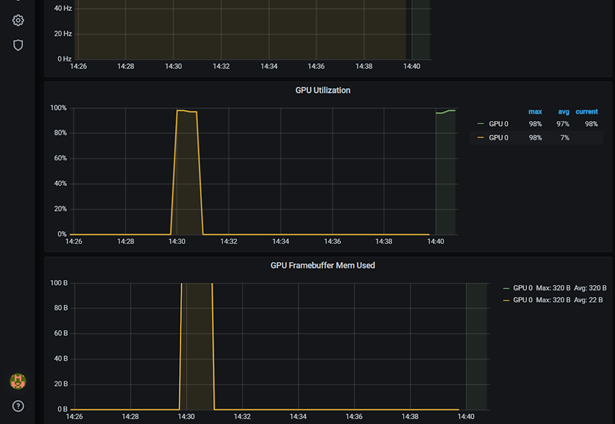
You can see the dcgmproftester pod running, followed by the metrics being shown on the Grafana dashboard. The GPU utilization (GrActive) has reached a peak of 98% utilization. You may also find the other metrics interesting, such as power or GPU memory.
$ kubectl get pods -A
NAMESPACE     NAME                                                              READY   STATUS    RESTARTS   AGE
...
default       dcgmproftester                                                    1/1     Running   0          6s
...
Verifying the GPU metrics
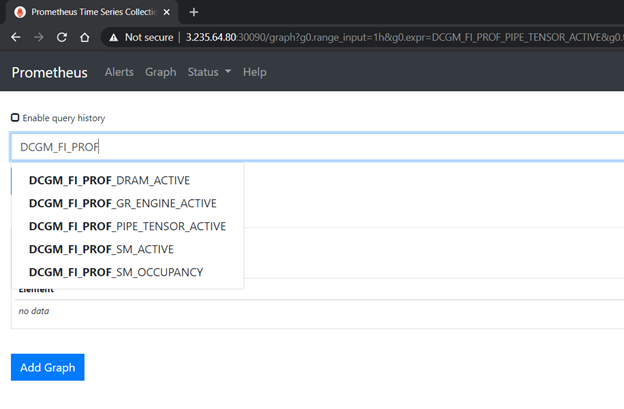
DCGM recently added some device-level metrics. These include fine-grained GPU utilization metrics, which enable monitoring SM occupancy and Tensor Core utilization. For more information, see Profiling Metrics in the DCGM User Guide. For convenience, when you deploy dcgm-exporter using the Helm chart, it is configured to gather these metrics by default.
Figure 5 shows verifying the profiling metrics being served by dcgm-exporter in the Prometheus dashboard.
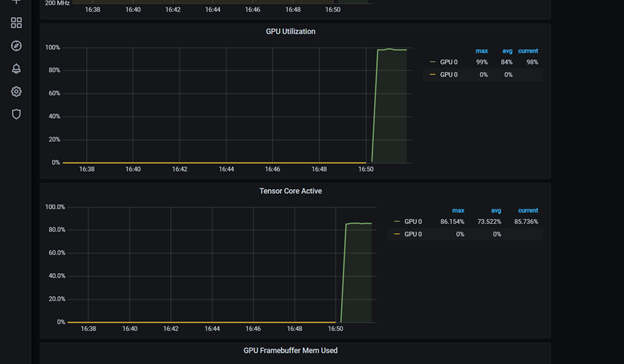
You can customize the Grafana dashboard to include other metrics from DCGM. In this case, add the Tensor Core utilization to the dashboard by editing the Grafana JSON file available on the repo. You can also use the Grafana web interface. Feel free to modify the dashboard.
This dashboard includes the Tensor Core utilization. You can customize it further. After re-starting the dcgmproftester container, you can see that the Tensor Cores on the T4 have reached ~87% utilization:
Feel free to modify the JSON dashboard to include other GPU metrics that DCGM supports. The supported GPU metrics are available in the DCGM DCGM API documentation. By using GPU metrics as custom metrics and Prometheus Adapter, you can use the Horizontal Pod Autoscaler to scale the number of pods based on GPU utilization or other metrics.
Summary
To get started with dcgm-exporter today and put your monitoring solution on Kubernetes, either on-premises or in the cloud, see Integrating GPU Telemetry into Kubernetes, or deploy it as part of the NVIDIA GPU Operator. The official GitHub code repository is NVIDIA/gpu-monitoring-tools and we would love to hear your feedback! Feel free to file issues or new feature requests at NVIDIA/gpu-monitoring-tools/issues.
