The NVIDIA Tools Extension (NVTX) library lets developers annotate custom events and ranges within the profiling timelines generated using tools such as the NVIDIA Visual Profiler (NVVP) and NSight. In my own optimization work, I rely heavily on NVTX to better understand internal as well as customer codes and to spot opportunities for better interaction between the CPU and the GPU.
Two previous Pro Tip posts on Parallel Forall showed how to use NVTX in CUDA C++ and MPI codes. In this post, I’ll show how to use NVTX to annotate the profiles of Fortran codes (with either CUDA Fortran or OpenACC).
NVTX has a lot of features, but here I’ll focus on using it to annotate the profiler output with timeline markers using nvtxRangePush() and nvtxRangePop(). I’ll show you how to insert markers with custom labels and colors.
To make it easy, I’ve written a Fortran module to instrument CUDA/OpenACC Fortran codes that works like the macro that Jiri Krauss wrote about in his post on NVTX. The nvtx module is simple to use. After loading the module, just call nvtxStartRange() / nvtxEndRange() to insert markers in the timeline. Calls to nvtxStartRange() with a single argument generate green markers, or you can specify one of seven available colors using an optional second integer parameter.
The following test code generates a green labeled range encompassing the whole run, and 14 custom ranges labeled with the iteration number that cycle through the predefined set of seven colors.
program main
  use nvtx
  character(len=4) :: itcount

  ! First range with standard color
  call nvtxStartRange("First label")

  do n=1,14
    ! Create custom label for each marker
    write(itcount,'(i4)') n

    ! Range with custom  color
    call nvtxStartRange("Label "//itcount,n)

    ! Add sleep to make markers big
    call sleep(1)

    call nvtxEndRange
  end do

  call nvtxEndRange
end program main
To compile the code and generate an executable, pass the location of the libnvToolsExt (usually /usr/local/cuda/lib on 32-bit systems or /usr/local/cuda/lib64 on 64-bit systems) and the library name, as follows.
$ pgf90 nvtx.cuf -L/usr/local/cuda/lib -lnvToolsExt
You can quickly generate profiler output by running nvprof and saving it to a file with the “-o” flag:
$ nvprof -o profiler.output ./a.out
 ==10653== NVPROF is profiling process 10653, command: ./a.out
 ==10653== Generated result file: /Users/mfatica/profiler.output
With CUDA 7.5, it is now possible to visualize the output straight from the command line with NVVP (In previous versions, you need to select “File->Import”, then select “Nvprof”, click “Next”, select “Single process”, and then browse to the output of nvprof.):
$ nvvp -o profiler.output
NVVP generates the timeline in Figure 1.
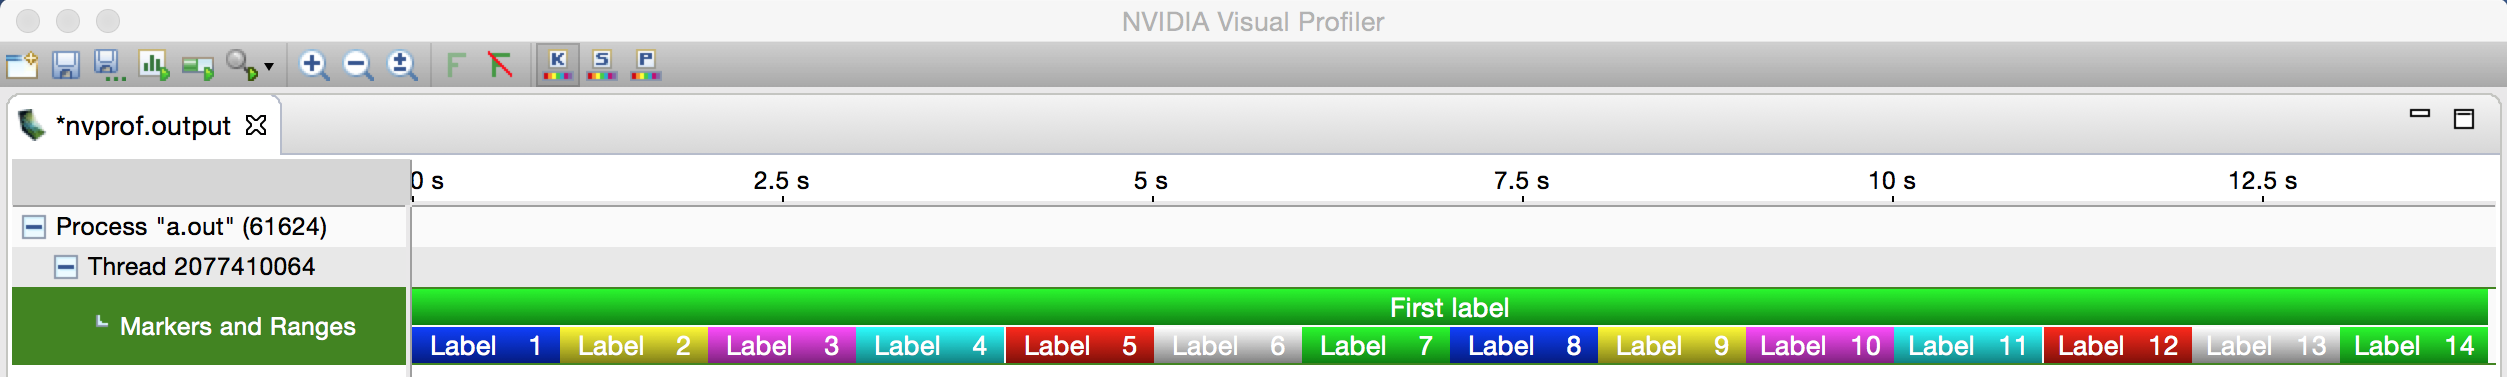
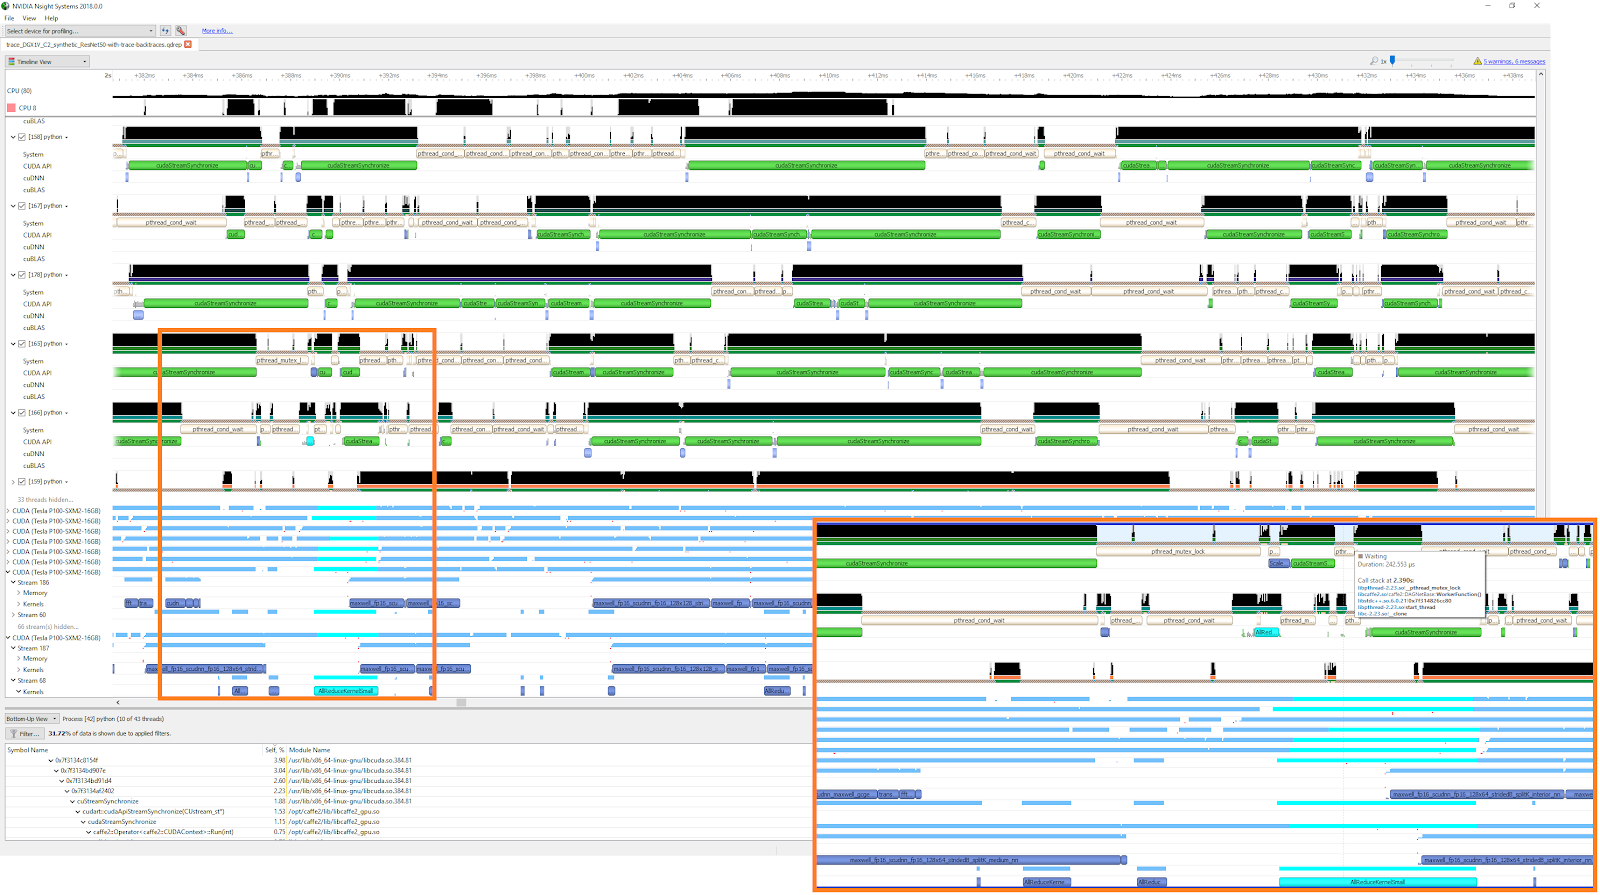
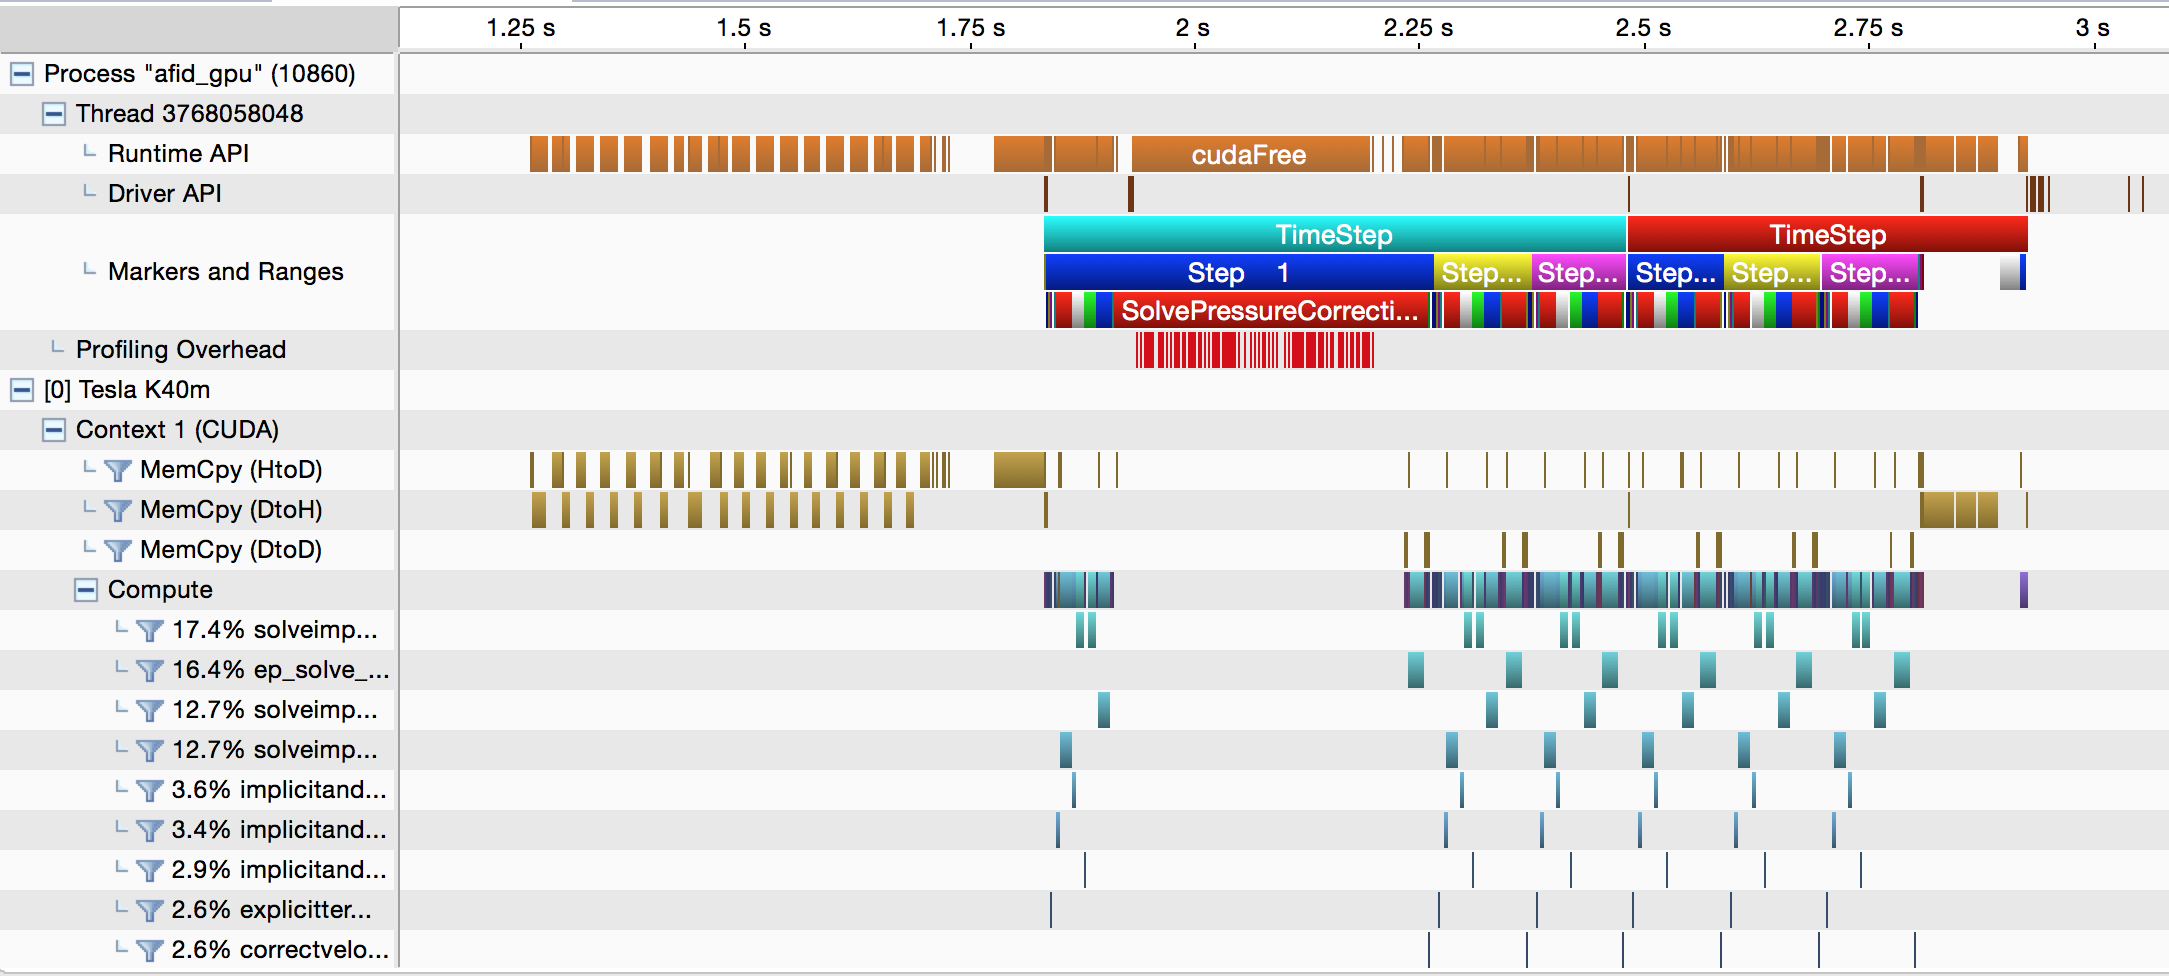
The example had no GPU kernels, so the timeline isn’t very interesting. But you can use the same methodology to generate more complex traces with CPU and GPU markers, as Figure 2 shows.
NVTX Fortran Module Code
Following is the code for the nvtx module. The code uses the Fortran ISO C Binding module to create an interface to the NVTX C functions. It also uses the “optional” keyword to handle the custom color parameter.
module nvtx

use iso_c_binding
implicit none

integer,private :: col(7) = [ Z'0000ff00', Z'000000ff', Z'00ffff00', Z'00ff00ff', Z'0000ffff', Z'00ff0000', Z'00ffffff']
character(len=256),private :: tempName

type, bind(C):: nvtxEventAttributes
  integer(C_INT16_T):: version=1
  integer(C_INT16_T):: size=48 !
  integer(C_INT):: category=0
  integer(C_INT):: colorType=1 ! NVTX_COLOR_ARGB = 1
  integer(C_INT):: color
  integer(C_INT):: payloadType=0 ! NVTX_PAYLOAD_UNKNOWN = 0
  integer(C_INT):: reserved0
  integer(C_INT64_T):: payload   ! union uint,int,double
  integer(C_INT):: messageType=1  ! NVTX_MESSAGE_TYPE_ASCII     = 1
  type(C_PTR):: message  ! ascii char
end type

interface nvtxRangePush
  ! push range with custom label and standard color
  subroutine nvtxRangePushA(name) bind(C, name='nvtxRangePushA')
  use iso_c_binding
  character(kind=C_CHAR,len=*) :: name
  end subroutine

  ! push range with custom label and custom color
  subroutine nvtxRangePushEx(event) bind(C, name='nvtxRangePushEx')
  use iso_c_binding
  import:: nvtxEventAttributes
  type(nvtxEventAttributes):: event
  end subroutine
end interface

interface nvtxRangePop
  subroutine nvtxRangePop() bind(C, name='nvtxRangePop')
  end subroutine
end interface

contains

subroutine nvtxStartRange(name,id)
  character(kind=c_char,len=*) :: name
  integer, optional:: id
  type(nvtxEventAttributes):: event

  tempName=trim(name)//c_null_char

  if ( .not. present(id)) then
    call nvtxRangePush(tempName)
  else
    event%color=col(mod(id,7)+1)
    event%message=c_loc(tempName)
    call nvtxRangePushEx(event)
  end if
end subroutine

subroutine nvtxEndRange
  call nvtxRangePop
end subroutine

end module nvtx
You can customize the interface to your needs. For example, you could add more colors, add a variant that includes a call to cudaDeviceSynchronize() to better mark GPU kernels, or add more functions from NVTX. You now have the power to use NVTX in Fortran code to better understand the hot spots in your applications.