
Often when profiling GPU-accelerated applications that run on clusters, one needs to visualize MPI (Message Passing Interface) calls on the GPU timeline in the profiler. While tools like Vampir and Tau will allow programmers to see a big picture view of how a parallel application performs, sometimes all you need is a look at how MPI is affecting GPU performance on a single node using a simple tool like the NVIDIA Visual Profiler. With the help of the NVIDIA Tools Extensions (NVTX) and the MPI standard itself, this is pretty easy to do.
The NVTX API lets you embed information within a GPU profile, such as marking events or annotating ranges in the timeline with details about application behavior during that time. Jiri Kraus wrote past posts about generating custom application timelines with NVTX, and about using it to label individual MPI ranks in MPI profiles. In this post I’ll show you how to use an NVTX range to annotate the time spent in MPI calls. To do this, we’ll use the MPI profiling interface (PMPI), which is a standard part of MPI. PMPI allows tools to intercept calls to the MPI library to perform actions before or after the MPI call is executed. This means that we can insert NVTX calls into our MPI library calls to mark MPI calls on the GPU timeline.
Wrapping every MPI routine in this way is a bit tedious, but fortunately there’s a tool to automate the process. We’ll use the wrap.py script found at https://github.com/scalability-llnl/wrap to generate the PMPI wrappers for a number of commonly used MPI routines. The input file for this script is the following (also available as a github gist):
#include <pthread.h>
#include <nvToolsExt.h>
#include <nvToolsExtCudaRt.h>
// Setup event category name
{{fn name MPI_Init}}
  nvtxNameCategoryA(999, "MPI");
  {{callfn}}
  int rank;
  PMPI_Comm_rank(MPI_COMM_WORLD, &rank);
  char name[256];
  sprintf( name, "MPI Rank %d", rank );

  nvtxNameOsThread(pthread_self(), name);
  nvtxNameCudaDeviceA(rank, name);
{{endfn}}
// Wrap select MPI functions with NVTX ranges
{{fn name MPI_Send MPI_Recv MPI_Allreduce MPI_Reduce MPI_Wait MPI_Waitany
MPI_Waitall MPI_Waitsome MPI_Gather MPI_Gatherv MPI_Scatter MPI_Scatterv
MPI_Allgather MPI_Allgatherv MPI_Alltoall MPI_Alltoallv MPI_Alltoallw MPI_Bcast
MPI_Sendrecv MPI_Barrier MPI_Start MPI_Test MPI_Send_init MPI_Recv_init }}
  nvtxEventAttributes_t eventAttrib = {0};
  eventAttrib.version = NVTX_VERSION;
  eventAttrib.size = NVTX_EVENT_ATTRIB_STRUCT_SIZE;
  eventAttrib.messageType = NVTX_MESSAGE_TYPE_ASCII;
  eventAttrib.message.ascii  = "{{name}}";
  eventAttrib.category = 999;

  nvtxRangePushEx(&eventAttrib);
  {{callfn}}
  nvtxRangePop();
{{endfn}}
So what’s happening in this file? First, it includes the NVTX header file, and then loops over a series of common MPI functions and inserts the beginning of an NVTX range (nvtxRangePushEx) and then ends the range as we leave the MPI routine (nvtxRangePop). For convenience, I’ve named the range after the MPI routine being called. All I need to do now is call wrap.py to generate a C file with my PMPI wrappers, which I’ll then build with my MPI C compiler.
$ python wrap/wrap.py -g -o nvtx_pmpi.c nvtx.w
$ mpicc -c nvtx_pmpi.c
Now I just need to rerun my code with these wrappers. To do this I’ll relink my application with the object file I just built and the NVTX library (libnvToolsExt). As an example, I’ll use the simple Jacobi Iteration used in the GTC session Multi GPU Programming with MPI, which you can find on Github. Once I’ve built both the application and the wrappers generated above, I run the executable as follows.
$ mpicc -fast -ta=tesla -Minfo=all $HOME/nvtx_pmpi.o laplace2d.c -L$CUDA_HOME/lib64 -lnvToolsExt -o laplace2d
$ MV2_USE_CUDA=1 mpirun -np 2 nvprof -o laplace2d.%q{MV2_COMM_WORLD_RANK}.nvvp ./laplace2d
One word of caution: the linking order does matter when using tools such as PMPI, so if you run your code and are not seeing the expected results, the object file containing the wrappers may not appear early enough in the build command.
In the above commands I’m rebuilding my code with the necessary bits. I’m also setting MV2_USE_CUDA at runtime to enable cuda-awareness in my MVAPICH library. Additionally I’m informing nvprof to generate a timeline file per-MPI process by passing the MV2_COMM_WORLD_RANK environment variable to nvprof, which is defined to equal the MPI rank of each process. Figure 1 is the result of importing one of these resulting nvprof output files into Visual Profiler and then zooming in to an area of interest.
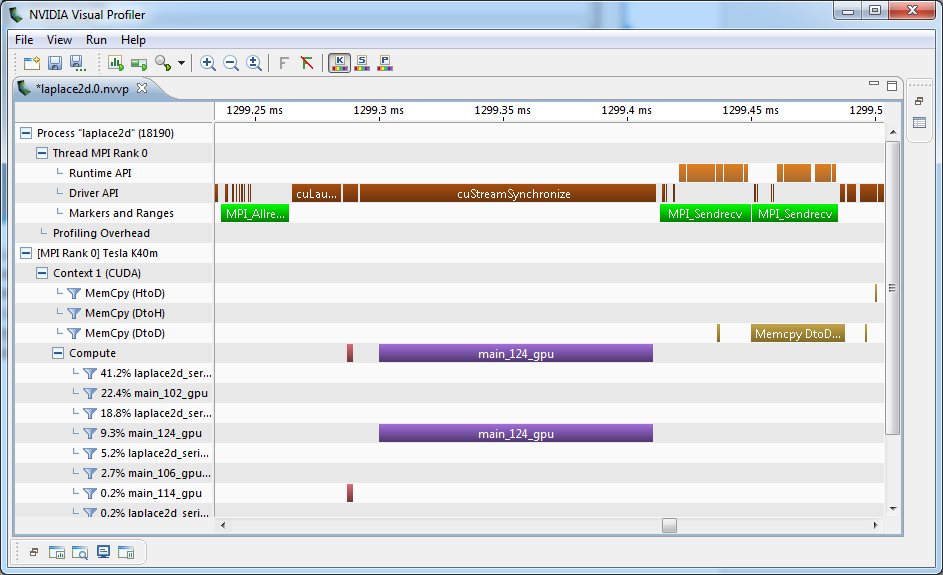
Looking in the “Markers and Ranges” row of the GPU timeline for MPI Rank 0, we see three green boxes denoting two calls to MPI_Sendrecv and one to MPI_Allreduce. Furthermore, we can see that the MPI library is using a device-to-device memcpy operation to communicate between two GPUs on the same node. As you can see, the NVIDIA Visual Profiler, combined with PMPI and NVTX can give you interesting insights into how the MPI calls in your application interact with the GPU.