Recommender systems are a critical resource for enterprises that are relentlessly striving to improve customer engagement. They work by suggesting potentially relevant products and services amongst an overwhelmingly large and ever-increasing number of offerings. NVIDIA Merlin is an application framework that accelerates all phases of recommender system development on NVIDIA GPUs, from experimentation (data processing, data loading, and model training) to production deployment either on-premises or in-cloud.
The term recommender systems imply that they are not just a mere model but an entire pipeline. It is important that all pieces work together like a well-oiled machine. More importantly, these are dynamic systems that need to constantly evolve and adapt (through digestion of new data or algorithmic improvement of the model). The ability to quickly and continuously integrate and deliver these improvements into production is critical for the recommendation system to stay effective.
According to Google Cloud, MLOps is an ML engineering culture and practice that aims at unifying ML system development (Dev) and ML system operation (Ops). MLOps takes both its name as well as some of the core principles and tooling from DevOps. This makes sense as the goals of MLOps and DevOps are practically the same: to reduce the time and effort required to develop, deploy, and maintain high-quality ML software in production.
In this post, we focus on how Merlin components fit into a complete MLOps pipeline and demonstrate with a hands-on example deployed with KubeFlow Pipelines on Google Kubernetes Engine (GKE). When we use the term Merlin MLOps in this post, we mean the act of operationalizing Merlin with MLOps tools and practices.
Reference architecture: MLOps for Merlin
Here’s a quick review of the Merlin components, as well as different levels of MLOps. The Merlin application framework supports all phases of recommender system development on the GPUs.
- Data preprocessing and feature engineering: Merlin NVTabular is a high-performance library designed for processing terabyte-scale tabular datasets. It scales seamlessly from single to multi-GPU systems.
- Model training: Merlin HugeCTR is a recommender system framework for training state-of-the-art deep learning recommendation models such as DLRM, Wide and Deep, Deep Cross Network (DCN), and so on. It scales seamlessly on multiple GPUs and multi-GPU nodes.
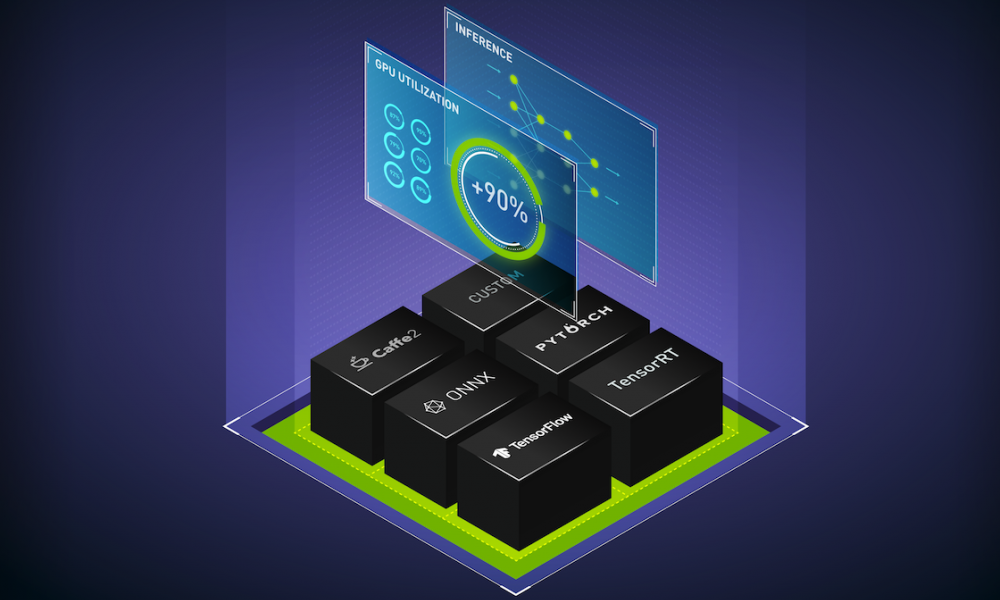
- Production inference: The NVIDIA Triton Inference Server coupled with a HugeCTR inference backend provides a robust high-throughput and low-latency production environment. NVIDIA Triton can be deployed either on-premises or in-cloud, and it is fully compatible with the Kubernetes ecosystem.
Given the capabilities of Merlin, we now review the three levels of MLOps according to Google Cloud’s definition:
- Level 0: Manual process and pipeline.
- Level 1: Pipeline with some automation, such as monitoring and triggers, automated retraining, and redeployment of ML models (continuous retraining).
- Level 2: Fully automated pipeline with continuous integration and delivery (CI/CD).
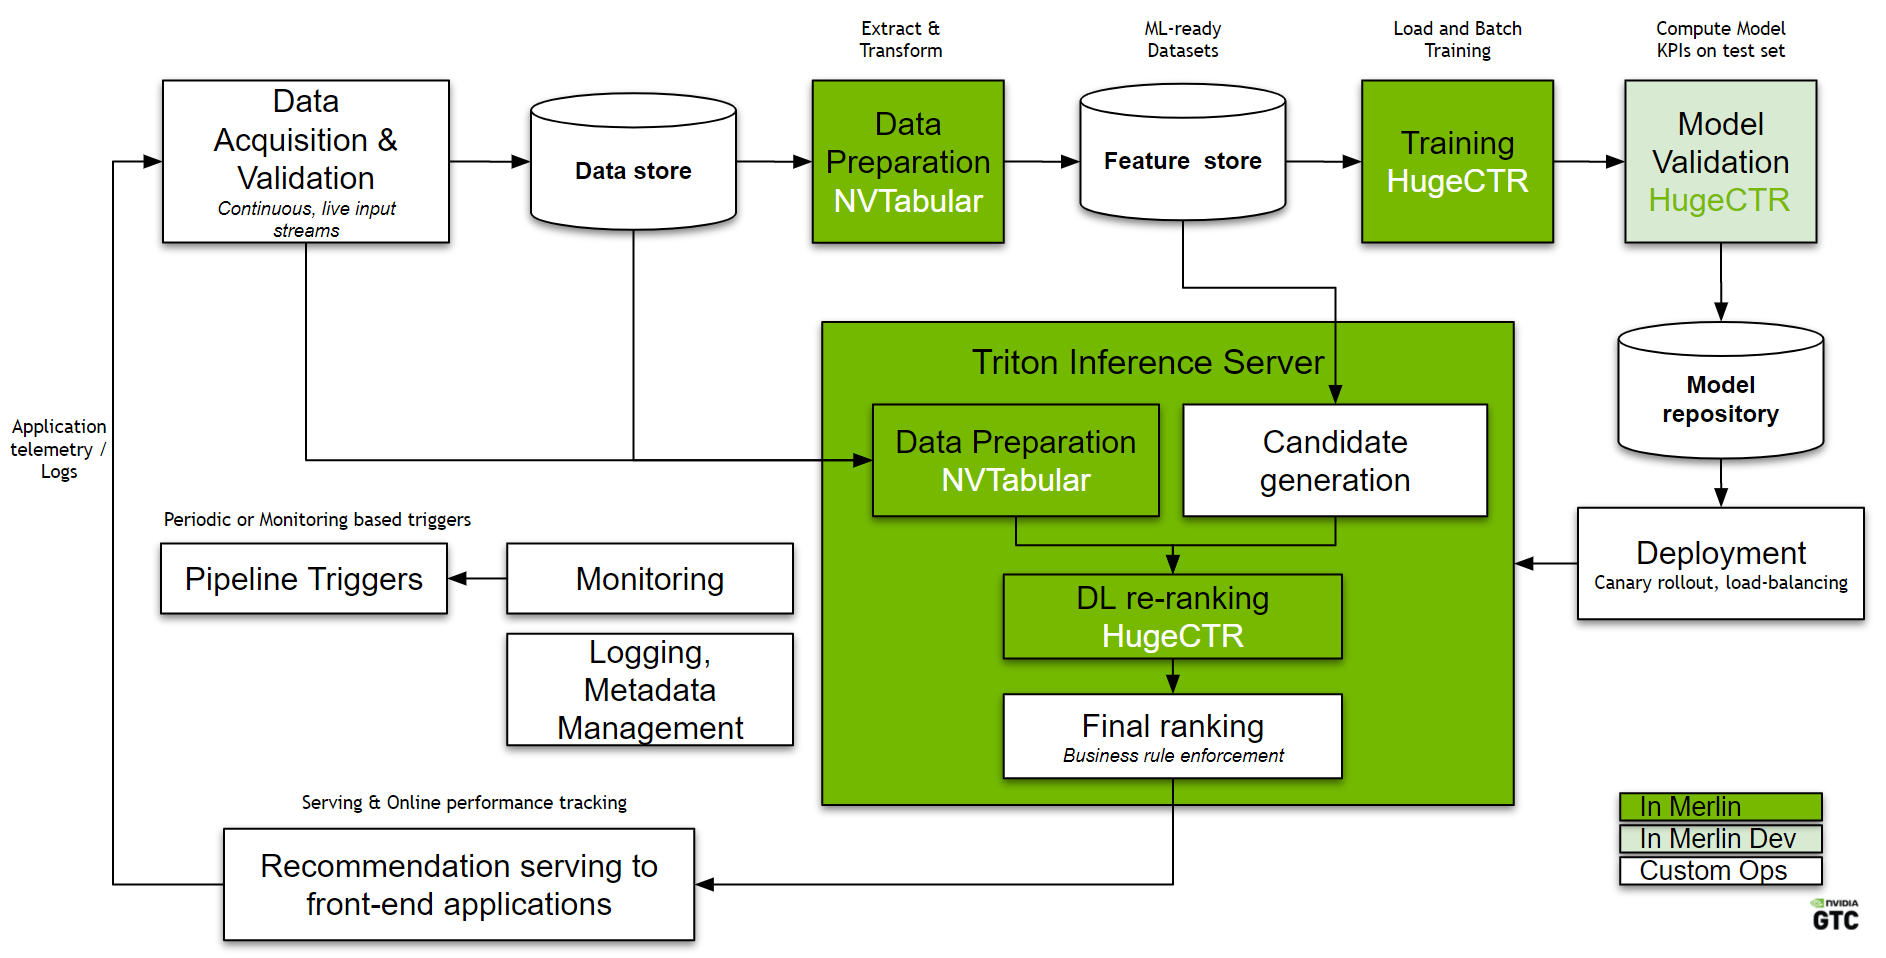
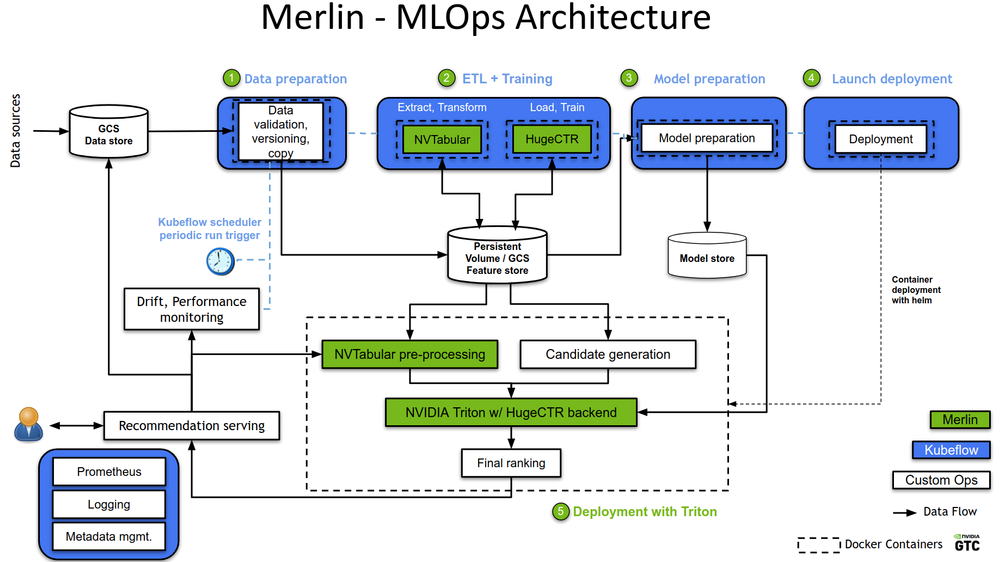
Figure 1. A high-level overview of Merlin MLOps.
Figure 1 shows a Level 1 Merlin MLOps workflow, with a fully automated pipeline and continuous retraining. Look deeper into this architecture:
- Data pipeline: Every recommender system starts with data about users, items, and their interactions. Data is collected and stored in a data lake. From the data lake, a subset of data (based on time range and number of features) is extracted and prepared for model training (preprocessing, feature engineering). A data validation module ensures that the test data is as expected while also detecting data drift.
- Continuous re-training: At first, the recommendation model is trained on a large amount of available data and deployed. Continuous incremental retraining ensures that the model stays up-to-date and captures the latest trends and user preferences. A model validation module ensures that the model meets a specified quality threshold.
- Deployment and serving: An automated redeployment pipeline puts the new qualified model into production in a seamless manner. The number of GPU inference servers automatically scales up and down as needed.
- Logging and monitoring: Monitoring modules continuously monitor the quality of the recommendation in real-time through a range of KPIs, such as hit rate and conversion rate. The modules trigger full retraining should model drift happen, that is, if certain KPIs fall below known established baselines.
Merlin MLOps with Kubeflow Pipelines on Google Kubernetes Engine
In this section, we walk through a concrete example of realizing the workflow with Kubeflow pipelines and GKE.
GKE provides a managed environment for deploying, managing, and scaling containerized applications using Google Cloud infrastructure. Kubeflow Pipelines is a platform for building and deploying portable, scalable machine learning (ML) workflows based on Docker containers. With an existing GKE cluster, Kubeflow pipelines can be installed easily with a push of a button. We selected Kubeflow Pipelines as the orchestrator that wields together the components of a Merlin MLOps pipeline.
In the Kubernetes world, applications are containerized. Merlin Docker containers are available on NGC, including the Merlin training and inference containers. These containers can be pulled, and then pushed to Google Cloud Container Registry, ready to be used with GKE.
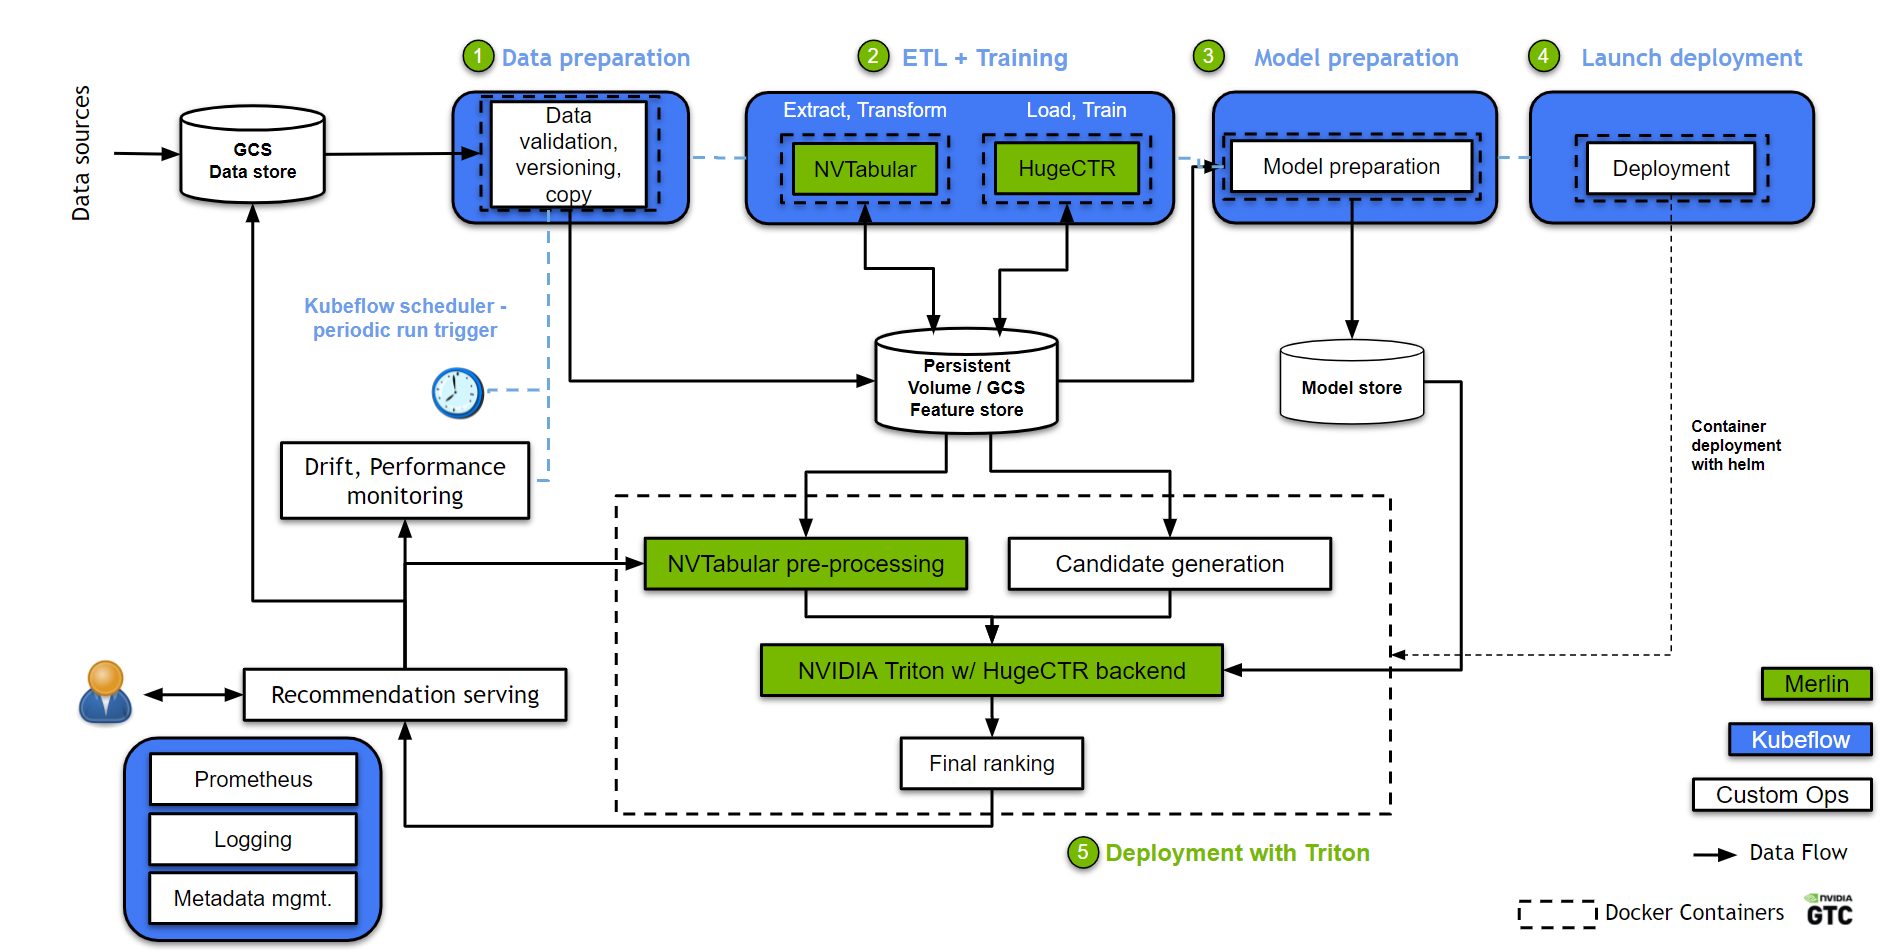
In Figure 2, we mapped the conceptual workflow components in Figure 1 to concrete GCP and GKE components:
- Data pipeline: Data is collected and stored in a data store, which in this case is a Google Cloud Storage (GCS) bucket. A data extraction module extracts and copies the relevant data to a high-speed active working space. In this example, it is a GKE-persistent volume for preprocessing and model training. A data validation module based on TensorFlow Data Validation analyzes the training data to detect data drift.
- Continuous re-training: A Merlin training pod is used for data preprocessing and model training.
- NVTabular is responsible for data preprocessing, feature engineering, and persisting the preprocessed dataset into the pipeline-shared persistent volume.
- Next, HugeCTR picks up the preprocessed data and trains a DCN model. The model can be updated either using incremental data or trained from scratch using all or a large amount of available data.
- Deployment and serving: The deployment module prepares the HugeCTR trained model for production. Prepared models are then stored in a model store in GCS. Depending on the application domains, model serving can involve two steps:
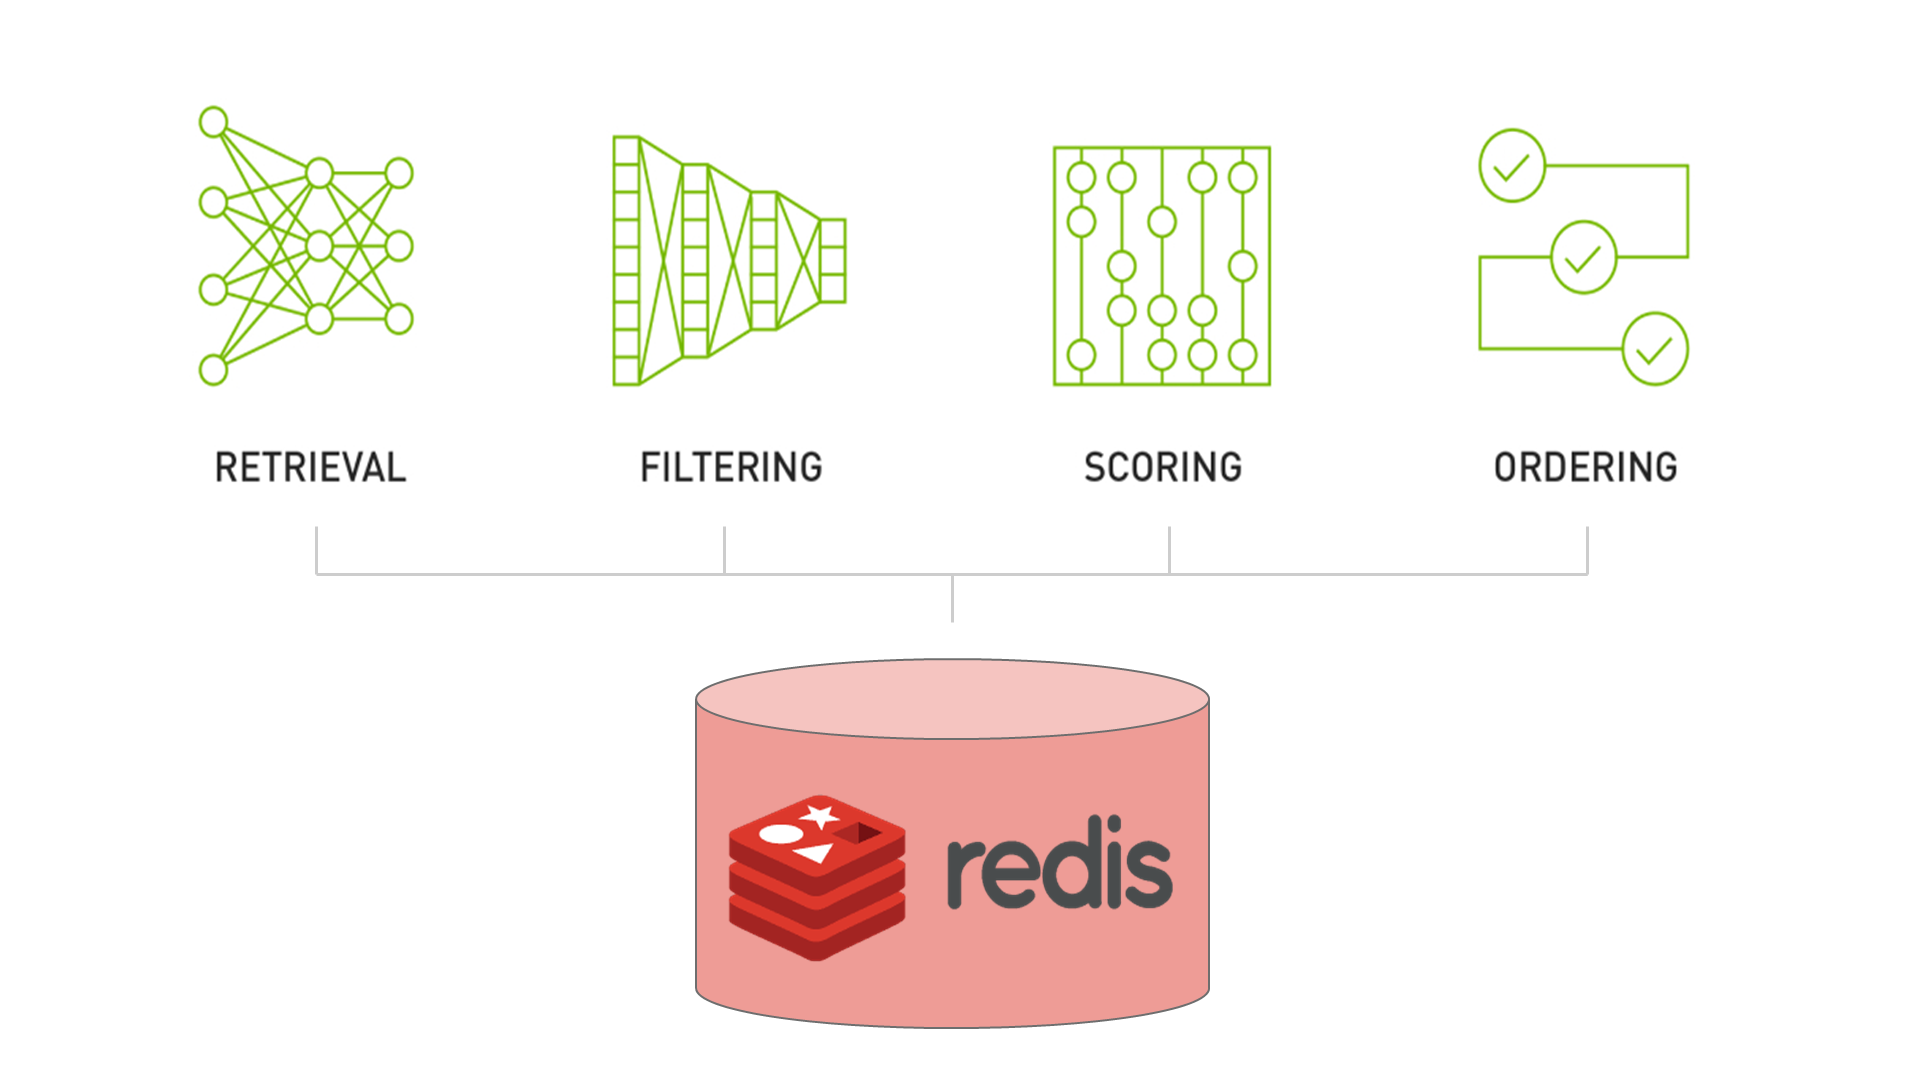
- Candidate generation reduces the number of candidates from a space potentially as large as millions of items to a computationally manageable amount, for example, thousands of items.
- The Merlin inference pod picks up and serves the latest HugeCTR trained model from the model store. This inference container contains the Triton Inference Server with a HugeCTR inference backend. The model re-ranks the generated candidates and serves the top scoring ones.
- Logging and monitoring: The monitoring pod continuously monitors the quality of the recommendation in real-time (hit rate, conversion rate) and automatically triggers full retraining upon detecting significant model drift. NVIDIA Triton and the monitoring module log statistics into Prometheus and Grafana.
Criteo Terabyte click log dataset case study
In this example, we demonstrate the Merlin MLOps pipeline on Kubeflow pipelines and GKE using the Criteo Terabyte click log dataset, which is one of the largest public datasets in the recommendation domain. It contains ~1.3 TB of uncompressed click logs containing over four billion samples spanning 24 days and can be used to train recommender system models that predict the ad clickthrough rate. Features are anonymized and categorical values are hashed to ensure privacy. Each record in this dataset contains 40 values:
- A label indicating a click (value 1) or no click (value 0)
- 13 values for numerical features
- 26 values for categorical features
Because this data set contains only interaction data and no data on users, items, and their attributes, we skipped the candidate generation and final ranking parts and only implemented the deep learning scoring model to predict whether users will click on the ad.
Technical highlights
In this section, we discuss some of the major highlights pertaining to our implementation.
Multi-instance GPU on GKE
To maximize GPU usage, NVIDIA Triton is deployed on a GKE A100 MIG instance. NVIDIA Multi-instance GPU (MIG) technology partitions a single NVIDIA A100 GPU into as many as seven independent GPU instances. They run simultaneously, each with its own memory, cache, and streaming multiprocessors. That enables the A100 GPU to deliver guaranteed quality-of-service (QoS) at up to 7x higher utilization compared to prior GPUs. Small recommendation models that fit into the memory of a MIG instance can be deployed onto a GKE MIG instance of the appropriate size. That being said, we are working on relaxing this memory requirement through embedding table caching. Stay tuned!
GPU autoscaling
NVIDIA Triton deployment can be scaled using default metrics like CPU/GPU utilization, memory usage, and so on, and also using custom metrics. For this example, we use a custom metric exported to the Prometheus operator based on the average time spent by the incoming request in the inference queue. If the inference load on NVIDIA Triton increases, then the time spent by the incoming requests in the inference queue goes up as well.
To balance the increase in load, the Horizontal Pod Autoscaler (HPA) can schedule another NVIDIA Triton Pod on freely available GPU nodes. If no nodes are available in the GPU node pool, then the HPA kicks in the GKE node autoscaler that assigns a new GPU node to the GPU node pool. After a new node is available in the cluster, the Kubernetes Pod scheduler schedules a new instance of the NVIDIA Triton Pod on that GPU node. The load balancer can then route the pending incoming requests in the queue to the newly created NVIDIA Triton Pod. Subsequently, if the load decreases, the autoscaler can scale down the nodes.
Sending inference requests
An end-user interacts with the inference server indirectly through a client application or recommendation API, which translates user requests and responses to inference requests. To this end, we include a test inference client app that can be used to read Criteo .parquet files and send inference gRPC requests to the NVIDIA Triton endpoint.
Monitoring
In an ML system, the relationship between the independent and the target variables can change over time. As a result, the model predictions can gradually become erroneous. In this example pipeline, we have a monitoring module that is tasked with tracking the performance (in this case, AUC score) and triggering another run of the pipeline if AUC drifts below a certain threshold. The monitoring module runs as a separate pod in the GKE cluster.
How does it get access to the request data? In the reference design, the test inference client is responsible for logging the inference requests using Cloud Pub/Sub, where the inference client publishes the requests and corresponding inference results to the Pub/Sub broker, and the monitoring module subscribes to it. Using this asynchronous mechanism, monitoring can assess the performance and take appropriate action like triggering the Kubeflow pipeline for retraining if required. It also writes these requests periodically to a volume, which a daemon job pushes to the GCS bucket for use in the next round of continuous training. This data collection closes the loop in the system and allows the new incoming requests as fresh data that the pipeline can use for incremental training from the previous checkpoint.
Scope for improvement
The high-level goal of this post was to show an example of a recommender system, built using Merlin components, running in the form of a Kubeflow pipeline. There are several pieces of this example that could be designed in an alternative way or further improved. For instance:
- Cloud Pub/Sub is used for communicating request data from the inference client to the monitoring module. This gives you high scalability, reliability, and advantages of asynchronous behavior. However, this does add an additional dependency on GCP infrastructure. Alternatively, you could use other message queues, like Kafka.
- Data drift could be monitored live, especially in cases where there is no user feedback for served recommendations to estimate model performance. You could plug in a solution similar to the data validation component in monitoring. Additionally, you should first filter outliers out from out-of-distribution samples.
- The data validation component using TensorFlow Data Validation is a simple example showing where such a component could be plugged into the pipeline. There could be other appropriate actions on detecting drift, like notifications to users or taking corrective measures other than logging. There may be other libraries more suitable to your use case, like Great Expectations or Alibi Detect.
Conclusion
This example with Merlin components on a Kubeflow pipeline follows the reference architecture as described earlier. Most ML systems would follow similar architecture, with components for data acquisition and cleaning, preprocessing, training, model serving, monitoring, and so on. As such, these blocks could be replaced with custom containers and code in the pipeline. Any additional modules could be either added to the pipeline itself (like data validation and training) or deployed as a separate pod in the cluster (like inference, and monitoring). This Merlin MLOps example serves as a reference on how you can create, compile, and run your pipelines.
The code and step-by-step instructions to run this Merlin MLOps example are available at the NVIDIA-Merlin/gcp-ml-ops GitHub repo. We’d love to hear about how this project relates to what you’re working on, especially if you have any questions or feedback! You can reach us through the repo or by leaving a comment here.
This post was originally published on the RAPIDS AI blog.
